ICHIMOKU MTFMultiple Time Frame Version of Ichimoku Kinko Hyo Indicator.
Created in 1940's by Goichi Hosoda withe the help of University students in Japan.
Ichimoku is one of the best trend following indicators that works nearly perfect in all markets and time frames.
Ichimoku is originally an built in indicator in Tradingview but there are some problems like:
the indicator hast 5 lines but you can change only 4 parameters in the settings menu of Tradingview Charts which you could only control 3 of the lines effectively. A second problem is that Tradingview preferred to use English titles for the ICHIMOKU lines instead of giving them the most common original Japanese ones. (So I rewrite the indicator)
Kijun Sen (blue line): Also called standard line or base line, this is calculated by averaging the highest high and the lowest low for the past 26 periods.
Tenkan Sen (red line): This is also known as the turning line and is derived by averaging the highest high and the lowest low for the past nine periods.
Chikou Span (Plum line): This is called the lagging line. It is today’s closing price plotted 26 periods behind.
Senkou SpanA (green line): The first Senkou line is calculated by averaging the Tenkan Sen and the Kijun Sen and plotted 26 periods ahead.
Senkou SpanB (purple line):
The second Senkou line is determined by averaging the highest high and the lowest low for the past 52 periods and plotted 26 periods ahead.
PERSONALLY I ADVISE YOU TO USE ICHIMOKU WITH DEAFULT LENGTHS (9,26,26,52,26) IN ORDER FOR STOCK MARKETS AND FOREX MARKETS
FOR CRYPTO YOU'D BETTER USE:
10,30,30,60,30 OR 20,60,60,120,60
THE TRICKY THING IS THAT KEEPING THE 1-3-3-6-3 RATIO CONSTANT IS NECESSARY
Here's a link of my Youtube video explaining ICHIMOKU but unfortunately only in TURKISH:
www.youtube.com
Developed by: Goichi Hosoda
Here's the link to a complete list of all my indicators:
tr.tradingview.com
Ichimoku kullanımı anlattığım detaylı video serisini linkten izleyebilirsiniz:
www.youtube.com
İndikatörü geliştiren: Goichi Hosoda
Cari dalam skrip untuk "indicators"

Accumulation/Distribution Money Flow [Cyrus c|:D]This indicator should be more accurate than other indicators in its class (including MFI, CMF, ADL, and OBV) for measuring buy/sell pressure, identifying trend change through divergence and calculating Accumulation/Distribution (A/D) level (I will explain why in a separate TA).
This indicator is based on my previous indicator "Accumulation/Distribution Volume". It does not include the volume bars. The volume effect is adjustable as well.
Application:
- Buy/sell pressure: above 0 shows buy pressure, below 0 shows sell pressure.
- Divergence: as shown in the chart above, this indicator diverged from BTC price during swing lows and highs in the shown period.
- Accumulation/distribution: set Aggregation=Sum, Volume Exponent=10 and uncheck Price Factor.
Recommendations:
- Never use SMA
- Use larger length EMA for confirmation of divergence or buy/sell pressure (EMA 27 is equal to RMA 14 which is used in RSI).
. A/D mode is not recommended for hidden divergence.
My Setup:
- I use one instances of this indicator with default settings for buy/sell pressure
- A second instance for A/D level overlaid on the main chart
- One instance of "Accumulation/Distribution Volume" as a replacement for volume indicator
This indicator can also replicate Accumulation/Distribution Line (improved by True Range), On Balance Volume, and Price Volume Trend. Read more details on the description of the previous indicator:
I strongly recommend reading about similar indicators for potential uses e.g. www.tradingview.com(MFI) and www.tradingview.com(PVT)
I will publish a TA about correctly measuring divergence and using these indicators.
Please report any problems you find in the comments.

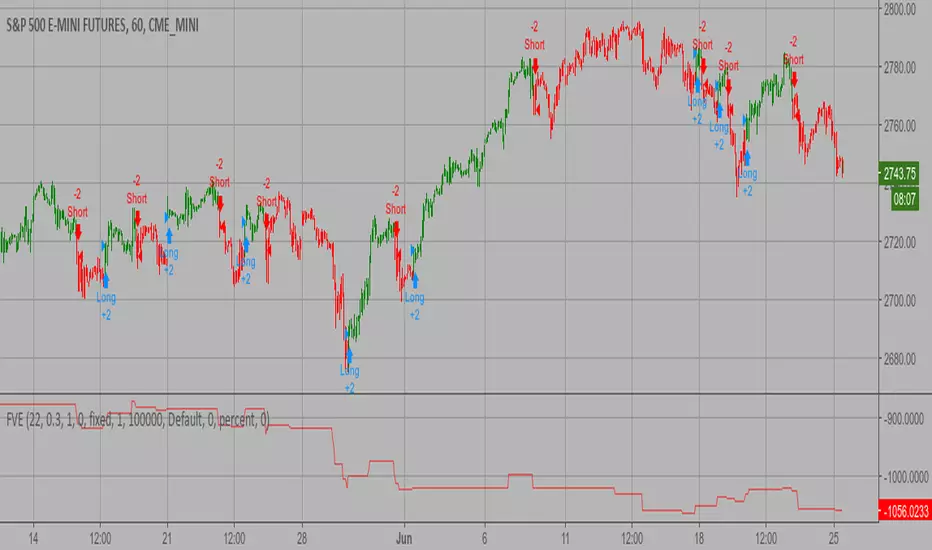
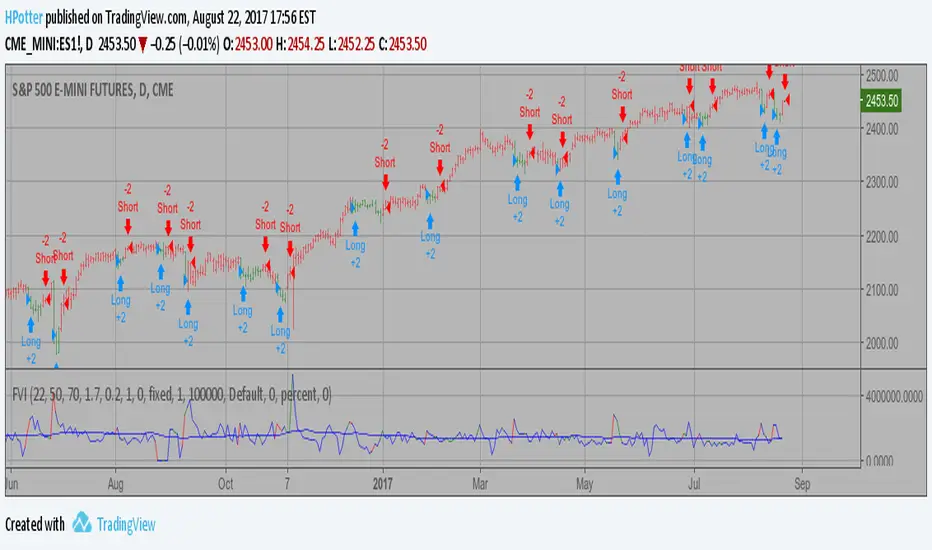
Finite Volume Elements (FVE) Backtest The FVE is a pure volume indicator. Unlike most of the other indicators
(except OBV), price change doesn?t come into the equation for the FVE (price
is not multiplied by volume), but is only used to determine whether money is
flowing in or out of the stock. This is contrary to the current trend in the
design of modern money flow indicators. The author decided against a price-volume
indicator for the following reasons:
- A pure volume indicator has more power to contradict.
- The number of buyers or sellers (which is assessed by volume) will be the same,
regardless of the price fluctuation.
- Price-volume indicators tend to spike excessively at breakouts or breakdowns.
You can change long to short in the Input Settings
WARNING:
- For purpose educate only
- This script to change bars colors.
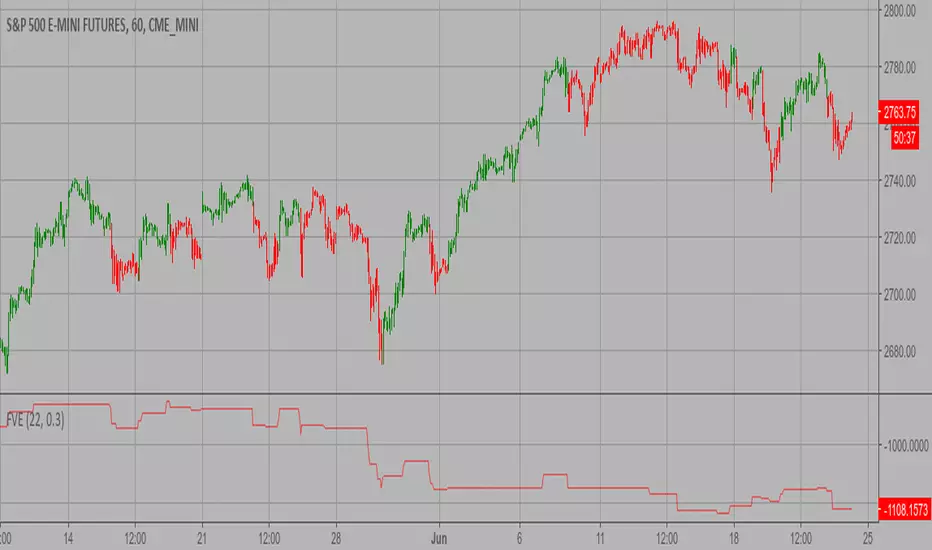
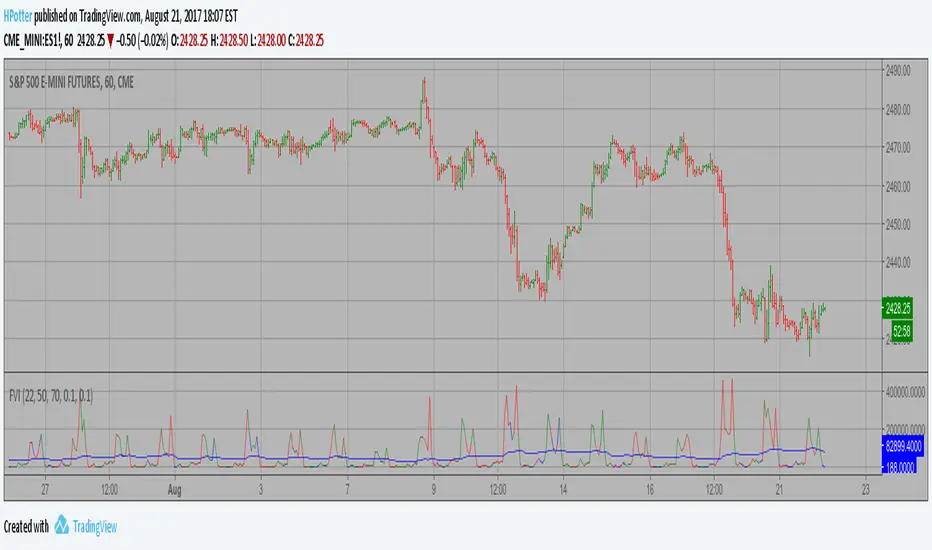
Finite Volume Elements (FVE) Strategy The FVE is a pure volume indicator. Unlike most of the other indicators
(except OBV), price change doesn?t come into the equation for the FVE (price
is not multiplied by volume), but is only used to determine whether money is
flowing in or out of the stock. This is contrary to the current trend in the
design of modern money flow indicators. The author decided against a price-volume
indicator for the following reasons:
- A pure volume indicator has more power to contradict.
- The number of buyers or sellers (which is assessed by volume) will be the same,
regardless of the price fluctuation.
- Price-volume indicators tend to spike excessively at breakouts or breakdowns.
WARNING:
- This script to change bars colors.
Power LineA flexible combination of price and volume rate of change. Signals (sources) can be combined to create familiar indicators like On Balance Volume (OBV), or creativity inspired indicators.
The default settings multiply the change in price (flow) by volume (pressure) which is “money” or “power” (like in an electrical circuit). But, any combination of signals can be multiplied/divided... which might be “power", or something else.
See script comments for full details.
This indicator complements the “Multi Oscillator” indicator:
There are many similarities, but “Power Line” plots one line over price: either as an oscillation type signal or it’s integral, which tracks price in some relationship. The Left Axis is used for scaling.
While this indicator is handy for trading decisions, it's highly educational. It has allowed me to get a feel for other well known indicators, like On Balance Volume (OBV), Chaikin Money Flow (CMF), Accumulation/Distribution Lines (ADL), Money Flow Index (MFI)... and others. And in this process, other composite signals unfold quickly. Let your creativity go!

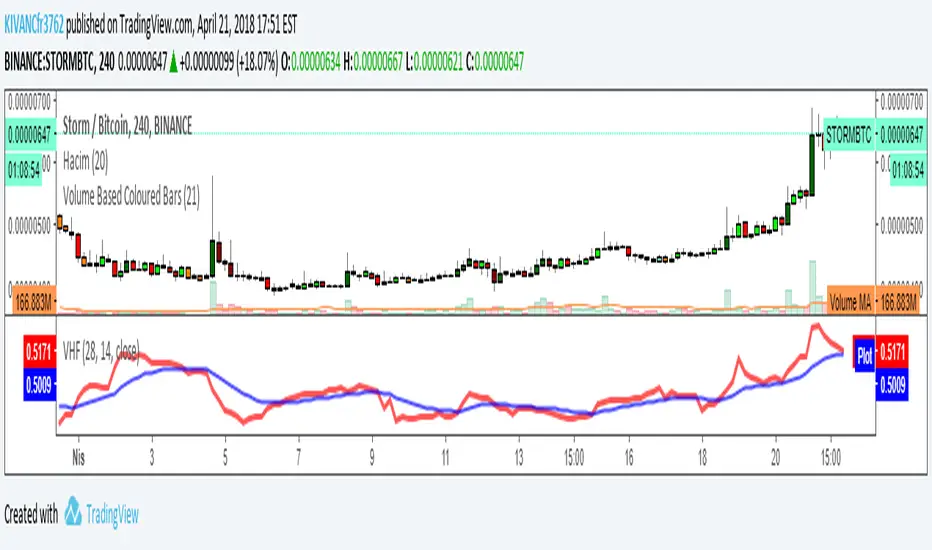
Vertical Horizontal Filter VHF by KIVANÇ fr3762Vertical Horizontal Filter
Vertical Horizontal Filter (VHF) was created by Adam White to identify trending and ranging markets. VHF measures the level of trend activity, similar to ADX in the Directional Movement System. Trend indicators can then be employed in trending markets and momentum indicators in ranging markets.
Vary the number of periods in the Vertical Horizontal Filter to suit different time frames. White originally recommended 28 days but now prefers an 18-day window smoothed with a 6-day moving average.
Trading Signals
Vertical Horizontal Filter does not, itself, generate trading signals, but determines whether signals are taken from trend or momentum indicators.
Rising values indicate a trend.
Falling values indicate a ranging market.
High values precede the end of a trend.
Low values precede a trend start.
I have added an option to plot a deafult value of 14 bar EMA too, to clarify the signals.
Formula
To calculate the Vertical Horizontal Filter:
Select the number of periods (n) to include in the indicator. This should be based on the length of the cycle that you are analyzing. The most popular is 28 days (for intermediate cycles).
Determine the highest closing price ( HCP ) in n periods.
Determine the lowest closing price (LCP) in n periods.
Calculate the range of closing prices in n periods:
HCP - LCP
Next, calculate the movement in closing price for each period:
Closing price - Closing price
Add up all price movements for n periods, disregarding whether they are up or down:
Sum of absolute values of ( Close - Close ) for n periods
Divide Step 4 by Step 6:
VHF = ( HCP - LCP) / (Sum of absolute values for n periods)
created by Adam White
Noro's VixFix + RSI Strategy v1.0Strategy uses 2 indicators:
1) VixFix
2) RSI (period = 7)
For an entrance signals from both indicators at the same time are necessary.

AutoCandlesHi everyone!, this Script is the first in my series of candlesticks indicators. Currently it supports only a few, but it´s quite strict about them, contrary to most scripts I do thorough calculations to avoid false signals, if you would like to soften the indicators so it generates more signals feel free to ask.
It uses the same interface for showing as the Candlestick Scanner by Nicolas, but use different formulas.
I encourage everyone to comment what indicators they would like to add (with proper reference so I can actually add them) or to correct improper behavior in the indicator. This way I will be able to perfect the indicator and make it more useful to everyone.
If anyone reads the pine code and wonders why I compare to the average true range frequently the answer is quite simple, it's done to make the algorithm work in ANY symbol, so concepts like long bars or "visible" gaps can actually be coded.
If anyone needs to hide the 0.0000 values of the script it needs to go to the properties of the chart, then background and then uncheck indicator values.

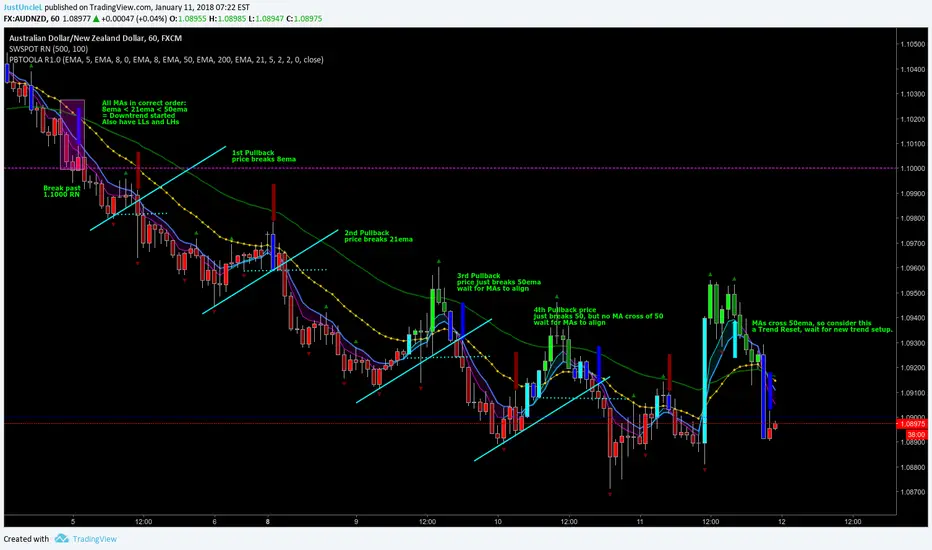
Pullback Trading Tool ALT R1.0 by JustUncleLThis study is an alternative Pullback Tool to my previous versions "Pullback Trading Tool R#.# by JustUncleL". This version aims to provide a cleaner but powerful trading tool. It incorporates the majority of the indicators needed to analyse trade Trends for Pullbacks and Reversals. You can optionally use Heikin Ashi candle or Renko charts. The notes here are mainly in reference to using standard Candlestick 60min signal chart (or Anchor chart time frame), other higher time frames can be used instead as Anchor Time Frames such as 240min(4hr) or 1440min(Daily).
NOTE: A Pullback is synomous to Retracement, generally a Pullback refers to a large Retracement of 100pips or more. In the context of this Tool and any comments related to it, a Pullback will be the same as a Retracement.
Incorporated within this tool are the following indicators:
1. Three Moving Averages (EMA by default) that can optionally be Anchored to a Higher Time Frame:
DodgerBlue = EMA08 (default)
Green = EMA50 (default)
Gray = EMA200 (default), disabled by default.
2. One Anchored Signal Moving Average line Yellow EMA21 (default).
3. Two Un-Anchored Moving Averages as Ribbon, can be disabled.
Aqua = EMA03 (default)
Fuchsia = EMA08 (default)
4. Display Pivots and optional Pivot Levels. By default Pivot is set to : 2 candles RHS of Pivot and 2 candles LHS of Pivot; this is the setting required to show standard Fractal points.
5. Optional HH, LH, LL, HL finder to help with drawing Trend lines and mini Trend Lines.
6. Coloured coded Bar based on the signal MA:
the Standard candle colours:
Blue = candle open and closed above signal MA.
Red = candle open and closed below signal MA.
Yellow = Candle stradle across signal MA.
the Grab candles scheme:
Lime = Bull candle open and closed above signal MA.
Green = Bear candle open and closed above signal MA.
Red = Bull candle open and closed below signal MA.
DarkRed = Bear candle open and closed below signal MA.
Aqua = Bull candle closed across signal MA.
Blue = Bear candle stradle across signal MA.
7. Alert entry arrows generated within a Trend or at the start of a new trend.
An Uptrend is defined as anchored fast (8ema) above anchored signal (21ema) above anchored medium (50ema).
A Downtrend is defined as anchored fast (8ema) below anchored signal (21ema) below anchored medium (50ema).
A Pullback generates an red (short entry) or green (long entry) arrow when price crosses anchored fast or signal MAs and then crosses back to return to trend direction.
A Trend Break, which is defined as any of the MAs crossing breaking trend, generates a blue (short) or aqua (long) arrow and then make new trend (in same or new trend direction).
Volatility Finite Volume Elements Strategy The FVE is a pure volume indicator. Unlike most of the other indicators
(except OBV), price change doesn?t come into the equation for the FVE
(price is not multiplied by volume), but is only used to determine whether
money is flowing in or out of the stock. This is contrary to the current trend
in the design of modern money flow indicators. The author decided against a
price-volume indicator for the following reasons:
- A pure volume indicator has more power to contradict.
- The number of buyers or sellers (which is assessed by volume) will be the same,
regardless of the price fluctuation.
- Price-volume indicators tend to spike excessively at breakouts or breakdowns.
This study is an addition to FVE indicator. Indicator plots different-coloured volume
bars depending on volatility.
You can change long to short in the Input Settings
Please, use it only for learning or paper trading. Do not
Volatility Finite Volume Elements Strategy The FVE is a pure volume indicator. Unlike most of the other indicators
(except OBV), price change doesn?t come into the equation for the FVE
(price is not multiplied by volume), but is only used to determine whether
money is flowing in or out of the stock. This is contrary to the current trend
in the design of modern money flow indicators. The author decided against a
price-volume indicator for the following reasons:
- A pure volume indicator has more power to contradict.
- The number of buyers or sellers (which is assessed by volume) will be the same,
regardless of the price fluctuation.
- Price-volume indicators tend to spike excessively at breakouts or breakdowns.
This study is an addition to FVE indicator. Indicator plots different-coloured volume
bars depending on volatility.
Scalping Swing Trading Tool R1-4 by JustUncleLDescription:
This study project is a "Scalping Swing trading Tool" and is an alternative to the "Scalping Pullback Tool R1". It is designed for a two pane TradingView chart layout :
the first pane set to 15min Time Frame;
the second pane set to 1min Time Frame(TF).
The tools incorporates the majority of the indicators needed to analyse and scalp Trends for Swings, PullBacks and reversals on 15min charts and 1min charts.
Incorporated within this tool are the following indicators:
1. The following EMAs are drawn automatically:
Green = EMA89 (15min TF) = EMA75 (1min TF)
Blue = EMA200 (15min TF) = EMA180 (1min TF)
Black = EMA633 (15min TF) = EMA540 (1min TF)
2. The 10EMA (default) High/Low+Close Price Action Channel (PAC), the PAC channel
display is disabled by default.
3. Optionally display Fractals and optional Fractal levels
4. Optional HH, LH, LL, HL finder.
5. Coloured coded Bar high lighting based on the PAC:
blue = bar closed above PAC
red = bar closed below PAC
gray = bar closed inside PAC
lime Line = EMA10 of bar close
6. Pivot points (disables Fractals automatically when selected) with optional labels.
7. EMA5-12 Channel is displayed by default.
8. EMA12-36 Ribbon is displayed by default
9. Optionally display EMA36 and PAC instead of EMA12-36 Ribbon.
Set up and hints:
I am unable to provide a full description here, as Pullback Trading incorporates a full trading Methodology, there are a number of articles and books written on the subject.
Set to two pane TradingView chart, set first pane to 15Min and second to 1min.
Set the chart to Heikin Ashi Candles (optional).
I also add a "Sweetspot Gold2" indicator to the chart as well to help with support and resistance finding and shows where the important "00" lines are.
Use the EMA200 on the 15min pane as the anchor. So when prices above EMA200 we only trade long (buy) and when prices below the EMA200 we only trade short (sell).
On the 15min chart draw any obvious Vertical Trend Lines (VTL), use Pivots point as a guide.
On the 15min chart what we’re looking for price to Pullback into the EMA5-12 Channel or EMA12-36 ribbon, we draw Trendlines uitilising the Pivot points or Fractals to guide your TL drawing.
On the 15min chart look for the trend to resume and break through the drawn TL. The bar color needs to change back to the trend direction colour to confirm as a break.
Now this break can be traded as a 15min trade or now look to the 1min chart.
On the 1min chart draw any Pullback into any of the EMAs.
On the 1min chart look for the trend to resume and break through the drawn TL. The bar color needs to change back to the trend direction colour to confirm as a break.
Now this break can be traded as a 1min trade.
There is also an option to select Pristine (ie Ideal) filtered Fractals, which look like tents or V shape 5-candle patterns. These are actually used to calculate the Pivot points as well.
Other than the "SweetSpot Gold2" indicator, you should not need any other indicator to successfully trade trends for Pullbacks and reversals. If you really want another indicator use the AO (Awesome Oscillator) as it is momentum based.

Madrid Bull/Bear TerritoryThis study displays a background in four colors, lime, green, red, maroon, lime = Bull Territory, red = Bear Territory, green = possible reversal to Bear Territory, maroon = possible reversal to Bull Territory.
Trading with the basic rule, go long on a Bull Market and short a Bear Market.
This study can be used inside the main window, or by unmerging/merging it can be used as a standalone or in combination with other indicators.
The parameters defined by default reduce choppiness and false signals, but just like any other indicator, there is a trade off between fast response and choppiness. The smaller the parameters the faster response, but the more choppiness.
This indicator is built using three EMA's, two (the bigger ones) are used to define the trend direction, and the fastest one is used as a signal, when the signal breaks out the trend indicators to the downside we're in Bear Market, when the signal breaks out to the upside, we're in Bull Market, any thing in between is either a trend reversal or trend continuation.
Momentum indicators and price pattern analysis are recommended to determine the direction of the trend.

FVE Volatility color-coded Volume bar The FVE is a pure volume indicator. Unlike most of the other indicators
(except OBV), price change doesn?t come into the equation for the FVE
(price is not multiplied by volume), but is only used to determine whether
money is flowing in or out of the stock. This is contrary to the current trend
in the design of modern money flow indicators. The author decided against a
price-volume indicator for the following reasons:
- A pure volume indicator has more power to contradict.
- The number of buyers or sellers (which is assessed by volume) will be the same,
regardless of the price fluctuation.
- Price-volume indicators tend to spike excessively at breakouts or breakdowns.
This study is an addition to FVE indicator. Indicator plots different-coloured volume
bars depending on volatility.

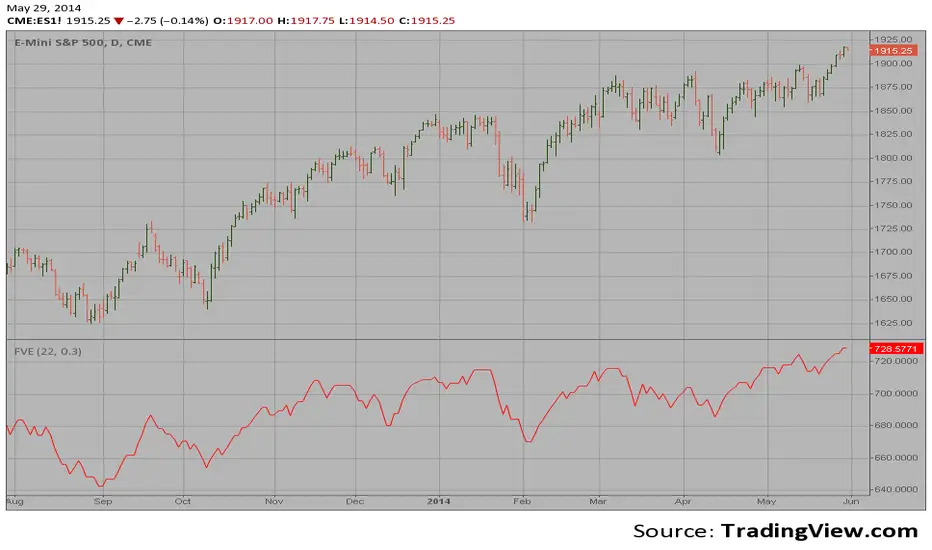
Finite Volume Elements (FVE) The FVE is a pure volume indicator. Unlike most of the other indicators
(except OBV), price change doesn`t come into the equation for the FVE (price
is not multiplied by volume), but is only used to determine whether money is
flowing in or out of the stock. This is contrary to the current trend in the
design of modern money flow indicators. The author decided against a price-volume
indicator for the following reasons:
- A pure volume indicator has more power to contradict.
- The number of buyers or sellers (which is assessed by volume) will be the same,
regardless of the price fluctuation.
- Price-volume indicators tend to spike excessively at breakouts or breakdowns.
Instant Breakout Strategy with RSI & VWAPInstant Breakout Strategy with RSI & VWAP
This TradingView strategy (Pine Script v6) trades breakouts using pivot points, with optional filters for volume, momentum, RSI, and VWAP. It’s optimized for the 1-second timeframe.
Overview
The strategy identifies breakouts when price crosses above resistance (pivot highs) or below support (pivot lows). It can use basic pivot breakouts or add filters for stronger signals. Take-profit and stop-loss levels are set using ATR, and signals are shown on the chart.
Inputs
Left/Right Pivot Bars: Bars to detect pivots (default: 3). Lower values increase sensitivity.
Volume Surge Multiplier: Volume threshold vs. 20-period average (default: 1.5).
Momentum Threshold: Minimum % price change from bar open (default: 1%).
Take-Profit ATR Multiplier: ATR multiplier for take-profit (default: 9.0).
Stop-Loss ATR Multiplier: ATR multiplier for stop-loss (default: 1.0).
Use Filters: Enable/disable volume, momentum, RSI, and VWAP filters (default: off).
How It Works
1. Pivot Detection
Finds pivot highs (resistance) and lows (support) using ta.pivothigh and ta.pivotlow.
Tracks the latest pivot levels.
2. Volume Surge
Compares current volume to a 20-period volume average.
A surge occurs if volume exceeds the average times the multiplier.
3. Momentum
Measures price change from the bar’s open.
Bullish: Price rises >1% from open.
Bearish: Price falls >1% from open.
4. RSI and VWAP
RSI: 3-period RSI. Above 50 is bullish; below 50 is bearish.
VWAP: Price above VWAP is bullish; below is bearish.
5. ATR
14-period ATR sets take-profit (close ± atr * 9.0) and stop-loss (close ± atr * 1.0).
Trading Rules
Breakout Conditions
Bullish Breakout:
Price crosses above the latest pivot high.
With filters: Volume surge, bullish momentum, RSI > 50, price > VWAP.
Without filters: Only the crossover is needed.
Bearish Breakout:
Price crosses below the latest pivot low.
With filters: Volume surge, bearish momentum, RSI < 50, price < VWAP.
Without filters: Only the crossunder is needed.
Entries and Exits
Long: Enter on bullish breakout. Set take-profit and stop-loss. Close any short position.
Short: Enter on bearish breakout. Set take-profit and stop-loss. Close any long position.
Visuals
Signals: Green triangles (bullish) below bars, red triangles (bearish) above bars.
Pivot Levels: Green line (resistance), red line (support).
Indicators: RSI (blue, separate pane), VWAP (purple, on chart).
How to Use
Apply to a 1-second chart in TradingView for best results.
Adjust inputs (e.g., pivot bars, multipliers). Enable filters for stricter signals.
Watch for buy/sell triangles and monitor RSI/VWAP.
Use ATR-based take-profit/stop-loss for risk management.
Notes
Best on 1-second timeframe due to fast RSI and responsiveness.
Disable filters for more signals (less confirmation).
Backtest before live trading to check performance.
This strategy uses pivots, volume, momentum, RSI, and VWAP for clear breakout trades on the 1-second timeframe.

T-Virus Sentiment [hapharmonic]🧬 T-Virus Sentiment: Visualize the Market's DNA
Remember the iconic T-Virus vial from the first Resident Evil? That powerful, swirling helix of potential has always fascinated me. It sparked an idea: what if we could visualize the market's underlying health in a similar way? What if we could capture the "genetic code" of market sentiment and contain it within a dynamic, 3D indicator? This project is the result of that idea, brought to life with Pine Script.
The indicator's main goal is to measure the strength and direction of market sentiment by analyzing the "genetic code" of price action through a variety of trusted indicators. The result is displayed as a liquid level within a DNA helix, a bubble density representing buying pressure, and a T-Virus mascot that reflects the overall mood.
🧐 Core Concept: How It Works
The primary output of the indicator is the "Active %" gauge you see on the right side of the vial. This percentage represents the overall sentiment score, calculated as an average from 7 different technical analysis tools. Each tool is analyzed on every bar and assigned a score from 1 (strong bearish pressure) to 5 (strong bullish potential).
In this indicator, we re-imagine market dynamics through the lens of a viral outbreak. A strong bear market is like a virus taking hold, pulling all technical signals down into a state of weakness. Conversely, a powerful bull market is like an antiviral serum ; positive signals rise and spread toward the top of the vial, indicating that the system is being injected with strength.
This is not just another line on a chart. It's a comprehensive sentiment dashboard designed to give an immediate, at-a-glance understanding of the confluence between 7 classic technical indicators. The incredible 3D model of the vial itself was inspired by a design concept found here .
⚛️ The 4 Core Elements of T-Virus Sentiment
These four elements work in harmony to give a complete, multi-faceted picture of market sentiment. Each component tells a different part of the story.
The Virus Mascot: An instant emotional cue. This character provides the quickest possible read on the overall market mood, combining sentiment with volume pressure.
The Antiviral Serum Level: The main quantitative output. This is the liquid level in the DNA helix and the percentage gauge on the right, representing the average sentiment score from all 7 indicators.
Buy Pressure & Bubble Density: This visualizes volume flow. The density of bubbles represents the intensity of accumulation (buying) versus distribution (selling). It's the "power" behind the move.
The Signal Distribution: This shows the confluence (or dispersion) of sentiment. Are all signals bullish and clustered at the top, or are they scattered, indicating a conflicted market? The position of the indicator labels is crucial, as each is assigned to one of five distinct zones:
Base Bottom: The market is at its weakest. Signals here suggest strong bearish control and distribution.
Lower Zone: The market is still bearish, but signals may be showing early signs of accumulation or bottoming.
Neutral Core (Center): A state of balance or sideways consolidation. The market is waiting for a new direction.
Upper Zone: Bullish momentum is becoming clear. Signals are strengthening and showing bullish control.
Top Cap: The market is "heating up" with strong bullish sentiment, potentially nearing overbought conditions.
🐂🐻 The Virus Mascot: The At-a-Glance Indicator
This character acts as a shortcut to confirm market health. It combines the sentiment score with volume, preventing false confidence in a low-volume rally.
Its state is determined by a dual-check: the overall "Antiviral Serum Level" and the "Buy Pressure" must both be above 50%.
Green & Smiling: The 'all clear' signal. This means that not only is the overall technical sentiment bullish, but it's also being supported by real buying pressure. This is a sign of a healthy bull market.
Red & Angry: A warning sign. This appears if either the sentiment is weak, or a bullish sentiment is not being confirmed by buying volume. The latter could indicate a potential "bull trap" or an exhaustive move.
This mascot can be disabled from the settings page under "Virus Mascot Styling" if a cleaner look is preferred.
🫧 Bubble Density: Gauging Buy vs. Sell Pressure
The bubbles visualize the battle between buyers and sellers. There are two modes to control how this is calculated:
Mode 1: Visible Range (The 'Big Picture' View)
This default mode is best for getting a broad, contextual understanding of the current session. It dynamically analyzes the volume of every single candlestick currently visible on the screen to calculate the buy/sell pressure ratio. It answers the question: "Over the entire period I'm looking at, who is in control?" As you zoom in or out, the calculation adapts.
Mode 2: Custom Lookback (The 'Precision' View)
This mode is for traders who need to analyze short-term pressure. You can define a fixed number of recent bars to analyze, which is perfect for scalping or understanding the volume dynamics leading into a key level. It answers the question: "What is happening right now ?" In the example above, a lookback of 2 focuses only on the most recent action, clearly showing intense, immediate selling pressure (few bubbles) and a corresponding drop in the sentiment score to 29%.
ℹ️ Interactive Tooltips: Dive Deeper
We believe in transparency, not 'black box' indicators. This feature transforms the indicator from a visual aid into an active learning tool.
Simply hover the mouse over any indicator label (like EMA, OBV, etc.) to get a detailed tooltip. It will explain the specific data points and thresholds that signal met to be placed in its current zone. This helps build trust in the signals and allows users to fine-tune the indicator settings to better match their own trading style.
🎯 The Scoring Logic Breakdown
The "Antiviral Serum Level" gauge is the average score from 7 technical analysis tools. Each is graded on a 5-point scale (1=Strong Bearish to 5=Strong Bullish). Here’s a detailed, transparent look at how each "gene" is evaluated:
Relative Strength Index (RSI)
Measures momentum and overbought/oversold conditions.
Group 1 (Strong Bearish): RSI > 80 (Extreme Overbought)
Group 2 (Bearish): 70 < RSI ≤ 80 (Overbought)
Group 3 (Neutral): 30 ≤ RSI ≤ 70
Group 4 (Bullish): 20 ≤ RSI < 30 (Oversold)
Group 5 (Strong Bullish): RSI < 20 (Extreme Oversold)
Exponential Moving Averages (EMA)
Evaluates the trend's strength and structure based on the alignment of multiple EMAs (9, 21, 50, 100, 200, 250).
Group 1 (Strong Bearish): A perfect bearish sequence (9 < 21 < 50 < ...)
Group 2 (Bearish Transition): Early signs of a potential reversal (e.g., 9 > 21 but still below 50)
Group 3 (Neutral / Mixed): MAs are intertwined or showing a partial bullish sequence.
Group 4 (Bullish): A strong bullish sequence is forming (e.g., 9 > 21 > 50 > 100)
Group 5 (Strong Bullish): A perfect bullish sequence (9 > 21 > 50 > 100 > 200 > 250)
Moving Average Convergence Divergence (MACD)
Analyzes the relationship between two moving averages to gauge momentum.
Group 1 (Strong Bearish): MACD & Histogram are negative and momentum is falling.
Group 2 (Weakening Bearish): MACD is negative but the histogram is rising or positive.
Group 3 (Neutral / Crossover): A crossover event is occurring near the zero line.
Group 4 (Bullish): MACD & Histogram are positive.
Group 5 (Strong Bullish): MACD & Histogram are positive, rising strongly, and accelerating.
Average Directional Index (ADX)
Measures trend strength, not direction. The score is based on both ADX value and the dominance of DI+ vs DI-.
Group 1 (Bearish / No Trend): ADX < 20 and DI- is dominant.
Group 2 (Developing Bearish Trend): 20 ≤ ADX < 25 and DI- is dominant.
Group 3 (Neutral / Indecision): Trend is weak or DI+ and DI- are nearly equal.
Group 4 (Developing Bullish Trend): 25 ≤ ADX ≤ 40 and DI+ is dominant.
Group 5 (Strong Bullish Trend): ADX > 40 and DI+ is dominant.
Ichimoku Cloud (IKH)
A comprehensive indicator that defines support/resistance, momentum, and trend direction.
Group 1 (Strong Bearish): Price is below the Kumo, Tenkan < Kijun, and Chikou is below price.
Group 2 (Bearish): Price is inside or below the Kumo, with mixed secondary signals.
Group 3 (Neutral / Ranging): Price is inside the Kumo, often with a Tenkan/Kijun cross.
Group 4 (Bullish): Price is above the Kumo with strong primary signals.
Group 5 (Strong Bullish): All signals are aligned bullishly: price above Kumo, bullish Tenkan/Kijun cross, bullish future Kumo, and Chikou above price.
Bollinger Bands (BB)
Measures volatility and relative price levels.
Group 1 (Strong Bearish): Price is below the lower band.
Group 2 (Bearish Territory): Price is between the lower band and the basis line.
Group 3 (Neutral): Price is hovering around the basis line.
Group 4 (Bullish Territory): Price is between the basis line and the upper band.
Group 5 (Strong Bullish): Price is above the upper band.
On-Balance Volume (OBV)
Uses volume flow to predict price changes. The score is based on OBV's trend and its position relative to its moving average.
Group 1 (Strong Bearish): OBV is below its MA and falling.
Group 2 (Weakening Bearish): OBV is below its MA but showing signs of rising.
Group 3 (Neutral): OBV is very close to its MA.
Group 4 (Bullish): OBV is above its MA and rising.
Group 5 (Strong Bullish): OBV is above its MA, rising strongly, and showing signs of a volume spike.
🧭 How to Use the T-Virus Sentiment Indicator
IMPORTANT: This indicator is a sentiment dashboard , not a direct buy/sell signal generator. Its strength lies in showing confluence and providing a quick, holistic view of the market's technical health.
Confirmation Tool: Use the "Active %" gauge to confirm a trade setup from your primary strategy. For example, if you see a bullish chart pattern, a high and rising sentiment score can add confidence to your trade.
Momentum & Trend Gauge: A consistently high score (e.g., > 75%) suggests strong, established bullish momentum. A consistently low score (< 25%) suggests strong bearish control. A score hovering around 50% often indicates a ranging or indecisive market.
Divergence & Warning System: Pay attention to divergences. If the price is making new highs but the sentiment score is failing to follow or is actively decreasing, it could be an early warning sign that the underlying momentum is weakening.
⚙️ Settings & Customization
The indicator is highly customizable to fit any trading style.
Position & Anchor: Control where the vial appears on the chart.
Styling (Vial, Helix, etc.): Nearly every visual element can be color-customized.
Signals: This is where the real power is. All underlying indicator parameters (RSI length, MACD settings, etc.) can be fine-tuned to match a personal strategy. The text labels can also be disabled if the chart feels cluttered.
Enjoy visualizing the market's DNA with the T-Virus Sentiment indicator

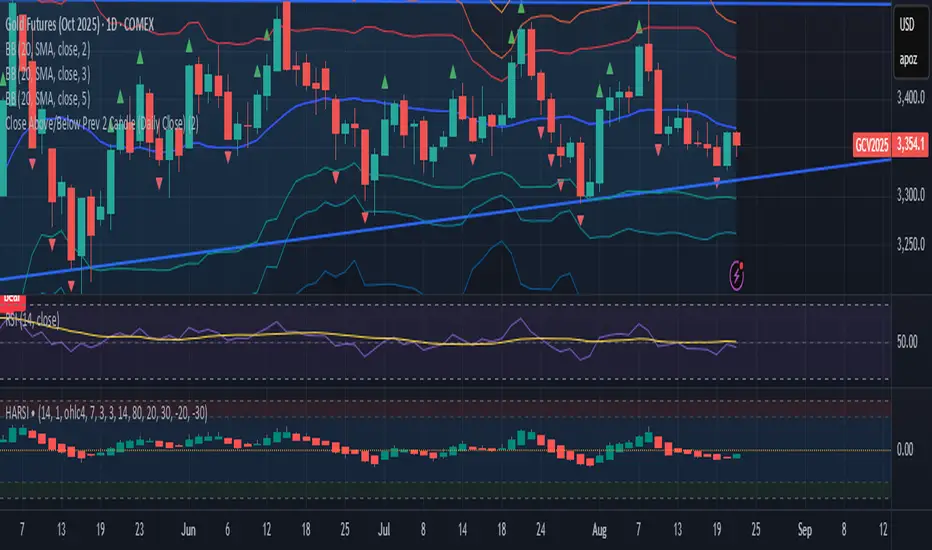
Close Above/Below Prev 2 Candle (Daily Close)This strategy identifies potential trend continuation or breakout signals by analyzing the daily candle closes relative to the previous two daily candles. It generates clear alerts and trade signals only after the daily candle has fully closed, reducing false intraday triggers.
How it works:
Long Entry (Bullish Signal): Triggered when the daily candle closes above the highs of the previous two daily candles.
Short Entry (Bearish Signal): Triggered when the daily candle closes below the lows of the previous two daily candles.
Visual Indicators: Green triangles indicate bullish signals, red triangles indicate bearish signals.
Strategy Features:
Optional long and short entries with configurable risk/reward ratio.
Automatic stop-loss and take-profit calculation based on candle structure.
Works on intraday charts using daily candle analysis.
Alerts:
Alerts trigger only after the daily candle closes above/below the previous two daily candles.
Helps traders receive precise notifications for potential breakout trades.
Benefits:
Reduces noise by using daily candle closes.
Easy to integrate with other swing or trend strategies.
Provides clear visual and alert signals for both bullish and bearish setups.
Amiya's Crude Oil Alligator RSI StrategyCrude Oil Futures with the following conditions:
15 minutes candle.
Indicators: William Alligator and RSI- both default setting.
Buy signal to be generated when following conditions are met:
1. Candle closes above Lips.
2. Lips is above teeth
3. Teeth is above jaws
4. RSI is above 55.
Stop loss when either of the following conditions are met:
1. RSI is below 50 or
2. Candle close crosses below Teeth or
3. Lips is lower than teeth.
Take Profit Signal to be generated when the current price is 25 rupees above the entry price.
Sell signal to be generated when following conditions are met:
1. Candle closes below lips.
5. Lips is below teeth
6. Teeth is below jaws
7. RSI is below 45.
Stop loss when either of the following conditions are met:
2. RSI is above 50 or
3. Candle close crosses above Teeth or
4. Lips is higher than teeth.
Take Profit Signal to be generated when the current price is 25 rupees lower than the entry price.
In cases of Buy Signal, Sell Signal, Stop Loss and Take Profit, alerts should be generated and also, alerts should be shown on the chart, mentioning Buy Signal, Sell Signal, Stop Loss and Take Profit.

Amiya's NaturalGas Futures StrategyNaturalGas Futures- current month, 15 minutes candle, Indicators: William Alligator and RSI- both default setting. Buy signal to be generated when Candle closes above Lips and Lips is above teeth and teeth is above jaws and RSI is above 55. Stop loss when RSI is below 50 or candle close crosses below Teeth or lips is lower than teeth. Sell Signal to be generated when candle closes below lips and lips is below teeth and teeth is below Jaws and RSI is below 45. Stop loss when candle closes above teeth or RSI is above 50. For Buy and Sell signal, Alert should be generated.

EAOBS by MIGVersion 1
1. Strategy Overview Objective: Capitalize on breakout movements in Ethereum (ETH) price after the Asian open pre-market session (7:00 PM–7:59 PM EST) by identifying high and low prices during the session and trading breakouts above the high or below the low.
Timeframe: Any (script is timeframe-agnostic, but align with session timing).
Session: Pre-market session (7:00 PM–7:59 PM EST, adjustable for other time zones, e.g., 12:00 AM–12:59 AM GMT).
Risk-Reward Ratios (R:R): Targets range from 1.2:1 to 5.2:1, with a fixed stop loss.
Instrument: Ethereum (ETH/USD or ETH-based pairs).
2. Market Setup Session Monitoring: Monitor ETH price action during the pre-market session (7:00 PM–7:59 PM EST), which aligns with the Asian market open (e.g., 9:00 AM–9:59 AM JST).
The script tracks the highest high and lowest low during this session.
Breakout Triggers: Buy Signal: Price breaks above the session’s high after the session ends (7:59 PM EST).
Sell Signal: Price breaks below the session’s low after the session ends.
Visualization: The session is highlighted on the chart with a white background.
Horizontal lines are drawn at the session’s high and low, extended for 30 bars, along with take-profit (TP) and stop-loss (SL) levels.
3. Entry Rules Long (Buy) Entry: Enter a long position when the price breaks above the session’s high price after 7:59 PM EST.
Entry price: Just above the session high (e.g., add a small buffer, like 0.1–0.5%, to avoid false breakouts, depending on volatility).
Short (Sell) Entry: Enter a short position when the price breaks below the session’s low price after 7:59 PM EST.
Entry price: Just below the session low (e.g., subtract a small buffer, like 0.1–0.5%).
Confirmation: Use a candlestick close above/below the breakout level to confirm the entry.
Optionally, add volume confirmation or a momentum indicator (e.g., RSI or MACD) to filter out weak breakouts.
Position Size: Calculate position size based on risk tolerance (e.g., 1–2% of account per trade).
Risk is determined by the stop-loss distance (10 points, as defined in the script).
4. Exit Rules Take-Profit Levels (in points, based on script inputs):TP1: 12 points (1.2:1 R:R).
TP2: 22 points (2.2:1 R:R).
TP3: 32 points (3.2:1 R:R).
TP4: 42 points (4.2:1 R:R).
TP5: 52 points (5.2:1 R:R).
Example for Long: If session high is 3000, TP levels are 3012, 3022, 3032, 3042, 3052.
Example for Short: If session low is 2950, TP levels are 2938, 2928, 2918, 2908, 2898.
Strategy: Scale out of the position (e.g., close 20% at TP1, 20% at TP2, etc.) or take full profit at a preferred TP level based on market conditions.
Stop-Loss: Fixed at 10 points from the entry.
Long SL: Session high - 10 points (e.g., entry at 3000, SL at 2990).
Short SL: Session low + 10 points (e.g., entry at 2950, SL at 2960).
Trailing Stop (Optional):After reaching TP2 or TP3, consider trailing the stop to lock in profits (e.g., trail by 10–15 points below the current price).
5. Risk Management per Trade: Limit risk to 1–2% of your trading account per trade.
Calculate position size: Account Size × Risk % ÷ (Stop-Loss Distance × ETH Price per Point).
Example: $10,000 account, 1% risk = $100. If SL = 10 points and 1 point = $1, position size = $100 ÷ 10 = 0.1 ETH.
Daily Risk Limit: Cap daily losses at 3–5% of the account to avoid overtrading.
Maximum Exposure: Avoid taking both long and short positions simultaneously unless using separate accounts or strategies.
Volatility Consideration: Adjust position size during high-volatility periods (e.g., major news events like Ethereum upgrades or macroeconomic announcements).
6. Trade Management Monitoring :Watch for breakouts after 7:59 PM EST.
Monitor price action near TP and SL levels using alerts or manual checks.
Trade Duration: Breakout lines extend for 30 bars (script parameter). Close trades if no TP or SL is hit within this period, or reassess based on market conditions.
Adjustments: If the market shows strong momentum, consider holding beyond TP5 with a trailing stop.
If the breakout fails (e.g., price reverses before TP1), exit early to minimize losses.
7. Additional Considerations Market Conditions: The 7:00 PM–7:59 PM EST session aligns with the Asian market open (e.g., Tokyo Stock Exchange open at 9:00 AM JST), which may introduce higher volatility due to Asian trading activity.
Avoid trading during low-liquidity periods or extreme volatility (e.g., major crypto news).
Check for upcoming events (e.g., Ethereum network upgrades, ETF decisions) that could impact price.
Backtesting: Test the strategy on historical ETH data using the session high/low breakouts for the 7:00 PM–7:59 PM EST window to validate performance.
Adjust TP/SL levels based on backtest results if needed.
Broker and Fees: Use a low-fee crypto exchange (e.g., Binance, Kraken, Coinbase Pro) to maximize R:R.
Account for trading fees and slippage in your position sizing.
Time zone Adjustment: Adjust session time input for your time zone (e.g., "0000-0059" for GMT).
Ensure your trading platform’s clock aligns with the script’s time zone (default: America/New_York).
8. Example Trade Scenario: Session (7:00 PM–7:59 PM EST) records a high of 3050 and a low of 3000.
Long Trade: Entry: Price breaks above 3050 (e.g., enter at 3051).
TP Levels: 3063 (TP1), 3073 (TP2), 3083 (TP3), 3093 (TP4), 3103 (TP5).
SL: 3040 (3050 - 10).
Position Size: For a $10,000 account, 1% risk = $100. SL = 11 points ($11). Size = $100 ÷ 11 = ~0.09 ETH.
Short Trade: Entry: Price breaks below 3000 (e.g., enter at 2999).
TP Levels: 2987 (TP1), 2977 (TP2), 2967 (TP3), 2957 (TP4), 2947 (TP5).
SL: 3010 (3000 + 10).
Position Size: Same as above, ~0.09 ETH.
Execution: Set alerts for breakouts, enter with limit orders, and monitor TPs/SL.
9. Tools and Setup Platform: Use TradingView to implement the Pine Script and visualize breakout levels.
Alerts: Set price alerts for breakouts above the session high or below the session low after 7:59 PM EST.
Set alerts for TP and SL levels.
Chart Settings: Use a 1-minute or 5-minute chart for precise session tracking.
Overlay the script to see high/low lines, TP levels, and SL levels.
Optional Indicators: Add RSI (e.g., avoid overbought/oversold breakouts) or volume to confirm breakouts.
10. Risk Warnings Crypto Volatility: ETH is highly volatile; unexpected news can cause rapid price swings.
False Breakouts: Breakouts may fail, especially in low-volume sessions. Use confirmation signals.
Leverage: Avoid high leverage (e.g., >5x) to prevent liquidation during volatile moves.
Session Accuracy: Ensure correct session timing for your time zone to avoid misaligned entries.
11. Performance Tracking Journaling :Record each trade’s entry, exit, R:R, and outcome.
Note market conditions (e.g., trending, ranging, news-driven).
Review: Weekly: Assess win rate, average R:R, and adherence to the plan.
Monthly: Adjust TP/SL or session timing based on performance.

Parabolic Stoch SAR VisualizerParabolic Stoch SAR Visualizer — Momentum-Driven Trend Precision Tool
Overview:
Parabolic Stoch SAR Visualizer is a thoughtfully engineered hybrid indicator that blends momentum oscillation and trend-following mechanics into one robust system. By applying a custom Parabolic SAR calculation directly on a double-smoothed stochastic oscillator (rather than on price), it generates cleaner signals with enhanced trend detection and fewer false positives than typical Parabolic RSI or standard SAR variants.
Unique Functionality:
Momentum smoothing : The base stochastic %K undergoes double smoothing via consecutive simple moving averages, significantly cutting down random noise and erratic swings common in raw stochastic readings. This stabilizes momentum tracking, isolating true price strength and weakness.
Custom Parabolic SAR on smoothed momentum : Traditional SAR algorithms operate on price data, acting as trailing stops. This indicator repurposes SAR to work on smoothed stochastic values, effectively converting it into a momentum-driven directional filter. This yields a more adaptive and responsive trend signal focused on genuine momentum shifts instead of price noise.
Bounded SAR range and adjustable acceleration : SAR values are mathematically restricted between 0 and 100, aligning with the stochastic scale to prevent distortions. Traders can customize acceleration parameters (start, increment, max) to fine-tune trend sensitivity relative to market volatility or specific strategies.
Signal clarity through filterin g: Minimum bar spacing and minimum SAR movement thresholds between plotted dots reduce chart clutter, highlighting only meaningful trend changes and filtering out insignificant fluctuations.
Enhanced visuals : The oscillator line smoothly transitions its color gradient between defined uptrend and downtrend hues, intuitively signaling momentum strength. Parabolic SAR dots are offset from the oscillator line with multi-layered glow effects, making trend flips easy to spot at a glance.
Trading Application:
Trend identification : Momentum-based SAR dots offer precise marking of trend shifts, helping traders avoid false breakouts and premature trades.
Entry and exit timing : Combining the double-smoothed stochastic oscillator and SAR dots creates a reliable framework to confirm momentum shifts and optimal trade entries or exits.
Customizable for volatility regimes : Adjustable acceleration and filtering parameters allow scalpers to increase signal sensitivity, while swing traders can dial back noise for smoother trend recognition.
Visual clarity for fast decisions : Gradient color coding and glowing SAR dots facilitate immediate momentum assessment without complex analysis, empowering quicker, more confident trade actions.
Advantages over Parabolic RSI and similar indicators:
Parabolic RSI’s direct application of SAR on RSI often results in noisy, choppy signals prone to whipsaws. This indicator’s double-smoothed stochastic foundation delivers a cleaner, steadier signal.
Applying SAR to smoothed momentum rather than price transforms it into a directional filter that better captures true market strength with reduced lag.
Adaptive plotting thresholds and enhanced visuals minimize clutter and ambiguity, improving trader focus and execution speed.

☑️VMA Win % Dashboard for Different LengthsVMA Win % Dashboard for Different Lengths
Overview
This Pine Script indicator evaluates the performance of a Variable Moving Average (VMA) for lengths 13 to 17. It tracks the success rate of price hitting target levels during bullish or bearish trends and displays results in a table. It is part of a combination that includes two other indicators: ✅ VMA Avg ATR + Days to Targets Total Improved 🎯 and 📊 Visual MTF VMA Dashboard🔄️.
How It Works
1. Inputs:
- ATR Length: 14 periods (for volatility).
- VMA Lengths: 13, 14, 15, 16, 17.
2. VMA Calculation:
- Uses closing price.
- Measures price increases (pdm) and decreases (mdm).
- Smooths data to calculate a Directional Movement Index (DMI).
- Adjusts VMA based on momentum and volatility.
3. Trend Detection:
- Bullish: VMA rises (green).
- Bearish: VMA falls (red).
- Neutral: No direction (white).
- Confirms trends align with daily and 195-minute timeframes.
4. Performance Tracking:
- Trend Start: Records price, ATR, and time when a trend begins.
- Price Movement: Tracks highest (bullish) or lowest (bearish) price.
- Targets:
---- T1: Starting price ± historical average movement (ATR-based).
---- T2: Starting price ± 6x ATR.
- Statistics:
---- Counts hits (reached T1/T2) and misses (didn’t reach T1).
---- Calculates win percentages: % of trends hitting T1.
5. Dashboard:
- Table with columns: VMA Length, Win % Up, Win % Down.
- Shows win percentages for each length (e.g., 75.23%).
Use Cases
- Trend Trading: Confirms trend direction and success rate.
- Optimization: Finds the best VMA length.
- Risk Management: Sets ATR-based trade targets.
- Combination: Complements ✅ VMA Avg ATR + Days to Targets Total Improved 🎯 and 📊 Visual MTF VMA Dashboard🔄️ for a complete strategy.
Example
- VMA 15: 80% Win Up, 55% Win Down → Best for bullish trades.
- VMA 13: 75% Win Up, 60% Win Down → More balanced.
Limitations
- Based on historical data, not future predictions.
- Only analyzes trends aligned with higher timeframes.
- No VMA lines or signals plotted on the chart.
