CCT StochRSI [LazyBear]CCT StochRSI, proposed by Steve Karnish of Cedar Creek Trading, reconfigures classic StochRSI using custom parameters and smoothing.
There are 6 types supported.
Common formula:
(rsi - lowest(rsi, x)) / (highest(rsi, y) - lowest(rsi, z)) * 100
Smoothed formula:
ema(common formula result, len)
Settings (values for x/y/z/len in the above formulae):
Type 1: RSILength=21, x=8, y=13, z=13, len=N/A
Type 2: RSILength=21, x=21, y=21, z=21, len=N/A
Type 3: RSILength=14, x=14, y=14, z=14, len=N/A
Type 4: RSILength=21, x=13, y=8, z=13, len=8
Type 5: RSILength=5, x=5, y=5, z=5, len=3
Type 6: RSILength=13, x=13, y=13, z=13, len=3
Apart from these default types, this also supports user-specified custom type (select "0" for "Type" option).
All 6 types:
CCT StochRSI compared against normal StochRSI:
List of my public indicators: bit.ly
List of my app-store indicators: blog.tradingview.com
Cari dalam skrip untuk "indicators"

Range Identifier [LazyBear] ---- May 05 2015 -----
Added support for filtered ranges:
RID V3 : pastebin.com
RIDv3 has full backward compatibility (!?), meaning all my descriptions below still apply for V3.
-- In addition, I have added a NON-OVERLAY mode, which can be put in its own pane, that shows the number of bars in the current range.
-- in Overlay mode, you can switch on/off filtering ranges based on the bar count.
Sample chart:
---- April 30 2015 -----
Updated the source to show a connected Midline only when ConnectRanges option is enabled.
Updated src: pastebin.com
Sample chart:
---- Original Desc ----
This is a simple indicator that highlights the price ranges. Very helpful in determining a breakout.
There are many ways to incorporate this in to your strategy. One simple idea could be to buy if the price breaks above a range, when above the specified EMA, and to SELL when it breaks down from a range below the EMA.
All options are configurable. Alerts can be setup using the specified plot names.
By default it shows only the ranges, but can be configured to show the full "channel". Chart below shows connected ranges with highlights ON.
Range highlighting can be turned OFF. Chart below shows that:
Note for the pine coders:
As you probably noticed in the charts above, single range is showing 2 colors(red/green). Fill() doesn't accept a series for colors, so I worked around this using two fill() statements with a moving DUMMY line, to get this mixed color effect.
List of my public indicators: bit.ly
List of my app-store indicators: blog.tradingview.com

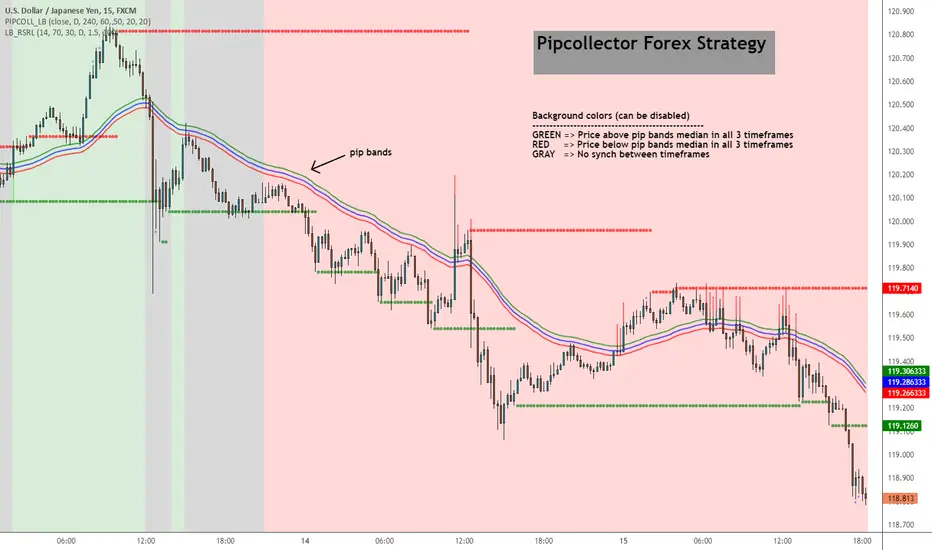
Pip collector [LazyBear]A simple but effective Forex strategy requested by user @pipcollector.
Suggested chart timeframe is 5mins.
Indicator marks potential long/short entries based on the following conditions:
LONG
------
Price above pip median ema on daily, 4 hour and 1 hour timeframe. These 3 timeframes and median EMA lengths are configurable.
Background color is set to GREEN (if option is enabled).
As soon as price touches or crosses the median ema, a GREEN arrow is shown to mark potential long.
SHORT
------
Price below pip median ema on daily, 4 hour and 1 hour timeframe. These 3 timeframes and median EMA lengths are configurable.
Background color is set to RED (if option is enabled).
As soon as price touches or crosses the median ema, a RED arrow is shown to mark potential short.
NO SETUP
-----------
Moving averages do not align on the 3 timeframes.
Background color is set to GRAY (if option is enabled)
I have noticed that this works well on other instruments too (anything trending), also on higher time frames. Feel free to leave any questions/comments on this below.
List of my public indicators: bit.ly
List of my app-store indicators: blog.tradingview.com
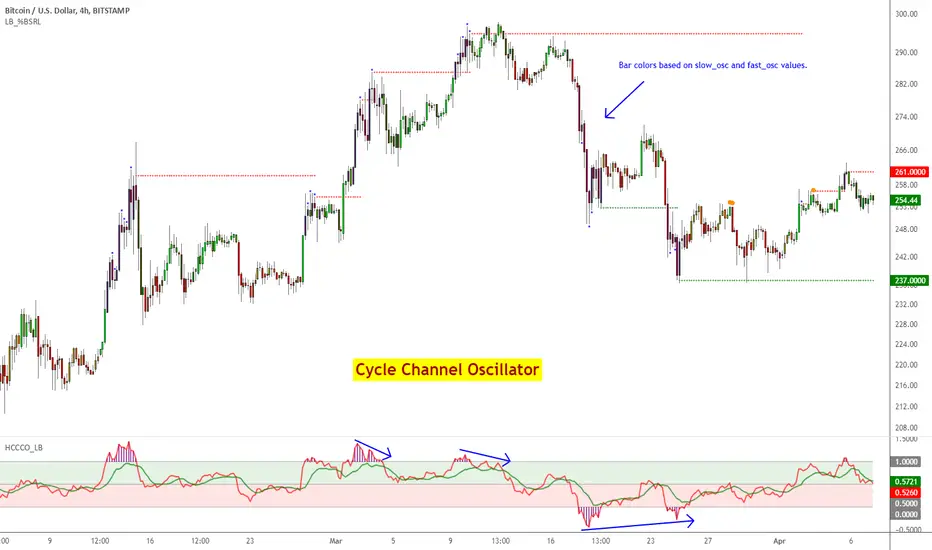
Cycle Channel Oscillator [LazyBear]Here's an oscillator derived from my previous script, Cycle Channel Clone ().
There are 2 oscillator plots - fast & slow. Fast plot shows the price location with in the medium term channel, while slow plot shows the location of short term midline of cycle channel with respect to medium term channel.
Usage of this is similar to %b oscillator. The slow plot can be considered as the signal line.
Bar colors can be enabled via options page. When short plot is above 1.0 or below 0, they are marked purple (both histo and the bar color) to highlight the extreme condition.
This makes use of the default 10/30 values of Cycle Channel, but may need tuning for your instrument.
More info:
List of my free indicators: bit.ly
List of my app-store indicators: blog.tradingview.com (More info: bit.ly)
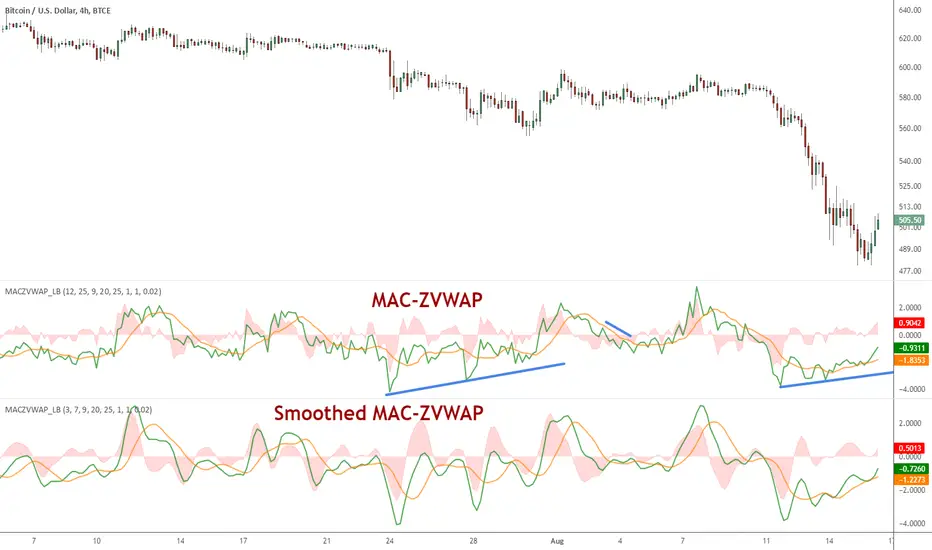
MAC-Z VWAP Indicator [LazyBear]This a modified MAC-Z using Z-VWAP. Since this uses VWAP, the signals are derived indirectly from both volume and price action.
I have also included a way to smooth MACZ-VWAP, you can enable it via options page.
Note that this will not work on any FX pair, as volume is not available.
Referenced indicators:
Z-distance from VWAP:
MAC-Z Indicator:
Z-Score:
Complete list of my indicators:
GDoc: docs.google.com
Chart:
buy/sell signals with Support/Resistance (InvestYourAsset) 📣The present indicator is a MACD based buy/sell signals indicator with support and resistance, that can be used to identify potential buy and sell signals in a security's price.
📣It is based on the MACD (Moving Average Convergence Divergence) indicator, which is a momentum indicator that shows the relationship between two moving averages of a security's price.
📣 The indicator also plots support and resistance levels, which can be used to confirm buy and sell signals. The support and resistance can also be used as a stoploss for existing position.
👉 To use the indicator, simply add it to your trading chart. The indicator will plot three sections:
📈 Price and Signals: This section plots the security's price and the MACD buy and sell signals.
📈 MACD Oscillator: This section plots the MACD oscillator, which is a histogram that shows the difference between the two moving averages.
📈 Moving Averages: This section plots the two moving averages that the MACD oscillator is based on.
📈 Support and Resistance: This section plots support and resistance levels, which are calculated based on the security's recent price action.
👉 To identify buy and sell signals, you can look for the following:
📈 Buy signal: When shorter Moving Average crosses over longer Moving Average.
📈 Sell signal: When shorter moving average crosses under longer moving average.
📈 You can also look for divergences between the MACD oscillator and the security's price. A divergence occurs when the MACD oscillator is moving in one direction, but the security's price is moving in the opposite direction. Divergences can be a sign of a potential trend reversal.
👉 To confirm buy and sell signals, you can look for support and resistance levels take a look at below snapshot. If a buy signal occurs at a support level, it is a stronger signal than if it occurs at a random price level. Similarly, if a sell signal occurs at a resistance level, it is a stronger signal than if it occurs at a random price level.
⚡ Here is a example of how to use the indicator to identify buy signal:
☑ Add the indicator to your trading chart.
☑Look for a buy signal when short MA crosses over Long MA.
☑Look for the buy signal to occur at a support level.
☑Enter a long position at the next candle.
☑Place a stop loss order below the support level.
☑Take profit when the MACD line crosses below the signal line, or when the security reaches a resistance level.
⚡ Here is an example of how to use the indicator to identify a sell signal:
☑Add the indicator to your trading chart.
☑Look for a sell signal, when shorter moving average crosses under longer moving average.
☑Look for the sell signal to occur at a resistance level.
☑Enter a short position at the next candle.
☑Place a stop loss order above the resistance level.
☑Take profit when the MACD line crosses above the signal line, or when the security reaches a support level.
✅Things to consider while using the indicator:
📈Look for buy signals in an uptrend and sell signals in a downtrend. This will increase the likelihood of your trades being successful.
📈Place your stop losses below the previous swing low or support for buy signals and above the previous swing high or resistance for sell signals. This will help to limit your losses if the trade goes against you.
📈Consider taking profits at key resistance and support levels. This will help you to lock in your profits and avoid giving them back to the market.
Follow us for timely updates regarding indicators that we may publish in future and give it a like if you appreciate the indicator.

Institutional Alpha Vector | D_QUANTInstitutional Alpha Vector | D_QUANT
Overview
The Institutional Alpha Vector (IAV) is an enterprise-grade composite trend ecosystem designed to identify high-probability institutional order flow. Unlike standard indicators that rely on a single data point, the IAV synthesizes Price Action, Momentum Physics, Volatility Regimes, and Volume Flow into a single, unified Alpha Vector.
This tool is not merely a signal generator, it is a market regime filter. It visualizes the consensus of four distinct quantitative models through a sophisticated "Electric Conduit" rendering engine, allowing traders to visualize the strength, direction, and volatility of the current trend instantly.
The Quantitative Engine
The IAV constructs its signal by calculating a weighted consensus across four distinct modules. These modules work in synergy to filter out noise and highlight sustained institutional moves.
MODULE 1 :: PRICE_FILTER : A highly responsive Hull Moving Average that serves as the "Spine" of the trend, reducing lag while maintaining smoothness.
MODULE 2 :: VOLATILITY_REGIME : A dynamic envelope that adjusts to market noise. This creates the "Conduit" width—expanding during high-volatility expansion and contracting during consolidation.
MODULE 3 :: MOMENTUM_PHYSICS : A directional movement filter that ensures signals are only generated when trend strength exceeds a specific threshold (default: 20).
MODULE 4 :: INSTITUTIONAL_FLOW : A volume-weighted money flow engine that confirms if price movement is supported by actual volume (Smart Money participation).
The Alpha Vector
The core of this system is the Alpha Vector calculation. The indicator normalizes the outputs of all active modules into a composite score between -1.0 (Strong Bearish Consensus) and +1.0 (Strong Bullish Consensus).
Bullish Entry: When the Alpha Vector crosses above the Long Threshold (Default: 0.1).
Bearish Entry: When the Alpha Vector crosses below the Short Threshold (Default: -0.1).
Neutral/Cash: When the consensus is weak or conflicting, the ribbon turns Grey/Flat, advising the trader to remain on the sidelines.
// ==========================================
// 3. SIGNAL AGGREGATION
// ==========================================
calc_composite_matrix() =>
_hma = calc_hma_series(hma_src, hma_len)
_hma_sig_v = 0
if ta.crossover(close, _hma)
_hma_sig_v := 1
else if ta.crossunder(close, _hma)
_hma_sig_v := -1
_adx_sig_v = calc_adx_state(adx_len, adx_thresh)
_cmf_sig_v = calc_cmf_state(cmf_len)
_rma_sig_v = calc_rma_filter_state(hma_src, lookback, atr_len)
var int s_hma = 0
var int s_adx = 0
var int s_cmf = 0
var int s_rma = 0
if _hma_sig_v != 0
s_hma := _hma_sig_v
if _adx_sig_v != 0
s_adx := _adx_sig_v
if _cmf_sig_v != 0
s_cmf := _cmf_sig_v
if _rma_sig_v != 0
s_rma := _rma_sig_v
= request.security(syminfo.ticker, "D", calc_composite_matrix(), lookahead=barmerge.lookahead_on)
float alpha_score_num = 0.0
int alpha_score_den = 0
if use_hma
alpha_score_num += d_hma
alpha_score_den += 1
if use_adx
alpha_score_num += d_adx
alpha_score_den += 1
if use_cmf
alpha_score_num += d_cmf
alpha_score_den += 1
if use_rma
alpha_score_num += d_rma
alpha_score_den += 1
alpha_vector = alpha_score_den > 0 ? alpha_score_num / alpha_score_den : 0.0
Visual Intelligence: The "Electric Conduit"
The visualization logic uses a Differential Gradient Model to represent market energy:
The Spine (Core): The solid, bright center line represents the immediate trend direction.
The Conduit (Fill): The gradient fill represents the Volatility Regime.
Thick/Wide Ribbon: High Volatility (Expansion Phase).
Thin/Tight Ribbon: Low Volatility (Contraction/Squeeze Phase).
Bar Coloring: Native bar coloring is integrated to instantly align price action with the Alpha Vector, removing the need for mental processing.
Settings
The indicator is fully customizable via a "Compute-Style" configuration menu:
MODULES: Toggle specific engines (HMA, ADX, CMF, RMA) on or off to adapt the Alpha Vector to your specific asset class (Crypto, Forex, or Indices).
THRESHOLDS: Adjust sensitivity for Long/Short entries.
VISUALS: Customize the "Core" and "Edge" colors to match your charting theme.
“Alpha is not about predicting the future. It is about aligning with the mathematical consensus of the present.” — D_QUANT

IU Indicators DashboardDESCRIPTION
The IU Indicators Dashboard is a comprehensive multi-stock monitoring tool that provides real-time technical analysis for up to 10 different stocks simultaneously. This powerful indicator creates a customizable table overlay that displays the trend status of multiple technical indicators across your selected stocks, giving you an instant overview of market conditions without switching between charts.
Perfect for portfolio monitoring, sector analysis, and quick market screening, this dashboard consolidates critical technical data into one easy-to-read interface with color-coded trend signals.
USER INPUTS
Stock Selection (10 Configurable Stocks):
- Stock 1-10: Customize any symbols (Default: NSE:CDSL, NSE:RELIANCE, NSE:VEDL, NSE:TCS, NSE:BEL, NSE:BHEL, NSE:TATAPOWER, NSE:TATASTEEL, NSE:ITC, NSE:LT)
Technical Indicator Parameters:
- EMA 1 Length: First Exponential Moving Average period (Default: 20)
- EMA 2 Length: Second Exponential Moving Average period (Default: 50)
- EMA 3 Length: Third Exponential Moving Average period (Default: 200)
- RSI Length: Relative Strength Index calculation period (Default: 14)
- SuperTrend Length: SuperTrend indicator period (Default: 10)
- SuperTrend Factor: SuperTrend multiplier factor (Default: 3.0)
Visual Customization:
- Table Size: Choose from Normal, Tiny, Small, or Large
- Table Background Color: Customize dashboard background
- Table Frame Color: Set frame border color
- Table Border Color: Configure border styling
- Text Color: Set text display color
- Bullish Color: Color for positive/bullish signals (Default: Green)
- Bearish Color: Color for negative/bearish signals (Default: Red)
LOGIC OF THE INDICATOR
The dashboard employs a multi-timeframe analysis approach using five key technical indicators:
1. Triple EMA Analysis
- Compares current price against three different EMA periods (20, 50, 200)
- Bullish Signal: Price above EMA level
- Bearish Signal: Price below EMA level
- Provides short-term, medium-term, and long-term trend perspective
2. RSI Momentum Analysis
- Uses 14-period RSI with 50-level threshold
- Bullish Signal: RSI > 50 (upward momentum)
- Bearish Signal: RSI < 50 (downward momentum)
- Identifies momentum strength and potential reversals
3. SuperTrend Direction
- Utilizes SuperTrend with configurable length and factor
- Bullish Signal: SuperTrend direction = -1 (uptrend)
- Bearish Signal: SuperTrend direction = 1 (downtrend)
- Provides clear trend direction with volatility-adjusted signals
4. MACD Histogram Analysis
- Uses standard MACD (12, 26, 9) histogram values
- Bullish Signal: Histogram > 0 (bullish momentum)
- Bearish Signal: Histogram < 0 (bearish momentum)
- Identifies momentum shifts and trend confirmations
5. Real-time Data Processing
- Implements request.security() for multi-symbol data retrieval
- Uses barstate.isrealtime logic for accurate live data
- Processes data only on the last bar for optimal performance
WHY IT IS UNIQUE
Multi-Stock Monitoring
- Monitor up to 10 different stocks simultaneously on a single chart
- No need to switch between multiple charts or timeframes
Highly Customizable Interface
- Full color customization for personalized visual experience
- Adjustable table size and positioning
- Clean, professional dashboard design
Real-time Analysis
- Live data processing with proper real-time handling
- Instant visual feedback through color-coded signals
- Optimized performance with smart data retrieval
Comprehensive Technical Coverage
- Combines trend-following, momentum, and volatility indicators
- Multiple timeframe perspective through different EMA periods
- Balanced approach using both lagging and leading indicators
Flexible Configuration
- Easy symbol switching for different markets (NSE, BSE, NYSE, NASDAQ)
- Adjustable indicator parameters for different trading styles
- Suitable for both swing trading and position trading
HOW USERS CAN BENEFIT FROM IT
Portfolio Management
- Quick Portfolio Health Check: Instantly assess the technical status of your entire stock portfolio
- Diversification Analysis: Monitor stocks across different sectors to ensure balanced exposure
- Risk Management: Identify which positions are showing bearish signals for potential exit strategies
- Rebalancing Decisions: Spot strongest performers for potential position increases
Market Screening and Analysis
- Sector Rotation: Compare different sector stocks to identify rotation opportunities
- Relative Strength Analysis: Quickly identify which stocks are outperforming or underperforming
- Market Breadth Assessment: Gauge overall market sentiment by monitoring diverse stock selections
- Trend Confirmation: Validate market trends by observing multiple stock behaviors
Time-Efficient Trading
- Single-Glance Analysis: Get complete technical overview without chart-hopping
- Pre-Market Preparation: Quickly assess overnight changes across multiple positions
- Intraday Monitoring: Track multiple opportunities simultaneously during trading hours
- End-of-Day Review: Efficiently review all watched stocks for next-day planning
Strategic Decision Making
- Entry Point Identification: Spot stocks showing bullish alignment across multiple indicators
- Exit Signal Recognition: Identify positions showing deteriorating technical conditions
- Swing Trading Opportunities: Find stocks with favorable technical setups for swing trades
- Long-term Investment Guidance: Use 200 EMA signals for long-term position decisions
Educational Benefits
- Pattern Recognition: Learn how different indicators behave across various market conditions
- Correlation Analysis: Understand how stocks move relative to each other
- Technical Analysis Learning: Observe multiple indicator interactions in real-time
- Market Sentiment Understanding: Develop better market timing skills through multi-stock observation
Workflow Optimization
- Reduced Chart Clutter: Keep your main chart clean while monitoring multiple stocks
- Faster Analysis: Complete technical analysis of 10 stocks in seconds instead of minutes
- Consistent Methodology: Apply the same technical criteria across all monitored stocks
- Alert Integration: Easy visual identification of stocks requiring immediate attention
This indicator is designed for traders and investors who want to maximize their market awareness while minimizing analysis time. Whether you're managing a portfolio, screening for opportunities, or learning technical analysis, the IU Indicators Dashboard provides the comprehensive overview you need for better trading decisions.
DISCLAIMER :
This indicator is not financial advice, it's for educational purposes only highlighting the power of coding( pine script) in TradingView, I am not a SEBI-registered advisor. Trading and investing involve risk, and you should consult with a qualified financial advisor before making any trading decisions. I do not guarantee profits or take responsibility for any losses you may incur.

Correlated Movement Indicator V2Hello!
This script was briefly known as as Bing Chilling. I converted this to Pine Script V5 to ensure compliance with publishing requirements.
This script tracks RSI and inserts an indicator when correlated movement is detected. Proximity of current tick to indicator origin tick determines freshness of the indicator.
DO NOT sit on the indicator for a long time. This is not a magic solution. It is very accurate but, not always precise. Ensure that you use other factors to determine the relevance of the indicator on current tick. This script can technically be used on any security/commodity/currency. Your Mileage May Vary! Proceed with caution as always.
General Workflow:
Look at proximity to where the flag is placed, general volatility, and other indicators and you can potentially determine the direction/strength. Not always the duration. The indicator could be for 30s, 1hr, 1 day, or whatever the market feels like. It depends on precision/quantity of pricing data. ex. 30min tick rate pricing vs. 1 day tick rate pricing will change the scope.
So if the time scope shows all sell from 1 week -> 3 months except for a couple recent buy indicators on the day, then it may be a bad call long term but, might be good for a short term play. Very volatile. Careful.
If it was all green with long term indicators such as 1 month -> 1 year, then it looks more like a buy and forget type strategy.
If it's all green with a recent red then you can try and figure out what the relative the bottom is so you can buy for long term at a slightly more favorable price.
Flip all that for shorting. I highly recommend AGAINST shorting since the stakes are very different and usually involves taking out what is essentially a loan to bet against the market.
This script pairs nicely with the top pick indicator when you search "Heiken Ashi". I use that to determine peaks and pits to better guess a good time to open a position.
This should be used alongside other indicators. Good for short term day trading and long term hold and forget. (Don't actually forget. Set some alerts periodically.)
Please use caution. Please do not take what I've said here as fact and diamond pepe hands bet all on green to the moon. This, like all the other strategies and indicators on this site, are used as tools to inform you about potential and to categorize/depict data in a more human recognizable way. If you have access to a paper account try there first.
Happy trading!
- Zetsu

Multiple Indicators ScreenerA screener for multiple indicators with nice table output.
I was asked many times to update custom screener to display results in a table form. This way it looks much better.
You can play with background colors depend on values you're looking for.
In the screener, for example, I'm highlighting overbought/oversold RSI values, big ADX levels and trend of the Supertrend.
In parameters you can change settings for all indicators and change/disable tickers if 40 is too many for you.
There is only 1 function that calculates all these indicators. Potentially you can change and even add more indicators to this function.
Writing code for these kind of screener is a bit time consuming, so I even created a code generator in Python for these kind of indicators :) .
Disclaimer
Please remember that past performance may not be indicative of future results.
Due to various factors, including changing market conditions, the strategy may no longer perform as well as in historical backtesting.
This post and the script don’t provide any financial advice.

Overlay Indicators (EMAs, SMAs, Ichimoku & Bollinger Bands)This is a combination of popular overlay indicators that are used for dynamic support and resistance, trade targets and trend strength.
Included are:
-> 6 Exponential Moving Averages
-> 6 Simple Moving Averages
-> Ichimoku Cloud
-> Bollinger Bands
-> There is also a weekend background marker ideal for cryptocurrency trading
Using all these indicators in conjunction with each other provide great confluence and confidence in trades and price targets.
An explanation of each indicator is listed below.
What Is an Exponential Moving Average (EMA)?
"An exponential moving average (EMA) is a type of moving average (MA) that places a greater weight and significance on the most recent data points. The exponential moving average is also referred to as the exponentially weighted moving average. An exponentially weighted moving average reacts more significantly to recent price changes than a simple moving average (SMA), which applies an equal weight to all observations in the period.
What Does the Exponential Moving Average Tell You?
The 12- and 26-day exponential moving averages (EMAs) are often the most quoted and analyzed short-term averages. The 12- and 26-day are used to create indicators like the moving average convergence divergence (MACD) and the percentage price oscillator (PPO). In general, the 50- and 200-day EMAs are used as indicators for long-term trends. When a stock price crosses its 200-day moving average, it is a technical signal that a reversal has occurred.
Traders who employ technical analysis find moving averages very useful and insightful when applied correctly. However, they also realize that these signals can create havoc when used improperly or misinterpreted. All the moving averages commonly used in technical analysis are, by their very nature, lagging indicators."
Source: www.investopedia.com
Popular EMA lookback periods include fibonacci numbers and round numbers such as the 100 or 200. The default values of the EMAs in this indicator are the most widely used, specifically for cryptocurrency but they also work very well with traditional.
EMAs are normally used in conjunction with Simple Moving Averages.
" What Is Simple Moving Average (SMA)?
A simple moving average (SMA) calculates the average of a selected range of prices, usually closing prices, by the number of periods in that range.
Simple Moving Average vs. Exponential Moving Average
The major difference between an exponential moving average (EMA) and a simple moving average is the sensitivity each one shows to changes in the data used in its calculation. More specifically, the EMA gives a higher weighting to recent prices, while the SMA assigns an equal weighting to all values."
Source: www.investopedia.com
In this indicator, I've included 6 popular moving averages that are commonly used. Most traders will find specific settings for their own personal trading style.
Along with the EMA and SMA, another indicator that is good for finding confluence between these two is the Ichimoku Cloud.
" What is the Ichimoku Cloud?
The Ichimoku Cloud is a collection of technical indicators that show support and resistance levels, as well as momentum and trend direction. It does this by taking multiple averages and plotting them on the chart. It also uses these figures to compute a "cloud" which attempts to forecast where the price may find support or resistance in the future.
The Ichimoku cloud was developed by Goichi Hosoda, a Japanese journalist, and published in the late 1960s.1 It provides more data points than the standard candlestick chart. While it seems complicated at first glance, those familiar with how to read the charts often find it easy to understand with well-defined trading signals."
More info can be seen here: www.investopedia.com
I have changed the default settings on the Ichimoku to suit cryptocurrency trading (as cryptocurrency is usually fast and thus require slightly longer lookbacks) to 20 60 120 30.
Along with the Ichimoku, I like to use Bollinger Bands to not only find confluence for support and resistance but for price discovery targets and trend strength.
" What Is a Bollinger Band®?
A Bollinger Band® is a technical analysis tool defined by a set of trendlines plotted two standard deviations (positively and negatively) away from a simple moving average (SMA) of a security's price, but which can be adjusted to user preferences.
Bollinger Bands® were developed and copyrighted by famous technical trader John Bollinger, designed to discover opportunities that give investors a higher probability of properly identifying when an asset is oversold or overbought."
This article goes into great detail of the complexities of using the Bollinger band and how to use it.
=======
This indicator combines all these powerful indicators into one so that it is easier to input different settings, turn specific tools on or off and can be easily customised.

No Nonsense NNFX VP Strategy for Back Testing Indicators| jhAfter putting the whole system together, sat down to benchmark the various confirmation indicators, shrink it down to backtest individual confirmation indicators.
Results for 24 periods way better than 10, then again it's only one pair. :)
More details below.
//////////////////////////////////////////////////////////////////////////////////////////////////////////////////////////////////
//Designed per No Nonsense Forex VP rules
//For testing your individual indicators before the full system
//Originated from causecelebre
//Tried to put in as much VP rules as possible
///////////////////////////////////////////////////
//Rules Implemented:
///////////////////////////////////////////////////
// - SL 1.5 x ATR
// - TP 1 x ATR
//
// - Entry conditions
//// - Entry from 1 x confirmation
// - Exit conditions
//// - Exit on confirmation flip
///////////////////////////////////////////////////
//Trades entries
///////////////////////////////////////////////////
// - First entry L1 or S1 with standard SL and TP
///////////////////////////////////////////////////
//Included Indicators and settings
///////////////////////////////////////////////////
// - Confirmtion = SSL 10
///////////////////////////////////////////////////
//Credits
// Strategy causecelebre www.tradingview.com
// SSL Channel ErwinBeckers www.tradingview.com
//////////////////////////////////////////////////////////////////////////////////////////////////////////////////////////////////
//Change log
//First release. Testing of indicators
//////////////////////////////////////////////////////////////////////////////////////////////////////////////////////////////////

Auto Fibo on IndicatorsThis drawing tool aims to draw auto Fibonacci Retracement Levels on desired indicators.
Users can define the target indicator to draw Auto Fibo Lines, from the "settings tab":
There are six commonly used indicators below the charts that can be selected to draw Fibonacci Retracement lines on:
RSI : Relative Strength Index
CCI : Commodity Channel Index
MFI : Money Flow Index
STOCHASTIC : Stochastic Oscillator
CMF : Chaikin Money Flow
CMO : Chande Momentum Oscillator
Fibonacci Retracement Levels will appear automatically after applying the indicator.
The "Auto Fibo on Indicators" tool looks back. It checks the indicator levels for a desired number of bars and then draws the Fibonacci Levels automatically in the right way, considering the final movements of the indicator.
There are five commonly used Fibonacci Levels added between the Highest and Lowest values such as:
%23.6
%38.2
%50 (Not precisely a Fibonacci Level, indeed)
%61.8 (Golden Ratio)
%78.6
Four extra levels can be added from the settings tab by checking their boxes:
%127.2 (adjustable level)
%161.8
%261.8
%361.8
Default lookback bars of Auto Fibo Levels: 144 (which is also a Fibonacci number)
Default Indicator: RSI
Default Indicator length: 14
Default data source: CLOSE
Users can also define and show overbought and oversold levels by unchecking the "Do not Show Indicator Overbought / Oversold Levels?" button from the settings menu.
In technical analysis, Fibonacci Levels on price can guide valuable trading signals for investors.
Levels can be significant support and resistance levels for breakouts and turning points.
This drawing tool aims to follow those necessary levels on indicators to observe critical levels and breakouts.

No Code SignalsNo Code Signals is an intuitive user interface for users to generate their own signals based on indicators they already have applied to their chart.
This indicator makes use of the new input.source() limits for importing data from external sources (indicators) into 1 indicator.
You are now able to import ANY number of sources from up to 10 different indicators.
Features:
- Import up to 10 unique values from up to 10 different indicators already on your chart!
- Compare those values against other imported indicator values, or chart ohlc values.
- Option to use a defined level instead of an active source.
- 5 Signal Options (Currently)
- Alerts, Each signal has its own alert condition.
- Labeled Signals, to tell which signal is which.
Potential Future Plans:
- More Signals & Analysis Options
- Possibly more imports
- Combining 2 (or more) signals into 1
Here is a Screenshot of a chart with signals, and the Interface creating the signals.
Enjoy!

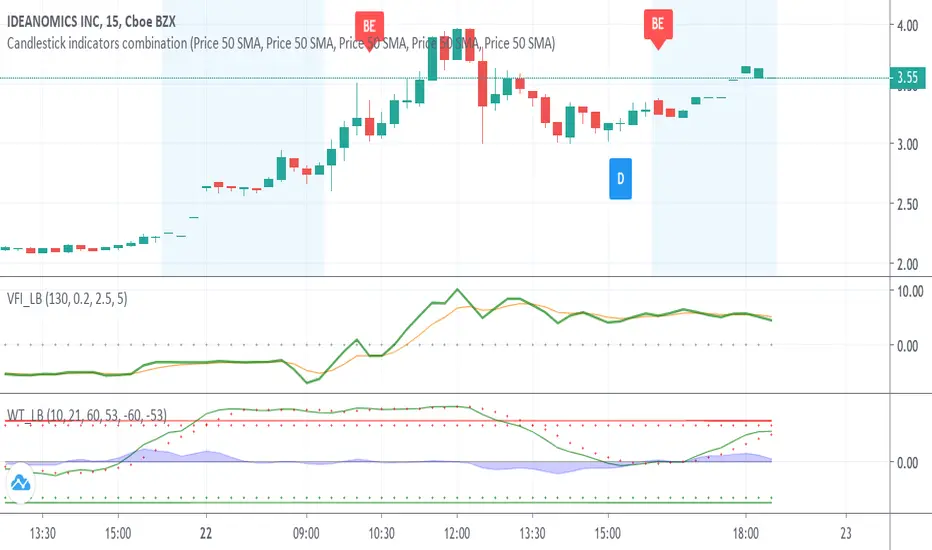
Candlestick indicators combinationWith the inclusion of the candlestick identifiers added to trading view today, I have compiled my favourite identifiers and put them together here. This way, you can see the following together instead of separately:
Bearish Engulfing
Bullish Engulfing
The Morning Star
The Three White Soldiers
The Hammer
The Inverted Hammer
See Investopedia for more on these indicators.
In addition, I have made the indicators to show green if indicating a bullish trend, red if indicating a bearish trend, and blue if indicating something else. Please validate these indicators with other factors like EMA before proceeding to make a trade.
Please let me know if there are other indicators you would like me to compile to this list.
Best wishes, and happy trading!
Variable Moving Average Bands [LazyBear]VMA Bands are ATR bands with VMA as its centre. For a description of options, refer to my VMA post:
I have moved VMA calculation in to a separate function. Feel free to use calc_vma() in your scripts. For more MA calculation function (KAMA, VIDYA and others), refer to my complete list of indicators below.
Wish you all a very prosperous New year. Hope these indicators make you all more money this year too :)
List of my other indicators:
- GDoc: docs.google.com
- Chart:

DEnvelope [Better Bollinger Bands]*** ***
Bollinger Bands (BB) usually expand quickly after a volatility increase but contract more slowly as volatility declines. This extended time it takes for BB to contract after a volatility drop can make trading some instruments using BB alone difficult or less profitable.
In the October 1998 issue of "Futures" there is an article written by Dennis McNicholl called "Better Bollinger Bands", in which the author recommends improving BB by modifying:
- the center line formula &
- different equations for calculating the bands.
These bands, called "DEnvelope", follow price more closely and respond faster to changes in volatility with these modifications.
Fore more indicators, check out my "Master Index of indicators" (Also check my published charts page for new ones I haven't added to that list):
More scripts related to DEnvelope:
------------------------------------------------
- DEnvelope Bandwidth: pastebin.com
- DEnvelope %B : pastebin.com
Sample chart with above indicators: www.tradingview.com

Liquidity Entry Triggers (4-Model System) | WarRoomXYZLiquidity Entry Triggers is an open-source, price-action-based analytical framework designed to highlight recurring institutional liquidity behaviors that appear across all liquid markets.
The script focuses on how and where liquidity is taken, rather than attempting to predict direction using oscillators or lagging indicators.
It is optimized for XAUUSD, FX pairs, indices, and crypto , particularly on 1m–15m timeframes where session behavior and liquidity reactions are most visible.
This tool is not a buy/sell signal generator .
It provides contextual entry zones based on structural liquidity logic, allowing traders to apply their own execution rules.
Core Philosophy
Markets move because of:
•Trapped traders
•Forced liquidations
•Session-based liquidity cycles
•Reactions at prior institutional participation zones
This script visualizes four repeatable entry triggers that emerge from those mechanisms.
🔹 1. Failed Breakout / Trapped Trader Model
When price breaks a clearly defined range high or low, breakout traders often enter expecting continuation.
If price fails to hold outside the range and closes back inside, those traders become trapped.
The script detects:
•Breaks beyond recent highs/lows
•Immediate rejection back into the range
•Structural failure of momentum
These conditions frequently lead to mean reversion or reversal moves as trapped traders exit and fuel movement in the opposite direction.
Markers are plotted at the point of failure to highlight potential trap zones.
🔹 2. Liquidation Flush Detection
Sharp impulsive candles with abnormally large wicks often represent liquidation cascades rather than healthy trend continuation.
The script identifies liquidation behavior by measuring:
•Wick-to-body imbalance
•Sudden expansion followed by rejection
•Temporary price inefficiencies
These flushes commonly occur near:
•Session highs/lows
•Range extremes
•Trend exhaustion points
Such events often lead to rebalance moves , where price partially or fully fills the wick.
🔹 3. Orderblock Reaction Zones
Orderblocks represent areas where heavy participation occurred before a strong displacement move.
The script highlights:
•Clean bullish and bearish orderblock structures
•Zones formed during consolidation prior to expansion
•Areas likely to be defended when revisited
Orderblocks with minimal noise and clean departure are prioritized, as they often reflect institutional positioning rather than retail activity.
These zones are intended as reaction areas , not automatic entry signals.
🔹 4. London Session Liquidity Sweep Model
The London session frequently establishes the initial daily high or low.
Later in the session or during New York, price often:
•Sweeps internal liquidity around that level
•Rejects after the sweep
•Continues with the higher-timeframe bias
The script monitors London session behavior and marks:
•Liquidity runs above/below London highs and lows
•Rejections back inside the prior structure
This model is especially effective when combined with broader daily context.
🔹4. How the Components Work Together
The framework is designed as a context stack , not a checklist of signals:
Liquidity Event → Location → Timing → Trader Execution
Each model reinforces the others:
•Failed breakouts often occur after liquidity sweeps
•Liquidation wicks frequently form near orderblocks
•London sweeps often trigger failed momentum moves
•Confluence increases probability, not certainty
🔹 Practical Usage Guide
✔ Identify context
Determine whether price is approaching a range extreme, session level, or prior participation zone.
✔ Wait for a liquidity event
Look for a sweep, failed breakout, or liquidation wick.
✔ Observe reaction
Rejection, displacement, or reclaim behavior provides confirmation.
✔ Execute manually
Stops are commonly placed beyond the liquidity extreme.
Targets are typically internal liquidity, prior highs/lows, or imbalance zones.
The indicator does not manage trades or enforce rules.
Execution and risk management remain the trader’s responsibility.
🔹 5. Originality & Design Notes
This script does not replicate or bundle existing indicators.
It introduces:
•A multi-model liquidity entry framework
•Structural failed breakout detection
•Wick-based liquidation imbalance logic
•Session-aware liquidity sweep visualization
•A unified, minimal, non-lagging design
All concepts are based on observable market behavior and integrated into a single analytical tool.
🔹 6. Suitable Markets & Timeframes
Works best on:
•XAUUSD
•Major FX pairs
•Indices
•Liquid crypto markets
Recommended timeframes:
•1m
•5m
•15m
•30m
🔹7. Limitations & Notes
•This is an analytical framework , not a trading system
•All markings are confirmed at candle close (non-repainting)
•No open interest or order flow data is used
•Results depend on user interpretation and execution
•Best used alongside session bias and higher-timeframe structure
Disclaimer
This script is provided for educational and informational purposes only.
It does not constitute financial advice, investment advice, or a recommendation to buy or sell any instrument.
Trading involves risk, and losses can exceed initial deposits.
The author assumes no responsibility for trading decisions made using this tool.
Users are strongly encouraged to test this script in demo or simulation environments and to apply proper risk management, position sizing, and personal discretion at all times.
By using this script, you acknowledge and accept all associated risks.

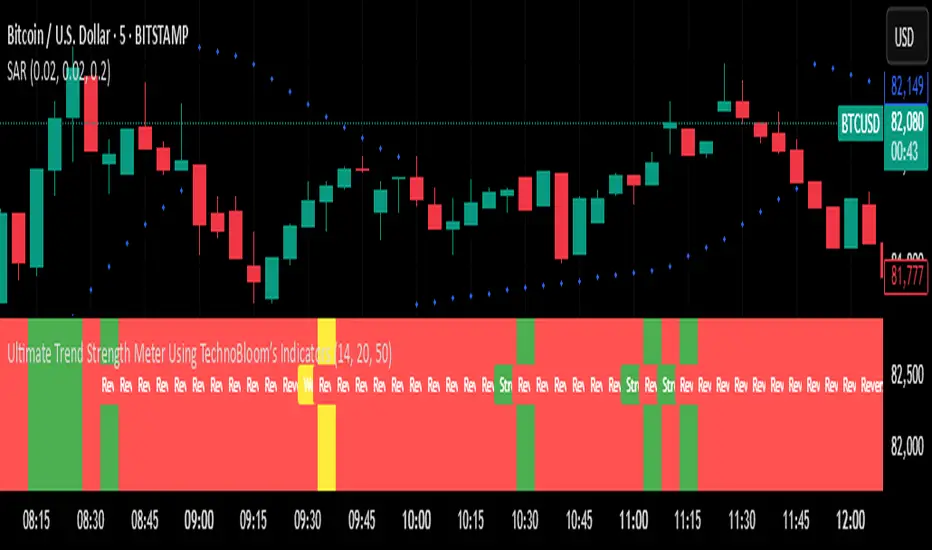
Ultimate Trend Strength Meter Using TechnoBloom’s IndicatorsOverview
The Ultimate Trend Strength Meter Using TechnoBloom’s Indicators is a powerful trend analysis tool developed using TechnoBloom’s proprietary indicators. This indicator helps traders assess trend strength, momentum, and potential reversals by combining three essential market factors:
• Market Participation Ratio (MPR) – Measures trader engagement and volume strength.
• Volume Weighted Moving Average (VWMO) – Confirms momentum and trend direction.
• Fibonacci-Based Support & Resistance – Identifies key reversal zones and breakout points.
⸻
Key Features:
✅ Color-Coded Trend Strength Meter:
• 🟢 Green – Strong Trend (High Confidence): High participation, strong momentum, and no major resistance.
• 🟡 Yellow – Weak Trend (Caution): Moderate participation, possible resistance ahead, and trend uncertainty.
• 🔴 Red – Reversal Risk / No Trend: Low market engagement, momentum uncertainty, and proximity to major Fibonacci levels.
✅ Eliminates False Signals & Weak Trends:
• Prevents choppy market entries by ensuring high-volume confirmation.
• Ideal for filtering fake breakouts and exhaustion phases.
✅ Works for All Trading Styles & Markets:
• Scalping (1m-5m), Day Trading (15m-1H), and Swing Trading (4H-Daily).
• Suitable for Forex, Stocks, Crypto, Indices, and Commodities (XAUUSD, US30, BTCUSD, etc.).
✅ Customizable for Any Strategy:
• Adjustable MPR thresholds, VWMO smoothing, and Fibonacci sensitivity.
• Built-in alerts notify traders when trend conditions change.
⸻
How to Use It:
1️⃣ Enter trades when the meter turns Green (Strong Trend) and aligns with your strategy.
2️⃣ Avoid or exit trades when it turns Red (Reversal Risk) to prevent unnecessary losses.
3️⃣ Use Yellow as a caution zone – wait for confirmation before making a move.
4️⃣ Combine with breakout strategies or support/resistance setups for high-probability entries.
⸻
About TechnoBlooms
TechnoBlooms is committed to developing high-precision trading indicators that enhance decision-making for traders across all markets. This tool is a result of our in-depth market research and algorithmic advancements to provide traders with an edge.
🚀 Upgrade your trading with the Ultimate Trend Strength Meter – Developed by TechnoBlooms! 🚀
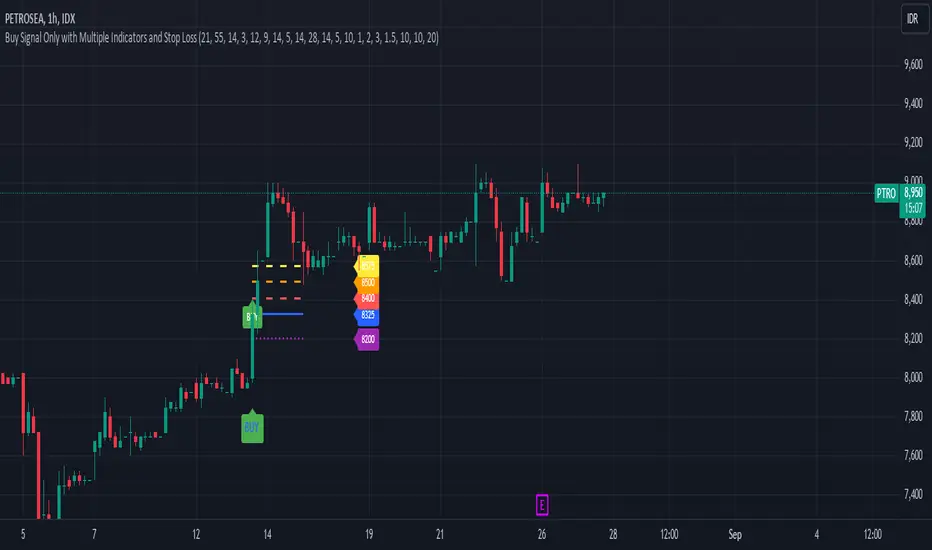
Buy Signal Only with Multiple Indicators and Stop LossDescription: This custom Pine Script indicator is designed to help traders identify optimal buy signals using a combination of multiple technical indicators. It provides visual markers for entry points, take profit levels, and stop loss, offering a comprehensive tool for decision-making.
Features:
Buy Signal: Generates a buy signal based on a combination of EMA Cloud, SuperTrend, Zero Lag MACD, QQE, Volume Oscillator, and ATR Bands.
Entry Point: Displays a horizontal line at the entry price with a price label, extended to the right for visibility.
Take Profit Levels:
1% Take Profit: A dashed red line with a price label for the first take profit level.
2% Take Profit: A dashed orange line with a price label for the second take profit level.
Stop Loss: A dotted purple line with a price label to indicate the stop loss level set at 3%.
Parameters:
EMA Short Length: Adjust the period for the short EMA.
EMA Long Length: Adjust the period for the long EMA.
ATR Length: Set the length for ATR calculation.
Multiplier: Define the factor for the SuperTrend calculation.
MACD Length and Signal Length: Configure lengths for MACD and its signal line.
RSI Length and Smooth Length: Set parameters for RSI and its smoothing.
Volume Lengths: Customize lengths for the volume oscillator.
ATR Band Length and Multiplier: Set parameters for ATR Bands.
Delay Bars: Specify the number of bars to wait before showing another buy signal.
Take Profit Percentages: Adjust percentages for the 1% and 2% take profit levels.
Stop Loss Percentage: Set the stop loss percentage.
Line Extension Length: Define the number of bars to extend lines.
Right Offset Bars: Configure how many bars to offset labels and lines to the right.
Usage:
Identify Buy Opportunities: The indicator helps identify potential buy signals using multiple indicators.
Manage Trades: Visualize entry points, take profit targets, and stop loss levels to manage trades effectively.
Customization: Tailor the indicator to fit your trading strategy by adjusting the parameters.
Notes:
This is what we call version 1.
Ensure that the indicator's settings align with your trading strategy and market conditions.Use in conjunction with other analysis tools for a comprehensive trading approach.
M.H Pee indicatorsHere is a collection of Trend Indicators as defined by M.H Pee and presented
in various articles of the "STOCKS & COMMODITIES Magazine"
The actual implementation of the indicators here are made by: everget
I thought they were rather cool, so I have gather them here so that they easily can be tested.
My own test was made using 15 companies from the OMXS30 list
during the time period of 2016-2018, and I only went LONG.
The result was as follows (Average Net Profit , StdDev):
TDI 3.04% 5.97
TTF 1.22%. 5.73
TII 1.07% 6.2
TCF 0.32% 2.68
Would be interesting to hear what other people get as test result from these indicators.
To do that just run this strategy, and chose the indicator from the setup menu.

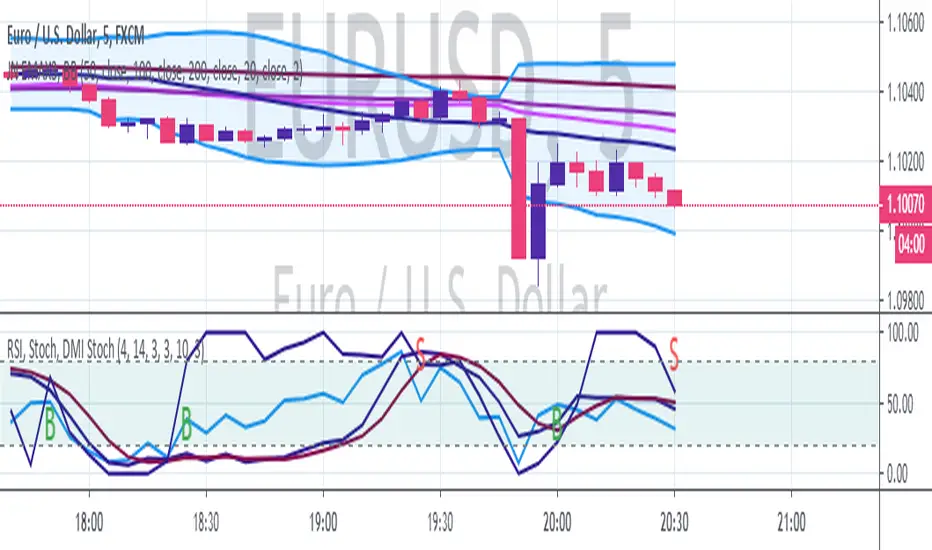
3 in 1 Indicators as used by JN (RSI, Stoch, DMI Stoch)This Indicator comprises the following individual indicators:
- RSI 4
- Stochastic 14,3,3
- DMI Stochastic 10,3
Analisis:
- By using this indicator alongside with the 4 in 1 JN Indicators (posted before this one), you can determine the change in trend when:
- When the bollinger bands are broken
- When an EMA is reached
- When all lines in the indicator are above or below the overbough/oversold lines
That means a change of Trend.

4 in 1 Indicators as used by JN (EMAx3, BB)This Indicator comprises the following individual indicators:
- EMA 50
- EMA 100
- EMA 200
- BB 20
Analisis:
- By using this indicator alongside with the 3 in 1 JN Indicators (will be posted later), you can determine the change in trend when:
- When the bollinger bands are broken
- When an EMA is reached
- When all lines in the indicator are above or below the overbough/oversold lines
That means a change of Trend.