kama
█ Description
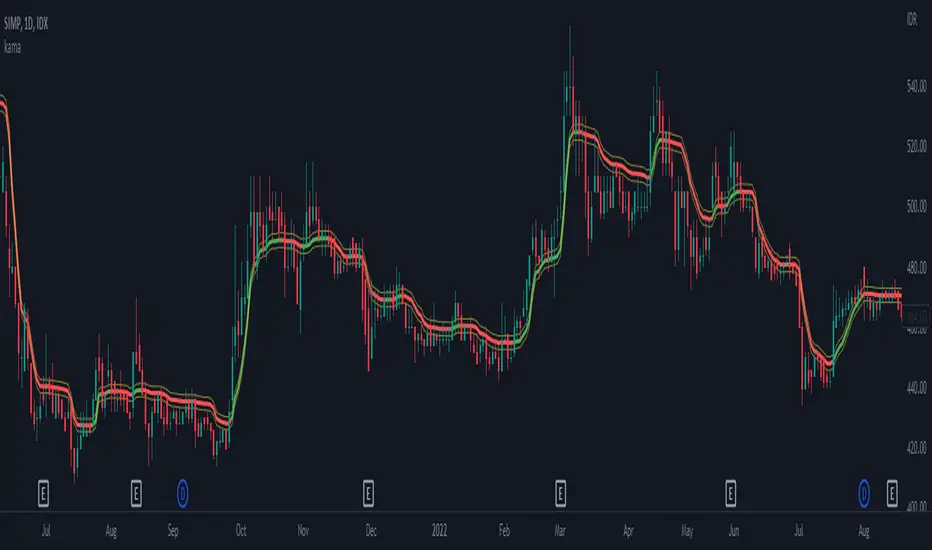
An adaptive indicator could be defined as market conditions following indicator, in summary, the parameter of the indicator would be adjusted to fit its optimum value to the current price action. KAMA, Kaufman's Adaptive Moving Average, an adaptive trendline indicator developed by Perry J. Kaufman, with the notion of using the fastest trend possible based on the smallest calculation period for the existing market conditions, by applying an exponential smoothing formula to vary the speed of the trend (changing smoothing constant each period), as cited from Trading Systems and Methods p.g. 780 (Perry J. Kaufman). In this indicator, the proposed notion is on the Efficiency Ratio within the computation of KAMA, which will use a Dominant Cycle instead, an adaptive filter developed by John F. Ehlers, on determining the n periods, aiming to achieve an optimum lookback period, with respect to the original Efficiency Ratio calculation period of less than 14, and 8 to 10 is preferable.
█ Kaufman's Adaptive Moving Average
kama_ = kama + smoothing_constant * (price - kama )
where:
price = current price (source)
smoothing_constant = (efficiency_ratio * (fastest - slowest) + slowest)^2
fastest = 2/(fastest length + 1)
slowest = 2/(slowest length + 1)
efficiency_ratio = price - price /sum(abs(src - src , int(dominant_cycle))
█ Feature
The indicator will have a specified default parameter of: length = 14; fast_length = 2; slow_length = 30; hp_period = 48; source = ohlc4
KAMA trendline i.e. output value if price above the trendline and trendline indicates with green color, consider to buy/long position
while, if the price is below the trendline and the trendline indicates red color, consider to sell/short position
Hysteresis Band
Bar Color
other example
Cari dalam skrip untuk "kama"
KAMA CloudDescription:
The KAMA Cloud indicator is a sophisticated trading tool designed to provide traders with insights into market trends and their intensity. This indicator is built on the Kaufman Adaptive Moving Average (KAMA), which dynamically adjusts its sensitivity to filter out market noise and respond to significant price movements. The KAMA Cloud leverages multiple KAMAs to gauge trend direction and strength, offering a visual representation that is easy to interpret.
How It Works:
The KAMA Cloud uses twenty different KAMA calculations, each set to a distinct lookback period ranging from 5 to 100. These KAMAs are calculated using the average of the open, high, low, and close prices (OHLC4), ensuring a balanced view of price action. The relative positioning of these KAMAs helps determine the direction of the market trend and its momentum.
By measuring the cumulative relative distance between these KAMAs, the indicator effectively assesses the overall trend strength, akin to how the Average True Range (ATR) measures market volatility. This cumulative measure helps in identifying the trend’s robustness and potential sustainability.
The visualization component of the KAMA Cloud is particularly insightful. It plots a 'cloud' formed between the base KAMA (set at a 100-period lookback) and an adjusted KAMA that incorporates the cumulative relative distance scaled up. This cloud changes color based on the trend direction — green for upward trends and red for downward trends, providing a clear, visual representation of market conditions.
Benefits:
Dynamic Sensitivity: By adapting to the market's volatility, KAMA provides more reliable signals than traditional moving averages.
Trend Clarity: The color-coded cloud visually enhances the perception of the trend’s direction and strength, making it easier for traders to decide on their trading strategy.
Versatility: Suitable for various asset classes, including stocks, forex, commodities, and cryptocurrencies, across different timeframes.
Decision Support: Helps traders understand not just the direction but the strength of trends, aiding in more informed decision-making regarding entries, exits, and risk management.
Usage:
The KAMA Cloud is ideal for traders who need a robust trend-following tool that adjusts according to market dynamics. It can be used as a standalone indicator or in conjunction with other technical analysis tools to enhance trading strategies. Look for the cloud’s color shifts as potential signals for trend reversals or continuations, and consider the cloud’s thickness as an indication of trend strength.
Whether you are a day trader, swing trader, or long-term investor, the KAMA Cloud offers a unique approach to understanding market trends, helping you navigate the complexities of various market conditions with confidence.

KAMA: Kaufman Adaptive Moving Average x2/LogCalculation begins at the beginning of the bar, eliminating incorrect moving average weighting at the very beginning of the ticker you're watching. This is important for new stocks, futures, altcoins, etc.
The inputs for the fast/slow alphas are now normal integers, with the calculation (2 / (y + 1)) for alpha added after input.
Comes with two moving averages and a setting for geometric mean/log. Source is adjustable but using the close works best, especially with how this particular MA is calculated in the first place. Besides that, this is mostly the same as other KAMAs on TradingView, but I'd like to say I put a bit more care into this one.
It is important to know that the acceptable length for KAMA is within the boundaries of the alpha lengths. For example, the default lengths are 2 and 30 for alpha, so the acceptable length for KAMA is within 2-30.
stockcharts.com
www.technicalindicators.net

KAMA Strategy - Kaufman's Adaptive Moving AverageThis strategy combines Kaufman's Adaptive Moving Average for entry with optional KAMA, PSAR, and Trailing ATR stops for exits.
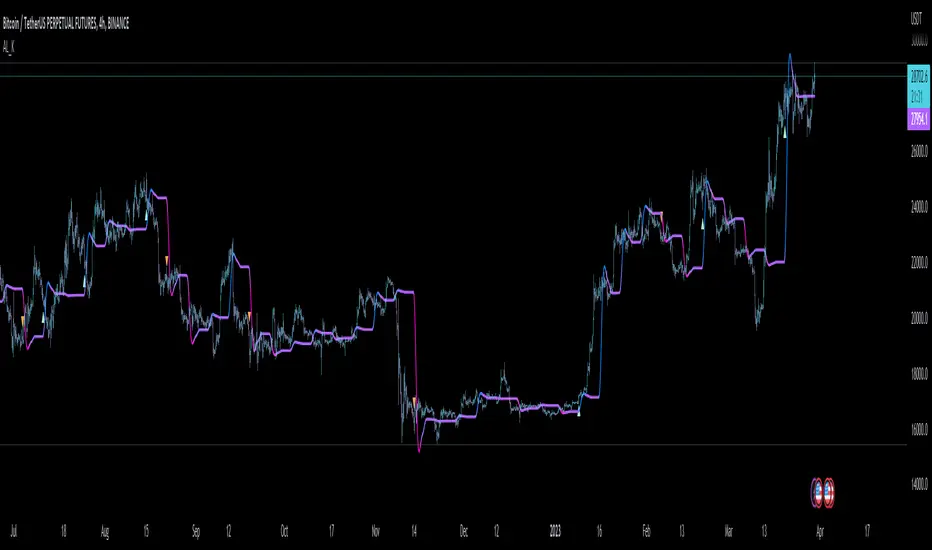
Kaufman's Adaptive Moving Average is, in my opinion, a gem among the plethora of indicators. It is underrated considering it offers a solution that intuitively makes a lot of sense. When I first read about it, it was a real 'aha!' moment. Look at the top, pink line. Notice how during trending times it follows the trend quickly and closely, but during choppy, non-trending periods, the KAMA stays absolutely flat? Interesting! To trade with it, we simply follow the direction the KAMA is pointing. Is it up? Go long. Is it down? Go short. Is it flat? Hold on.
How does it manage to quickly follow real trends like a fast EMA but ignore choppy conditions that would whipsaw a fast EMA back and forth? It analyses whether recent price moves are significant relative to recent noise and then adapts the length of the EMA window accordingly. If price movement is big compared to the recent noise, the EMA window gets smaller. If price movement is relatively small or average compared to the recent noise, the EMA window gets bigger. In practice it means:
The KAMA would be flat if a 20 point upwards move occurred during a period that has had, on average, regular 20 point moves BUT
the KAMA would point up if a 20 point move occurred during a period that has, on average, had moves of only around 5 points.
In other words, it's a slow EMA during choppy flat / quiet flat periods, and a fast EMA as soon as significant volatility occurs. Perfect!
-----
The Strategy
The strategy is more than just a KAMA indicator. It contains:
KAMA exit (optional)
ATR trailing stop loss exit (optional)
PSAR stop loss exit (optional)
KAMA filter for entry and exits
All features are adjustable in the strategy settings
The Technical Details:
Check out the strategy's 'Inputs' panel. The buy and sell signals are based on the 'KAMA 1' there.
KAMA 1: Length -- 14 is the default. This is the length of the window the KAMA looks back over. In this instance, it c
KAMA 1: Fast KAMA Length -- 2 is the default. This is the tightest the EMA length is allowed to get. It will tend towards this length when volatility is high.
KAMA 1: Slow KAMA Length -- 20 is the default. This is the biggest the EMA length is allowed to get. It will tend towards this length when volatility is low.
KAMA Filter
The strategy buys when the KAMA begins to point up and sells when the KAMA points down. Generally, the KAMA is very good at filtering out the noise itself - it will go flat during noisy/choppy periods. But to add another layer of safety, its author, Perry Kaufman, proposed a KAMA filter. It works by taking the standard deviation of returns over the length of the the 'KAMA 1: Length' I mentioned above and multiplying it by an 'Entry Filter' (1 by default) and 'Exit Filter' (0.5 by default). The entry condition to go long is that the KAMA is pointing up and and it moved up more than 1 x St. Dev. of Returns. The exit condition is when the KAMA is pointing down and it moved down by more than 0.5 x St. Dev. of Returns.
Thanks
Thanks to ChuckBanger, cheatcountry, millerrh, and racer8 for parts of the code. I was able to build upon their good work.
-----
I hope this strategy is helpful to you.
Do you have any thoughts, ideas, or questions? Let me know in the comments or send me a message! I'd be glad to help you out.
If you need an indicator or strategy to be built or customised for you, let me know! I'll be glad to help and it'll probably be cheaper than you think!

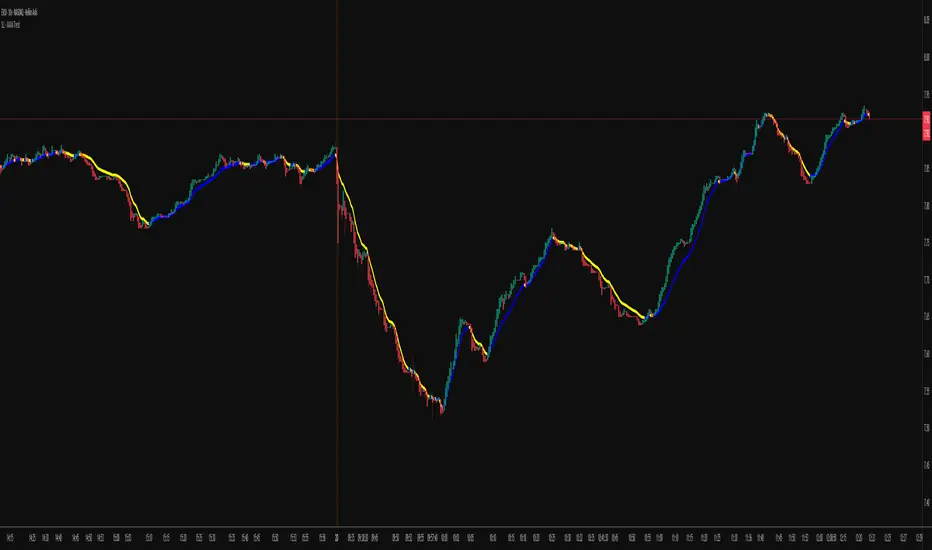
KAMA Trend Flip - SightLing LabsBuckle up, traders—this open-source KAMA Trend Flip indicator is your ticket to sniping trend reversals with a Kaufman Adaptive Moving Average (KAMA) that’s sharper than a Wall Street shark’s tooth. No voodoo, no fluff—just raw, volatility-adaptive math that dances with the market’s rhythm. It zips through trending rockets and chills in choppy waters, slashing false signals like a samurai. Not laggy like the others - this thing is the real deal!
Core Mechanics:
• Efficiency Ratio (ER): Reads the market’s pulse (0-1). High ER = turbo-charged MA, low ER = smooth operator.
• Adaptive Smoothing: Mixes fast (default power 2) and slow (default 30) constants to match market mood swings.
• Trend Signals: KAMA climbs = blue uptrend (bulls run wild). KAMA dips = yellow downtrend (bears take over). Flat = gray snooze-fest.
• Alerts: Instant pings on flips—“Trend Flip Up” for long plays, “Down” for shorts. Plug into bots for set-and-forget domination.
Why It Crushes:
• Smokes static MAs in volatile arenas (crypto, stocks, you name it). Backtests show 20-30% fewer fakeouts than SMA50.
• Visual Pop: Overlays price with bold blue/yellow signals. Slap it on BTC 1D to see trends light up like Times Square.
• Tweakable: Dial ER length (default 50) to your timeframe. Short for scalps, long for swing trades.
Example Settings in Action:
• 10s Chart (Hyper-Scalping): Set Source: Close, ER Length: 100, Fast Power: 1, Slow Power: 6. Catches micro-trends in crypto like a heat-seeking missile. Blue/yellow flips scream entry/exit on fast moves.
• 2m Chart (Quick Trades): Set Source: Close, ER Length: 14, Fast Power: 1, Slow Power: 6. Perfect for rapid trend shifts in stocks or forex. Signals align with momentum bursts—check historical flips for proof.
Deployment:
• Drop it on any chart. Backtest settings to match your asset’s volatility—tweak until it sings.
• Pair with RSI or volume spikes for killer confirmation. Pro move: Enter on flip + volume pop, exit on reverse.
• Strategy-Ready: Slap long/short logic on alerts to build a lean, mean trading machine.
Open source from SightLing Labs—grab it, hack it, profit from it. Share your tweaks in the comments and let’s outsmart the market together. Trade hard, win big!
KAMA Cloud STIndicator:
Description:
The KAMA Cloud indicator is a sophisticated trading tool designed to provide traders with insights into market trends and their intensity. This indicator is built on the Kaufman Adaptive Moving Average (KAMA), which dynamically adjusts its sensitivity to filter out market noise and respond to significant price movements. The KAMA Cloud leverages multiple KAMAs to gauge trend direction and strength, offering a visual representation that is easy to interpret.
How It Works:
The KAMA Cloud uses twenty different KAMA calculations, each set to a distinct lookback period ranging from 5 to 100. These KAMAs are calculated using the average of the open, high, low, and close prices (OHLC4), ensuring a balanced view of price action. The relative positioning of these KAMAs helps determine the direction of the market trend and its momentum.
By measuring the cumulative relative distance between these KAMAs, the indicator effectively assesses the overall trend strength, akin to how the Average True Range (ATR) measures market volatility. This cumulative measure helps in identifying the trend’s robustness and potential sustainability.
The visualization component of the KAMA Cloud is particularly insightful. It plots a 'cloud' formed between the base KAMA (set at a 100-period lookback) and an adjusted KAMA that incorporates the cumulative relative distance scaled up. This cloud changes color based on the trend direction — green for upward trends and red for downward trends, providing a clear, visual representation of market conditions.
How the Strategy Works:
The KAMA Cloud ST strategy employs multiple KAMA calculations with varying lengths to capture the nuances of market trends. It measures the relative distances between these KAMAs to determine the trend's direction and strength, much like the original indicator. The strategy enhances decision-making by plotting a 'cloud' formed between the base KAMA (set to a 100-period lookback) and an adjusted KAMA that scales according to the cumulative relative distance of all KAMAs.
Key Components of the Strategy:
Multiple KAMA Layers: The strategy calculates KAMAs for periods ranging from 5 to 100 to analyze short to long-term market trends.
Dynamic Cloud: The cloud visually represents the trend’s strength and direction, updating in real-time as the market evolves.
Signal Generation: Trade signals are generated based on the orientation of the cloud relative to a smoothed version of the upper KAMA boundary. Long positions are initiated when the market trend is upward, and the current cloud value is above its smoothed average. Conversely, positions are closed when the trend reverses, indicated by the cloud falling below the smoothed average.
Suggested Usage:
Market: Stocks, not cryptocurrency
Timeframe: 1 Hour
Indicator:

VHF Adaptive Linear Regression KAMAIntroduction
Heyo, in this indicator I decided to add VHF adaptivness, linear regression and smoothing to a KAMA in order to squeeze all out of it.
KAMA:
Developed by Perry Kaufman, Kaufman's Adaptive Moving Average (KAMA) is a moving average designed to account for market noise or volatility. KAMA will closely follow prices when the price swings are relatively small and the noise is low. KAMA will adjust when the price swings widen and follow prices from a greater distance. This trend-following indicator can be used to identify the overall trend, time turning points and filter price movements.
VHF:
Vertical Horizontal Filter (VHF) was created by Adam White to identify trending and ranging markets. VHF measures the level of trend activity, similar to ADX DI. Vertical Horizontal Filter does not, itself, generate trading signals, but determines whether signals are taken from trend or momentum indicators. Using this trend information, one is then able to derive an average cycle length.
Linear Regression Curve:
A line that best fits the prices specified over a user-defined time period.
This is very good to eliminate bad crosses of KAMA and the pric.
Usage
You can use this indicator on every timeframe I think. I mostly tested it on 1 min, 5 min and 15 min.
Signals
Enter Long -> crossover(close, kama) and crossover(kama, kama )
Enter Short -> crossunder(close, kama) and crossunder(kama, kama )
Thanks for checking this out!
--
Credits to
▪️@cheatcountry – Hann Window Smoohing
▪️@loxx – VHF and T3
▪️@LucF – Gradient
Kaufman Adaptive Moving Average (KAMA) Strategy [TradeDots]"The Kaufman Adaptive Moving Average (KAMA) Strategy" is a trend-following system that leverages the adaptive qualities of the Kaufman Adaptive Moving Average (KAMA). This strategy is distinguished by its ability to adjust dynamically to market volatility, enhancing trading accuracy by minimizing the effects of false and delayed signals often associated with the Simple Moving Average (SMA).
HOW IT WORKS
This strategy is centered around use of the Kaufman Adaptive Moving Average (KAMA) indicator, which refines the principles of the Exponential Moving Average (EMA) with a superior smoothing technique.
KAMA distinguishes itself by its responsiveness to changes in market prices through an "Efficiency Ratio (ER)." This ratio is computed by dividing the recent absolute net price change by the cumulative sum of the absolute price changes over a specified period. The resulting ER value ranges between 0 and 1, where 0 indicates high market noise and 1 reflects stronger market momentum.
Using ER, we could get the smoothing constant (SC) for the moving average derived using the following formula:
fastest = 2/(fastma_length + 1)
slowest = 2/(slowma_length + 1)
SC = math.pow((ER * (fastest-slowest) + slowest), 2)
The KAMA line is then calculated by applying the SC to the difference between the current price and the previous KAMA.
APPLICATION
For entering long positions, this strategy initializes when there is a sequence of 10 consecutive rising KAMA lines. Conversely, a sequence of 10 consecutive falling KAMA lines triggers sell orders for long positions. The same logic applies inversely for short positions.
DEFAULT SETUP
Commission: 0.01%
Initial Capital: $10,000
Equity per Trade: 80%
Users are advised to adjust and personalize this trading strategy to better match their individual trading preferences and style.
RISK DISCLAIMER
Trading entails substantial risk, and most day traders incur losses. All content, tools, scripts, articles, and education provided by TradeDots serve purely informational and educational purposes. Past performances are not definitive predictors of future results.

[blackcat] L2 Perry Kaufman Adaptive MA (KAMA)Level: 2
Background
Kaufman’s Adaptive Moving Average (KAMA) was developed by American quantitative financial theorist Perry J. Kaufman in 1998. The technique began in 1972 but Kaufman officially presented it to the public much later through his book, “Trading Systems and Methods.” Unlike other moving averages, Kaufman’s Adaptive Moving Average accounts not only for price action but also for market volatility. KAMA is a moving average that takes into account market noise or volatility. KAMA will closely track prices when price fluctuations are relatively small and noise is low. KAMA will adapt to increasing price fluctuations and track prices from a greater distance. This trend following indicator can be used to identify the overall trend, time turning points and to filter price movements.
Function
You can use KAMA like any other trend-following indicator, such as a moving average. You can look for price crosses, directional changes and filtered signals. First, a cross above or below KAMA indicates directional changes in prices. As with any moving average, a simple crossover system will generate lots of signals and lots of whipsaws. Second, You can use the direction of KAMA to define the overall trend for a security. This may require a parameter adjustment to smooth the indicator further. You can change the fastline and slowline parameters to smooth KAMA and look for directional changes. The trend is down as long as KAMA is falling and forging lower lows. The trend is up as long as KAMA is rising and forging higher highs. Finally, You can combine signals and techniques. You can use a longer-term KAMA to define the bigger trend and a shorter-term KAMA for trading signals.
I have included in the indicator an input named "EnableSmooth" that allows you to determine if the KAMA line should be smoothed or not. A "True" as the input value smoothes the calculation. An "False" simply plots the raw KAMA line. When market volatility is low, Kaufman’s Adaptive Moving Average remains near the current market price, but when volatility increases, it will lag behind. What the KAMA indicator aims to do is filter out “market noise” – insignificant, temporary surges in price action. One of the primary weaknesses of traditional moving averages is that when used for trading signals, they tend to generate many false signals. The KAMA indicator seeks to lessen this tendency – generate fewer false signals – by not responding to short-term, insignificant price movements. Traders generally use the moving average indicator to identify market trends and reversals.
Key Signal
AMAValF --> KAMA Fast Line.
AMAValS --> KAMA Slow Line.
Remarks
This is a Level 2 free and open source indicator.
Feedbacks are appreciated.

Parabolic SAR of KAMA [Loxx]Parabolic SAR of KAMA attempts to reduce noise and volatility from regular Parabolic SAR in order to derive more accurate trends. In addition, and to further reduce noise and enhance trend identification, PSAR of KAMA includes two calculations of efficiency ratio: 1) price change adjusted for the daily volatility; or, 2) Jurik Fractal Dimension Adaptive (explained below)
What is PSAR?
The parabolic SAR indicator, developed by J. Wells Wilder, is used by traders to determine trend direction and potential reversals in price. The indicator uses a trailing stop and reverse method called "SAR," or stop and reverse, to identify suitable exit and entry points. Traders also refer to the indicator as to the parabolic stop and reverse, parabolic SAR, or PSAR.
What is KAMA?
Developed by Perry Kaufman, Kaufman's Adaptive Moving Average (KAMA) is a moving average designed to account for market noise or volatility. KAMA will closely follow prices when the price swings are relatively small and the noise is low. KAMA will adjust when the price swings widen and follow prices from a greater distance. This trend-following indicator can be used to identify the overall trend, time turning points and filter price movements.
What is the efficiency ratio?
In statistical terms, the Efficiency Ratio tells us the fractal efficiency of price changes. ER fluctuates between 1 and 0, but these extremes are the exception, not the norm. ER would be 1 if prices moved up 10 consecutive periods or down 10 consecutive periods. ER would be zero if price is unchanged over the 10 periods.
What is Jurik Fractal Dimension?
There is a weak and a strong way to measure the random quality of a time series.
The weak way is to use the random walk index (RWI). You can download it from the Omega web site. It makes the assumption that the market is moving randomly with an average distance D per move and proposes an amount the market should have changed over N bars of time. If the market has traveled less, then the action is considered random, otherwise it's considered trending.
The problem with this method is that taking the average distance is valid for a Normal (Gaussian) distribution of price activity. However, price action is rarely Normal, with large price jumps occuring much more frequently than a Normal distribution would expect. Consequently, big jumps throw the RWI way off, producing invalid results.
The strong way is to not make any assumption regarding the distribution of price changes and, instead, measure the fractal dimension of the time series. Fractal Dimension requires a lot of data to be accurate. If you are trading 30 minute bars, use a multi-chart where this indicator is running on 5 minute bars and you are trading on 30 minute bars.
Conclusion from the combined efforts explained above:
-PSAR is a tool that identifies trends
-To reduce noise and identify trends during periods of low volatility, we calculate a PSAR on KAMA
-To enhance noise and reduction and trend identification, we attempt to derive an efficiency ratio that is less reliant on a Normal (Gaussian) distribution of price
Included:
-Customization of all variables
-Select from two different ER calculation styles
-Multiple timeframe enabled

Kaufman's Adaptive Moving Average (KAMA) - Multi timeframeKaufman's Adaptive Moving Average (KAMA)
KAMA was developed by Perry Kaufman to give better directions of short term market trends.
Idea is similar to an EMA, but it makes adjustments to the smoothing factor by taking Market Noise into consideration. Levels of noise in KAMA is modelled using Kaufman's Efficiency Ratio .
The problem with traditional of moving averages (ie. SMA/EMA) is that they are very sensitive to sudden price movements.
Applications:
- Less prone to false signals compared to other types of moving averages. When price suddenly surges or tanks, KAMA will lag behind telling us that the move is rather abnormal.
- On the other hand, when volatility of price movements is low, KAMA will be close to the ranging candles with a slope approximate to zero. KAMA can be used for filtering out choppy markets.
Other features:
- Multi-timeframe.
- Can visualize levels of market noise with background color mode turned on.

KAMA Divergence [DW]This study is a simple experiment that expresses divergences between price and Kaufman's Adaptive Moving Average as a percentage. The result is then smoothed using KAMA to provide a signal line.

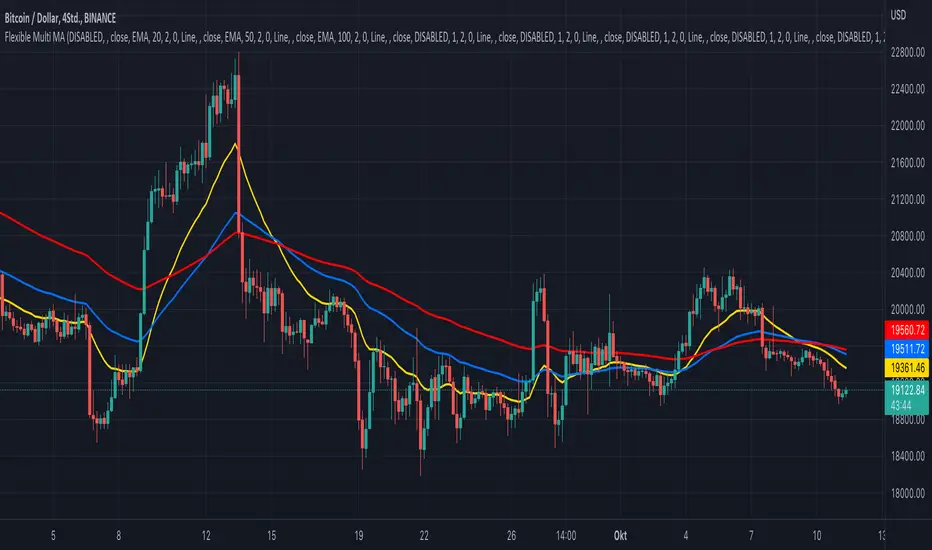
KINSKI Flexible Multi MA (EMA, SMA, RMA, WMA, VWMA, KAMA, HMA)This Multi Moving Average (MA) indicator is more flexible than any other indicator of this type offered so far. You can define up to 10 different Moving Average (MA) lines based on different calculation variants.
The following MA types can be configured.
- EMA: Exponentially Moving Average
- SMA: Small Moving Average
- RMA: Rolling Moving Average
- WMA: Weighted Moving Average
- VWMA: Volume Weighted Moving Average
- KAMA: Kaufman's Adaptive Moving Average
- HMA: Hull Moving Average
Which settings can be made?
- Selection for calculation formula ("Calculation Source"). The default value is "close".
- for each MA line the "Length" and the "Type" can be defined
- furthermore you can make layout adjustments via the "Style" menu
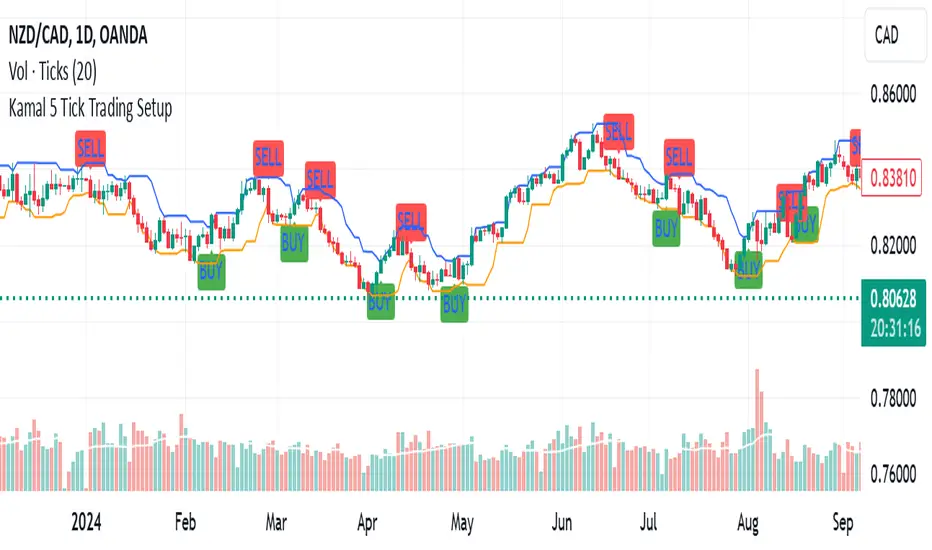
Kamal 5 Tick Trading SetupKamal 5 Tick Trading Setup
The "Kamal 5 Tick Trading Setup" is a custom indicator designed by Kamal Preet Singh Trader for TradingView to identify potential Buy and Sell signals on daily forex charts. This indicator helps traders make informed decisions based on the price action of the previous five daily candles.
Indicator Logic:
Buy Signal: A Buy signal is generated when the closing price of the current candle exceeds the highest high of the previous five daily candles.
Sell Signal: A Sell signal is generated when the closing price of the current candle falls below the lowest low of the previous five daily candles.
Features:
Lookback Period: The indicator uses a lookback period of five candles to determine the highest high and lowest low.
Visual Signals: Buy signals are plotted as green "BUY" labels below the candles, while Sell signals are plotted as red "SELL" labels above the candles.
Debugging Plots: The highest high and lowest low of the previous five candles are plotted as blue and orange lines, respectively, to help verify the conditions for Buy and Sell signals.
Non-Repetitive Signals: The indicator ensures that once a Buy signal is given, no further Buy signals are generated until a Sell signal is given, and vice versa.
Usage:
Apply the indicator to your daily forex chart in TradingView.
Observe the plotted Buy and Sell signals to identify potential entry and exit points.
Use the debugging plots to ensure the conditions for the signals are being met correctly.
This indicator provides a straightforward approach to trading based on recent price action, helping traders capitalize on potential breakout and breakdown opportunities.
[A618] Liquidity Levels Based OBV SR with KAMAWe all know OBV plays a very important role in figuring out price volume divergences and it can help anyone analyse the directivity force of the market and has a very good tradeoff if applied correctly
In this Experiment i have derived liquidity levels for OBV using volume jumps inside the market
A volume jump is classified as:
Good Volume Jump = 1.618 times the Average Volume (WMA or 2pole ButterWorth's Filter of Volume)
Great Volume Jump = 2 times the Average Volume (WMA or 2pole ButterWorth's Filter of Volume)
Extreme Volume Jump = 3 times the Average Volume (WMA or 2pole ButterWorth's Filter of Volume)
So the horizontal levels which you see on the indicator (colored in red/ blue / gray lines) are the derived Liquidity Levels for OBV in the Market, these are the levels where OBV is most likely to perform a movement or come back
Also I have applied KAMA indicator on top of OBV for better Directive guidance, as of my experiments KAMA seems to be most stable and consistence of all the other moving averages,
KAMA's Length inculde:
KAMA - 8
KAMA - 34
KAMA - 200
Hope this Script help you guys!
Thanks to Tradingview for providing such an awesome platform
##Note for Credits ::
The Ehlers 2 pole butterworth Filter function is derived from @cheatcountry script ()

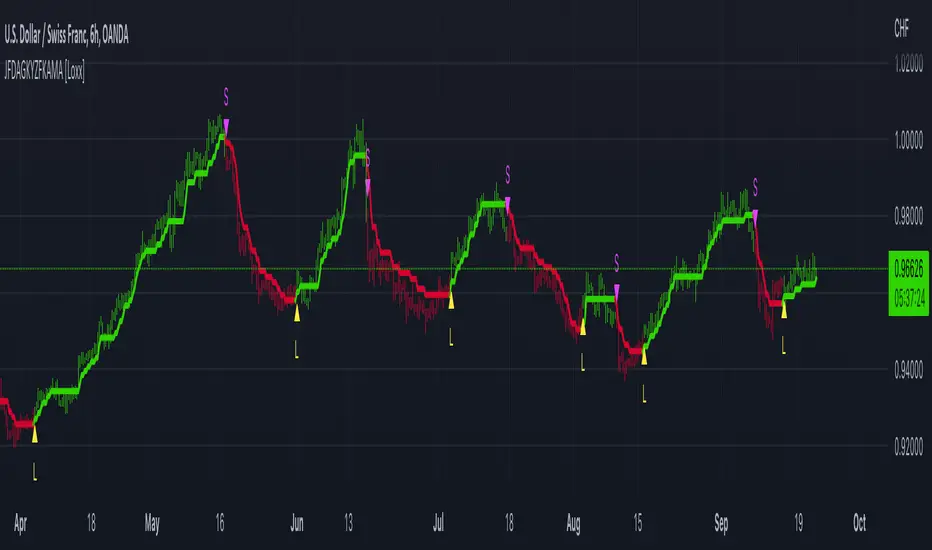
JFD-Adaptive, GKYZ-Filtered KAMA [Loxx]JFD-Adaptive, GKYZ-Filtered KAMA is a Kaufman Adaptive Moving Average with the option to make it Jurik Fractal Dimension Adaptive. This also includes a Garman-Klass-Yang-Zhang Historical Volatility Filter to reduce noise.
What is KAMA?
Developed by Perry Kaufman, Kaufman's Adaptive Moving Average ( KAMA ) is a moving average designed to account for market noise or volatility . KAMA will closely follow prices when the price swings are relatively small and the noise is low. KAMA will adjust when the price swings widen and follow prices from a greater distance. This trend-following indicator can be used to identify the overall trend, time turning points and filter price movements.
What is Jurik Fractal Dimension?
There is a weak and a strong way to measure the random quality of a time series.
The weak way is to use the random walk index ( RWI ). You can download it from the Omega web site. It makes the assumption that the market is moving randomly with an average distance D per move and proposes an amount the market should have changed over N bars of time. If the market has traveled less, then the action is considered random, otherwise it's considered trending.
The problem with this method is that taking the average distance is valid for a Normal (Gaussian) distribution of price activity. However, price action is rarely Normal, with large price jumps occuring much more frequently than a Normal distribution would expect. Consequently, big jumps throw the RWI way off, producing invalid results.
The strong way is to not make any assumption regarding the distribution of price changes and, instead, measure the fractal dimension of the time series. Fractal Dimension requires a lot of data to be accurate. If you are trading 30 minute bars, use a multi-chart where this indicator is running on 5 minute bars and you are trading on 30 minute bars.
What is Garman-Klass-Yang-Zhang Historical Volatility?
Yang and Zhang derived an extension to the Garman Klass historical volatility estimator that allows for opening jumps. It assumes Brownian motion with zero drift. This is currently the preferred version of open-high-low-close volatility estimator for zero drift and has an efficiency of 8 times the classic close-to-close estimator. Note that when the drift is nonzero, but instead relative large to the volatility , this estimator will tend to overestimate the volatility . The Garman-Klass-Yang-Zhang Historical Volatility calculation is as follows:
GKYZHV = sqrt((Z/n) * sum((log(open(k)/close( k-1 )))^2 + (0.5*(log(high(k)/low(k)))^2) - (2*log(2) - 1)*(log(close(k)/open(2:end)))^2))
Included
Alerts
Signals
Loxx's Expanded Source Types
Bar coloring
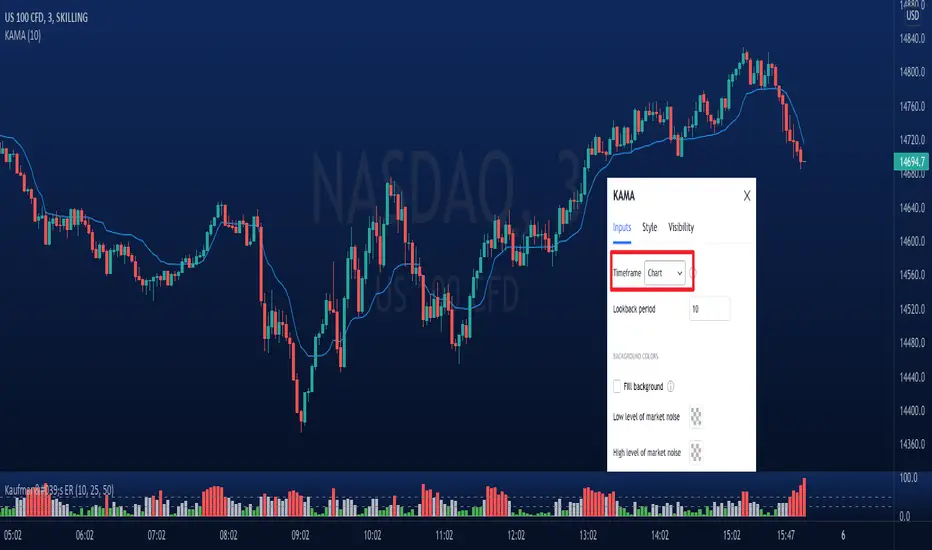
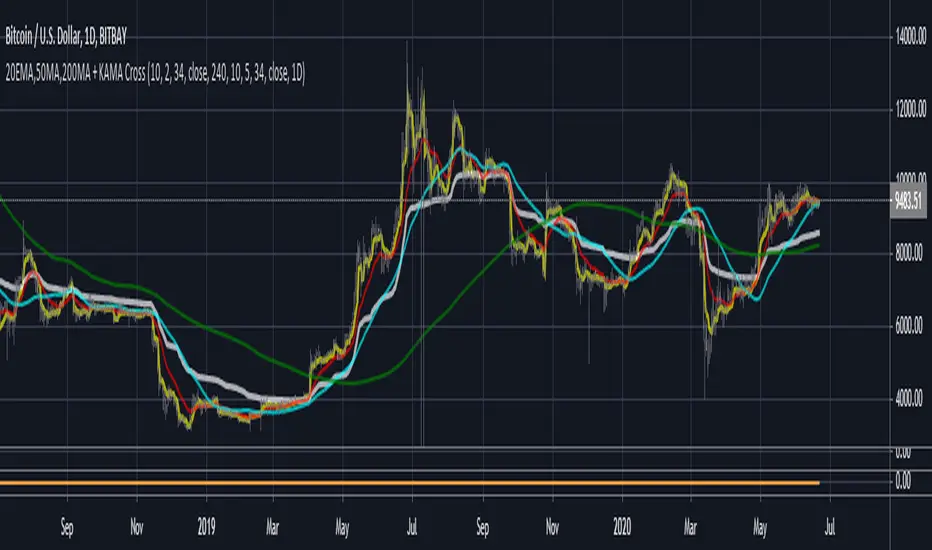
3MA'S + KAMA Trend (20EMA,50MA,200MA + KAMA Trend)This indicator, combines the traditional FOREX moving averages (20EMA, 50ma, 200ma) into a single indicator with
an adaptive moving average (AMA) taken from a user defined timeframe to show trend direction (by default, it plots
the daily 10/2/34 KAMA overlayed on any timeframe chart.
An AMA moves slowly when markets are sideways but swiftly during periods of volatility as a result it reacts much fast than
traditional options for moving average trends.
If the price is above the KAMA, trend is up. Below the KAMA, trend is down.
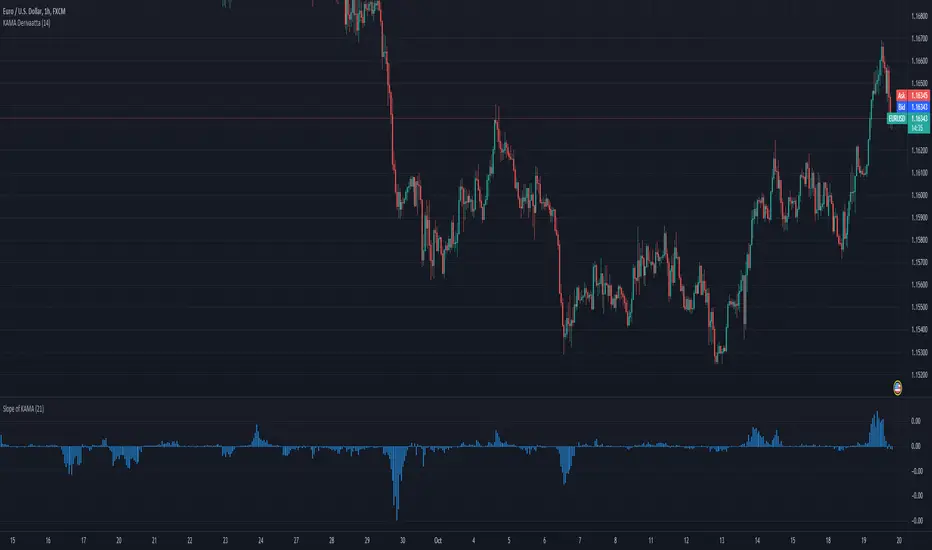
Slope of KAMAShows the slope of KAMA by comparing last bar KAMA value to current bar KAMA value. Very simple, yet very effective determining the trend or volatility of market. When slope is very small market can be in range, hence it can be used as volatility filter for trend traders.
Kama Trend Follower v1.0Kama Trend Follower is a Kaufman's Adaptive Moving Average ( KAMA ) based trend follower.

Koby's ZLEMA MACD and KAMA signalUsing zero lag ema for MACD line, and using KAMA for MACD's signal line.
Test version.
This has MACD and signal cross alert, and 0 line alert.

Adaptive Moving Average - Crossingshows and fills corssings of two KAMA. One with signal liength of 10, and the other 50.
