Liquidity Void Zone Detector [PhenLabs]📊 Liquidity Void Zone Detector
Version: PineScript™v6
📌 Description
The Liquidity Void Zone Detector is a sophisticated technical indicator designed to identify and visualize areas where price moved with abnormally low volume or rapid momentum, creating "voids" in market liquidity. These zones represent areas where insufficient trading activity occurred during price movement, often acting as magnets for future price action as the market seeks to fill these gaps.
Built on PineScript v6, this indicator employs a dual-detection methodology that analyzes both volume depletion patterns and price movement intensity relative to ATR. The revolutionary 3D visualization system uses three-layer polyline rendering with adaptive transparency and vertical offsets, creating genuine depth perception where low liquidity zones visually recede and high liquidity zones protrude forward. This makes critical market structure immediately apparent without cluttering your chart.
🚀 Points of Innovation
Dual detection algorithm combining volume threshold analysis and ATR-normalized price movement sensitivity for comprehensive void identification
Three-layer 3D visualization system with progressive transparency gradients (85%, 78%, 70%) and calculated vertical offsets for authentic depth perception
Intelligent state machine logic that tracks consecutive void bars and only renders zones meeting minimum qualification requirements
Dynamic strength scoring system (0-100 scale) that combines inverted volume ratios with movement intensity for accurate void characterization
Adaptive ATR-based spacing calculation that automatically adjusts 3D layering depth to match instrument volatility
Efficient memory management system supporting up to 100 simultaneous void visualizations with automatic array-based cleanup
🔧 Core Components
Volume Analysis Engine: Calculates rolling volume averages and compares current bar volume against dynamic thresholds to detect abnormally thin trading conditions
Price Movement Analyzer: Normalizes bar range against ATR to identify rapid price movements that indicate liquidity exhaustion regardless of instrument or timeframe
Void Tracking State Machine: Maintains persistent tracking of void start bars, price boundaries, consecutive bar counts, and cumulative strength across multiple bars
3D Polyline Renderer: Generates three-layer rectangular polylines with precise timestamp-to-bar index conversion and progressive offset calculations
Strength Calculation System: Combines volume component (inverted ratio capped at 100) with movement component (ATR intensity × 30) for comprehensive void scoring
🔥 Key Features
Automatic Void Detection: Continuously scans price action for low volume conditions or rapid movements, triggering void tracking when thresholds are exceeded
Real-Time Visualization: Creates 3D rectangular zones spanning from void initiation to termination, with color-coded depth indicating liquidity type
Adjustable Sensitivity: Configure volume threshold multiplier (0.1-2.0x), price movement sensitivity (0.5-5.0x), and minimum qualifying bars (1-10) for customized detection
Dual Color Coding: Separate visual treatment for low liquidity voids (receding red) and high liquidity zones (protruding green) based on 50-point strength threshold
Optional Compact Labels: Toggle LV (Low Volume) or HV (High Volume) circular labels at void centers for quick identification without visual clutter
Lookback Period Control: Adjust analysis window from 5 to 100 bars to match your trading timeframe and market volatility characteristics
Memory-Efficient Design: Automatically manages polyline and label arrays, deleting oldest elements when user-defined maximum is reached
Data Window Integration: Plots void detection binary, current strength score, and average volume for detailed analysis in TradingView's data window
🎨 Visualization
Three-Layer Depth System: Each void is rendered as three stacked polylines with progressive transparency (85%, 78%, 70%) and calculated vertical offsets creating authentic 3D appearance
Directional Depth Perception: Low liquidity zones recede with back layer most transparent; high liquidity zones protrude with front layer most transparent for instant visual differentiation
Adaptive Offset Spacing: Vertical separation between layers calculated as ATR(14) × 0.001, ensuring consistent 3D effect across different instruments and volatility regimes
Color Customization: Fully configurable base colors for both low liquidity zones (default: red with 80 transparency) and high liquidity zones (default: green with 80 transparency)
Minimal Chart Clutter: Closed polylines with matching line and fill colors create clean rectangular zones without unnecessary borders or visual noise
Background Highlight: Subtle yellow background (96% transparency) marks bars where void conditions are actively detected in real-time
Compact Labeling: Optional tiny circular labels with 60% transparent backgrounds positioned at void center points for quick reference
📖 Usage Guidelines
Detection Settings
Lookback Period: Default: 10 | Range: 5-100 | Number of bars analyzed for volume averaging and void detection. Lower values increase sensitivity to recent changes; higher values smooth detection across longer timeframes. Adjust based on your trading timeframe: short-term traders use 5-15, swing traders use 20-50, position traders use 50-100.
Volume Threshold: Default: 1.0 | Range: 0.1-2.0 (step 0.1) | Multiplier applied to average volume. Bars with volume below (average × threshold) trigger void conditions. Lower values detect only extreme volume depletion; higher values capture more moderate low-volume situations. Start with 1.0 and decrease to 0.5-0.7 for stricter detection.
Price Movement Sensitivity: Default: 1.5 | Range: 0.5-5.0 (step 0.1) | Multiplier for ATR-normalized price movement detection. Values above this threshold indicate rapid price changes suggesting liquidity voids. Increase to 2.0-3.0 for volatile instruments; decrease to 0.8-1.2 for ranging or low-volatility conditions.
Minimum Void Bars: Default: 10 | Range: 1-10 | Minimum consecutive bars exhibiting void conditions required before visualization is created. Filters out brief anomalies and ensures only sustained voids are displayed. Use 1-3 for scalping, 5-10 for intraday trading, 10+ for swing trading to match your time horizon.
Visual Settings
Low Liquidity Color: Default: Red (80% transparent) | Base color for zones where volume depletion or rapid movement indicates thin liquidity. These zones recede visually (back layer most transparent). Choose colors that contrast with your chart theme for optimal visibility.
High Liquidity Color: Default: Green (80% transparent) | Base color for zones with relatively higher liquidity compared to void threshold. These zones protrude visually (front layer most transparent). Ensure clear differentiation from low liquidity color.
Show Void Labels: Default: True | Toggle display of compact LV/HV labels at void centers. Disable for cleaner charts when trading; enable for analysis and review to quickly identify void types across your chart.
Max Visible Voids: Default: 50 | Range: 10-100 | Maximum number of void visualizations kept on chart. Each void uses 3 polylines, so setting of 50 maintains 150 total polylines. Higher values preserve more history but may impact performance on lower-end systems.
✅ Best Use Cases
Gap Fill Trading: Identify unfilled liquidity voids that price frequently returns to, providing high-probability retest and reversal opportunities when price approaches these zones
Breakout Validation: Distinguish genuine breakouts through established liquidity from false breaks into void zones that lack sustainable volume support
Support/Resistance Confluence: Layer void detection over key horizontal levels to validate structural integrity—levels within high liquidity zones are stronger than those in voids
Trend Continuation: Monitor for new void formation in trend direction as potential continuation zones where price may accelerate due to reduced resistance
Range Trading: Identify void zones within consolidation ranges that price tends to traverse quickly, helping to avoid getting caught in rapid moves through thin areas
Entry Timing: Wait for price to reach void boundaries rather than entering mid-void, as voids tend to be traversed quickly with limited profit-taking opportunities
⚠️ Limitations
Historical Pattern Indicator: Identifies past liquidity voids but cannot predict whether price will return to fill them or when filling might occur
No Volume on Forex: Indicator uses tick volume for forex pairs, which approximates but doesn't represent true trading volume, potentially affecting detection accuracy
Lagging Confirmation: Requires minimum consecutive bars (default 10) before void is visualized, meaning detection occurs after void formation begins
Trending Market Behavior: Strong trends driven by fundamental catalysts may create voids that remain unfilled for extended periods or permanently
Timeframe Dependency: Detection sensitivity varies significantly across timeframes; settings optimized for one timeframe may not perform well on others
No Directional Bias: Indicator identifies liquidity characteristics but provides no predictive signal for price direction after void detection
Performance Considerations: Higher max visible void settings combined with small minimum void bars can generate numerous visualizations impacting chart rendering speed
💡 What Makes This Unique
Industry-First 3D Visualization: Unlike flat volume or liquidity indicators, the three-layer rendering with directional depth perception provides instant visual hierarchy of liquidity quality
Dual-Mode Detection: Combines both volume-based and movement-based detection methodologies, capturing voids that single-approach indicators miss
Intelligent Qualification System: State machine logic prevents premature visualization by requiring sustained void conditions, reducing false signals and chart clutter
ATR-Normalized Analysis: All detection thresholds adapt to instrument volatility, ensuring consistent performance across stocks, forex, crypto, and futures without constant recalibration
Transparency-Based Depth: Uses progressive transparency gradients rather than colors or patterns to create depth, maintaining visual clarity while conveying information hierarchy
Comprehensive Strength Metrics: 0-100 void strength calculation considers both the degree of volume depletion and the magnitude of price movement for nuanced zone characterization
🔬 How It Works
Phase 1: Real-Time Detection
On each bar close, the indicator calculates average volume over the lookback period and compares current bar volume against the volume threshold multiplier
Simultaneously measures current bar's high-low range and normalizes it against ATR, comparing the result to price movement sensitivity parameter
If either volume falls below threshold OR movement exceeds sensitivity threshold, the bar is flagged as exhibiting void characteristics
Phase 2: Void Tracking & Qualification
When void conditions first appear, state machine initializes tracking variables: start bar index, initial top/bottom prices, consecutive bar counter, and cumulative strength accumulator
Each subsequent bar with void conditions extends the tracking, updating price boundaries to envelope all bars and accumulating strength scores
When void conditions cease, system checks if consecutive bar count meets minimum threshold; if yes, proceeds to visualization; if no, discards the tracking and resets
Phase 3: 3D Visualization Construction
Calculates average void strength by dividing cumulative strength by number of bars, then determines if void is low liquidity (>50 strength) or high liquidity (≤50 strength)
Generates three polyline layers spanning from start bar to end bar and from top price to bottom price, each with calculated vertical offset based on ATR
Applies progressive transparency (85%, 78%, 70%) with layer ordering creating recession effect for low liquidity zones and protrusion effect for high liquidity zones
Creates optional center label and pushes all visual elements into arrays for memory management
Phase 4: Memory Management & Display
Continuously monitors polyline array size (each void creates 3 polylines); when total exceeds max visible voids × 3, deletes oldest polylines via array.shift()
Similarly manages label array, removing oldest labels when count exceeds maximum to prevent memory accumulation over extended chart history
Plots diagnostic data to TradingView’s data window (void detection binary, current strength, average volume) for detailed analysis without cluttering main chart
💡 Note:
This indicator is designed to enhance your market structure analysis by revealing liquidity characteristics that aren’t visible through standard price and volume displays. For best results, combine void detection with your existing support/resistance analysis, trend identification, and risk management framework. Liquidity voids are descriptive of past market behavior and should inform positioning decisions rather than serve as standalone entry/exit signals. Experiment with detection parameters across different timeframes to find settings that align with your trading style and instrument characteristics.
Cari dalam skrip untuk "liquidity"

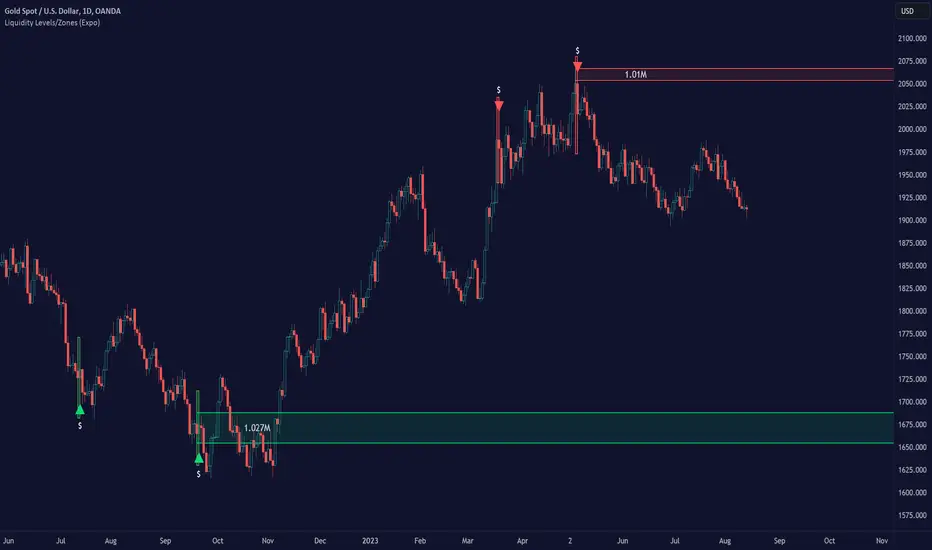
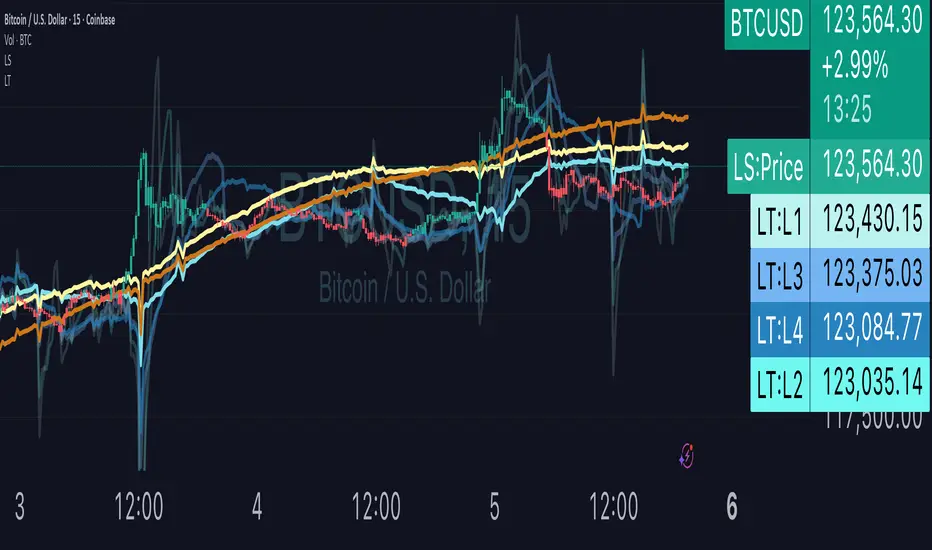
Liquidity Levels/Zones (Expo)Liquidity Levels/Zones (Expo) automatically identifies and displays key liquidity levels/zones.
Liquidity describes the extent to which an asset can be bought and sold quickly, without affecting the price. It is a measure of how many buyers and sellers are present, and whether transactions can take place easily.
Levels/Zones are displayed where there is a significant level of trading activity and when there is both high supply and demand for an asset, security, or contract. These levels can leave clues for future price behavior and act as support/resistance zones. The trading activity can confirm the existence, or a continuation, of a trend or a trend reversal.
The user can modify the settings so that short- term, medium-term, and long- term liquidity levels/zones are displayed.
The indicator can be used standalone or as a part of your current trading strategy.
Real-time
No repainting
Works on any market
HOW TO USE
1. Use the indicator to identify key liquidity levels/zones.
2. Use the indicator to identify high trading activity.
3. Use the indicator to confirm the existence, or a continuation, of a trend or a trend reversal.
INDICATOR IN ACTION
1-hour chart
I hope you find this indicator useful , and please comment or contact me if you like the script or have any questions/suggestions for future improvements. Thanks!
I will continually work on this indicator, so please share your experience and feedback as it will enable me to make even better improvements. Thanks to everyone that has already contacted me regarding my scripts. Your feedback is valuable for future developments!
ACCESS THE INDICATOR
• Contact me on TradingView or use the links below
-----------------
Disclaimer
Copyright by Zeiierman.
The information contained in my scripts/indicators/ideas does not constitute financial advice or a solicitation to buy or sell any securities of any type. I will not accept liability for any loss or damage, including without limitation any loss of profit, which may arise directly or indirectly from the use of or reliance on such information.
All investments involve risk, and the past performance of a security, industry, sector, market, financial product, trading strategy, or individual’s trading does not guarantee future results or returns. Investors are fully responsible for any investment decisions they make. Such decisions should be based solely on an evaluation of their financial circumstances, investment objectives, risk tolerance, and liquidity needs.
My scripts/indicators/ideas are only for educational purposes!
Liquidity Depth [AlgoAlpha]OVERVIEW
This script visualizes market liquidity by identifying key price levels where significant volume has transacted. It highlights zones of high buying and selling interest, helping traders understand where liquidity is accumulating and how price may respond to these areas. By dynamically tracking volume at highs and lows, the script builds a real-time liquidity profile, making it a powerful tool for identifying potential support and resistance levels.
CONCEPTS
Liquidity depth analysis helps traders determine how price interacts with supply and demand at different levels. The script processes historical volume data to distinguish between high-liquidity and low-liquidity zones. It assigns transparency levels to plotted lines , ensuring that more relevant liquidity areas stand out visually. The script adds a profile to show the depth of liquidity (derived from historical volume data) for levels above and below the current price
FEATURES
Liquidity Levels: Tracks liquidity levels based on volume concentration at price high and lows.
Volume-Based Transparency: More significant liquidity levels are displayed with higher visibility, showing their significance.
Interpolation: interpolates the bullish and bearish liquidity depth at a user defined range away from the price, helping in comparing the liquidity amounts between bullish and bearish.
Depth Profile: Allows traders to visualize depth of liquidity in a more quantitative and clearer way than the liquidity levels/list]
USAGE
This indicator is best used to track liquidity levels and potential price reaction areas. Traders can adjust the Liquidity Lookback setting to analyze past liquidity levels over different historical periods. The Profile Resolution setting controls the granularity of liquidity depth visualization, with higher values providing more detail. The script can be applied across different timeframes, from intraday scalping to swing trading analysis. The plotted liquidity zones provide traders with insights into where price may encounter strong support, resistance, or potential liquidity-driven reversals.

Liquidity ImpulsesThis script essentially prints out any impulses in price movement indicating large buying/selling activity.
- Once a candle is determined to have an impulse of volume, the script will print a line of liquidity indicating where a lot of orders are.
- Once the liquidity is taken, the line will be deleted.
- This script works on lower timeframes for day trading as well as higher timeframes to get a clear bias on where price is headed. You can use this as a liquidity sweep or as a target for your trade
Enjoy!
Liquidity PoolsThis indicator displays liquidity based on swing highs and swing lows.
Since large liquidity rests above swing highs and below swing lows, the indicator can show swing highs and lows as well so that you can easily find where liquidity stays.
To determine swing high/low, left bars and right bars can be specified on inputs.
How to use this indicator?
You can use this indicator to;
observe how liquidity is used as the market moves.
watch which liquidity will be taken before the market moves and which liquidity will be targeted as the market progresses.
--------------------------------------
リクイディティ(Liquidity)を表示するインジケーターです。
リクイディティとはマネー、注文を指します。
わかりやすくするために、敢えて損切り注文と書いてみましょう。
大きなリクイディティ(損切り注文)はスイングハイの直上(買いのストップオーダー)、スイングローの直下(売りのストップオーダー)に控えています。インジケーターはスイングハイ・ローも同時に表示することができるため、リクイディティ(損切り注文)を容易に特定することが可能です。
使い方
・リクイディティ(損切り注文)が相場が動く中でどのように使われているのかを観察
・マーケットが動く前にどのリクイディ(損切り注文)を取り、トレンドが進展するにつれどのリクイディティ(損切り注文)をターゲットとするかを観察

Liquidity Grab ReversalIndicator looks for liquidity grab & reversal trades on any timeframe. These types of trades reveal how the big institutions, banks and hedge funds trade with big money. If they want their very big positions to be filled they need to find areas in chart where the majority of the money is sitting. Where is it? Where is the majority of orders placed? Right below supports or right above resistances, these orders are stoplosses or stop orders. So they need to push the price to these areas, take all the available stoplosses and trigger all the available stop orders in order to fill their positions and then push the price to the opposite side to make profit (and retail to lose).
Indicator looks for support or resistance (S/R) areas which are represented by dotted lines. This S/R areas are created by minimum of 2 pivot high/low (H/L). Every pivot H/L that creates the S/R area is marked with diamond label. This S/R area is called liquidity. After liquidity is created, indicator looks for liquidity grab (mostly represented by fast spike to this area) and then price should go fast to the opposite side. This behaviour can be called reversal after liquidity grab. If we want to participate in the reversal we can put stop order at high of the candle that grabbed the support/liquidity if it is long liquidity grab or at low of the candle that grabbed the resistance/liquidity if it is short liquidity grab. These entry points are represented by solid lines. Stoplosses can be placed to the local maximum/minimum created after liquidity grab - so if entry is at high of the liquidity grab candle then stoploss can be put at low of the structure created after liquidity grab.
In settings of the indicator you can set whether only long or only short liquidity grabs are shown. Long liquidity grabs are green and short ones are red.
You can adjust core settings of the indicator:
Liquidity H/Ls Look Back/Forward Period: For PIVOT HIGH there has to be X (by default 1) candle/s lower to the left and X (by default 1) candle/s lower to the right and vice versa for PIVOT LOW,
Liquidity Grab by Close or High/Low.

Liquidity Trap Zones [PhenLabs]📊 Liquidity Trap Zones
Version: PineScript™ v6
📌 Description
The goal of the Liquidity Trap Zones indicator is to try and help traders identify areas where market liquidity appears abundant but is actually thin or artificial, helping traders avoid potential fake outs and false breakouts. This advanced indicator analyzes the relationship between price wicks and volume to detect “mirage” zones where large price movements occur on low volume, indicating potential liquidity traps.
By highlighting these deceptive zones on your charts, the indicator helps traders recognize where institutional players might be creating artificial liquidity to trap retail traders. This enables more informed decision-making and better risk management when approaching key price levels.
🚀 Points of Innovation
Mirage Score Algorithm: Proprietary calculation that normalizes wick size relative to volume and average bar size
Dynamic Zone Creation: Automatically generates gradient-filled zones at trap locations with ATR-based sizing
Intelligent Zone Management: Maintains clean charts by limiting displayed zones and auto-updating existing ones
Scale-Invariant Design: Works across all assets and timeframes with intelligent normalization
Real-Time Detection: Identifies trap zones as they form, not after the fact
Volume-Adjusted Analysis: Incorporates tick volume when available for more accurate detection
🔧 Core Components
Mirage Score Calculator: Analyzes the ratio of price wicks to volume, normalized by average bar size
ATR-Based Filter: Ensures only significant price movements are considered for trap zone creation
EMA Smoothing: Reduces noise in the mirage score for clearer signals
Gradient Zone Renderer: Creates visually distinct zones with multiple opacity levels for better visibility
🔥 Key Features
Real-Time Trap Detection: Identifies liquidity mirages as they develop during live trading
Dynamic Zone Sizing: Adjusts zone height based on current market volatility (ATR)
Smart Zone Management: Automatically maintains a clean chart by limiting the number of displayed zones
Customizable Sensitivity: Fine-tune detection parameters for different market conditions
Visual Clarity: Gradient-filled zones with distinct borders for easy identification
Status Line Display: Shows current mirage score and threshold for quick reference
🎨 Visualization
Gradient Trap Zones: Purple gradient boxes with darker centers indicating trap strength
Mirage Score Line: Orange line in status area showing current liquidity quality
Threshold Reference: Gray line showing your configured detection threshold
Extended Zone Display: Zones automatically extend forward as new bars form
📖 Usage Guidelines
Detection Settings
Smoothing Length (EMA) - Default: 10 - Range: 1-50 - Description: Controls responsiveness of mirage score. Lower values make detection more sensitive to recent price action
Mirage Threshold - Default: 5.0 - Range: 0.1-20.0 - Description: Score above this level triggers trap zone creation. Higher values reduce false positives but may miss subtle traps
Filter Settings
ATR Length for Range Filter - Default: 14 - Range: 1-50 - Description: Period for volatility calculation. Standard 14 works well for most timeframes
ATR Multiplier - Default: 1.0 - Range: 0.0-5.0 - Description: Minimum bar range as multiple of ATR. Higher values filter out smaller moves
Display Settings
Zone Height Multiplier - Default: 0.5 - Range: 0.1-2.0 - Description: Controls trap zone height relative to ATR. Adjust for visual preference
Max Trap Zones - Default: 5 - Range: 1-20 - Description: Maximum zones displayed before oldest are removed. Balance clarity vs. history
✅ Best Use Cases
Identifying potential fakeout levels before entering trades
Confirming support/resistance quality by checking for liquidity traps
Avoiding stop-loss placement in trap zones where sweeps are likely
Timing entries after trap zones are cleared
Scalping opportunities when price approaches known trap zones
⚠️ Limitations
Requires volume data - less effective on instruments without reliable volume
May generate false signals during news events or genuine volume spikes
Not a standalone system - combine with price action and other indicators
Zone creation is based on historical data - future price behavior not guaranteed
💡 What Makes This Unique
First indicator to specifically target liquidity mirages using wick-to-volume analysis
Proprietary normalization ensures consistent performance across all markets
Visual gradient design makes trap zones immediately recognizable
Combines multiple volatility and volume metrics for robust detection
🔬 How It Works
1. Wick Analysis: Calculates upper and lower wicks for each bar. Normalizes by average bar size to ensure scale independence
2. Mirage Score Calculation: Divides total wick size by volume to identify thin liquidity. Applies EMA smoothing to reduce noise. Scales result for optimal visibility
3. Zone Creation: Triggers when smoothed score crosses threshold. Creates gradient boxes centered on trap bar. Sizes zones based on current ATR for market-appropriate scaling
💡 Note: Liquidity Trap Zones works best when combined with traditional support/resistance analysis and volume profile indicators. The zones highlight areas of deceptive liquidity but should not be the sole factor in trading decisions. Always use proper risk management and confirm signals with price action.

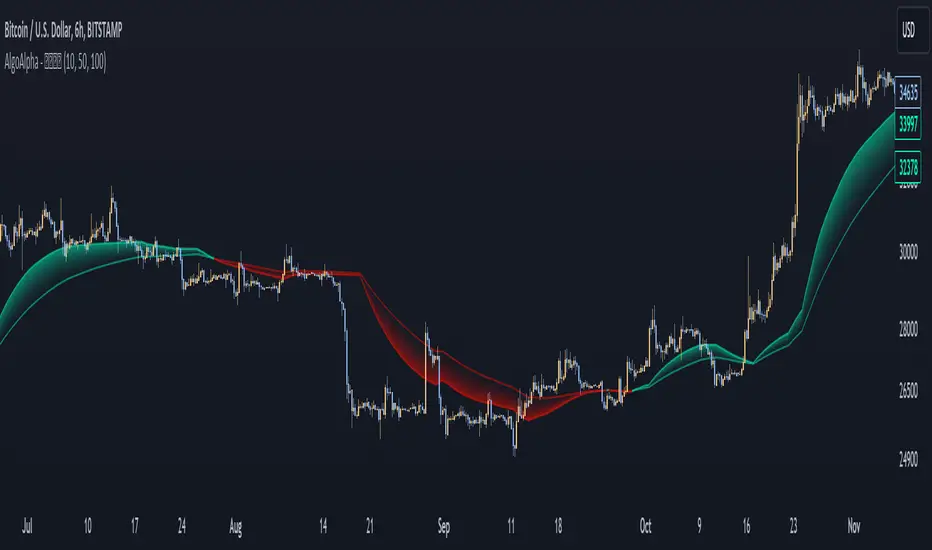
Liquidity Weighted Moving Averages [AlgoAlpha]Description:
The Liquidity Weighted Moving Averages by AlgoAlpha is a unique approach to identifying underlying trends in the market by looking at candle bars with the highest level of liquidity. This script offers a modified version of the classical MA crossover indicator that aims to be less noisy by using liquidity to determine the true fair value of price and where it should place more emphasis on when calculating the average.
Rationale:
It is common knowledge that liquidity makes it harder for market participants to move the price of assets, using this logic, we can determine the coincident liquidity of each bar by looking at the volume divided by the distance between the opening and closing price of that bar. If there is a higher volume but the opening and closing prices are near each other, this means that there was a high level of liquidity in that bar. We then use standard deviations to filter out high spikes of liquidity and record the closing prices on those bars. An average is then applied to these recorded prices only instead of taking the average of every single bar to avoid including outliers in the data processing.
Key features:
Customizable:
Fast Length - the period of the fast-moving average
Slow Length - the period of the slow-moving average
Outlier Threshold Length - the period of the outlier processing algorithm to detect spikes in liquidity
Significant Noise reduction from outliers:
⚪ Liquidity Spike Marker
Description:
The Liquidity Spike Marker indicator helps to identify abnormal bursts of liquidity in the market. The logic is based on comparing the product of the volume by the minimum candle price (Volume × Low) with the threshold value set by the user.
When the value exceeds the threshold, a white triangle appears under the candle, indicating a possible influx of liquidity. This can help traders pay attention to the key points where large participants may enter the market.
Features:
Displays a placemark (⚪ white triangle) when the threshold is exceeded.
Configurable parameter Volume × Low Threshold.
The ability to set an alert for automatic notification.
A lightweight and minimalistic tool without unnecessary elements.
Note: The indicator is not a trading recommendation. Use it in combination with your own trading system and other analysis methods.

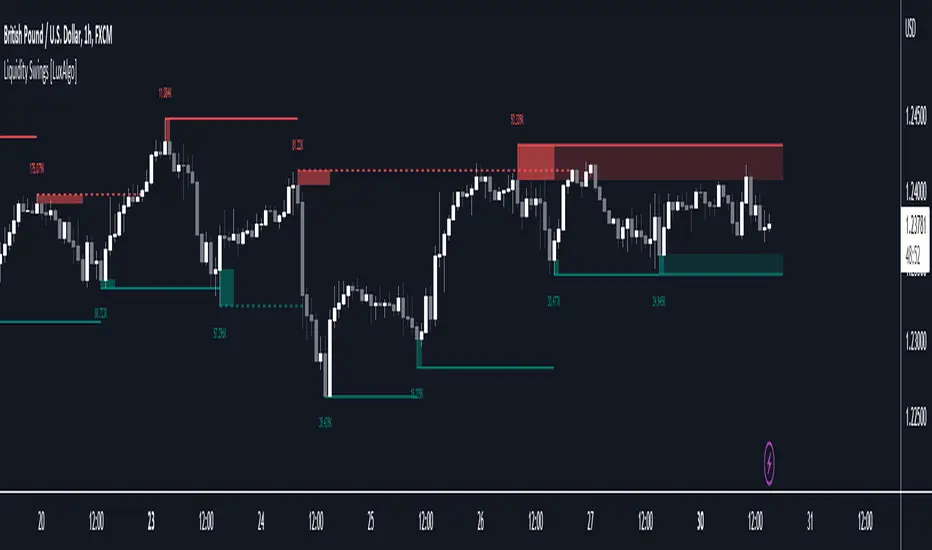
Liquidity Swings [LuxAlgo]The liquidity swings indicator highlights swing areas with existent trading activity. The number of times price revisited a swing area is highlighted by a zone delimiting the swing areas. Additionally, the accumulated volume within swing areas is highlighted by labels on the chart. An option to filter out swing areas with volume/counts not reaching a user-set threshold is also included.
This indicator by its very nature is not real-time and is meant for descriptive analysis alongside other components of the script. This is normal behavior for scripts detecting pivots as a part of a system and it is important you are aware the pivot labels are not designed to be traded in real-time themselves.
🔶 USAGE
The indicator can be used to highlight significant swing areas, these can be accumulation/distribution zones on lower timeframes and might play a role as future support or resistance.
Swing levels are also highlighted, when a swing level is broken it is displayed as a dashed line. A broken swing high is a bullish indication, while a broken swing low is a bearish indication.
Filtering swing areas by volume allows to only show significant swing areas with an higher degree of liquidity. These swing areas can be wider, highlighting higher volatility, or might have been visited by the price more frequently.
🔶 SETTINGS
Pivot Lookback : Lookback period used for the calculation of pivot points.
Swing Area : Determine how the swing area is calculated, "Wick Extremity" will use the range from price high to the maximum between price close/open in case of a swing high, and the range from price low to the minimum between price close/open in case of a swing low. "Full Range" will use the full candle range as swing area.
Intrabar Precision : Use intrabar data to calculate the accumulated volume within a swing area, this allows obtaining more precise results.
Filter Areas By : Determine how swing areas are filtered out, "Count" will filter out swing areas where price visited the area a number of time inferior to the user set threshold. "Volume" will filter out swing areas where the accumulated volume within the area is inferior to the user set threshold.
🔹 Style
Swing High : Show swing highs.
Swing Low : Show swing lows.
Label Size : Size of the labels on the chart.
Note that swing points are confirmed after Pivot Lookback bars, as such all elements are displayed retrospectively.
Liquidity Void Detector (Zeiierman)█ Overview
Liquidity Void Detector (Zeiierman) is an oscillator highlighting inefficient price displacements under low participation. It measures the most recent price move (standardized return) and amplifies it only when volume is below its own trend.
Positive readings ⇒ strong up-move on low volume → potential Buy-Side Imbalance (void below) that often refills.
Negative readings ⇒ strong down-move on low volume → potential Sell-Side Imbalance (void above) that often refills.
This tool provides a quantitative “void” proxy: when price travels far with unusually thin volume, the move is flagged as likely inefficient and prone to mean-reversion/mitigation.
█ How It Works
⚪ Volume Shock (Participation Filter)
Each bar, volume is compared to a rolling baseline. This is then z-scored.
// Volume Shock calculation
volTrend = ta.sma(volume, L)
vs = (volume > 0 and volTrend > 0) ? math.log(volume) - math.log(volTrend) : na
vsZ = zScore(vs, vzLen) // z-scored volume shock
lowVS = (vsZ <= vzThr) // low-volume condition
Bars with VolShock Z ≤ threshold are treated as low-volume (thin).
⚪ Prior Return Extremeness
The 1-bar log return is computed and z-scored.
// Prior return extremeness
r1 = math.log(close / close )
retZ = zScore(r1, rLen) // z-scored prior return
This shows whether the latest move is unusually large relative to recent history.
⚪ Void Oscillator
The oscillator is:
// Oscillator construction
weight = lowVS ? 1.0 : fadeNoLow
osc = retZ * weight
where Weight = 1 when volume is low, otherwise fades toward a user-set factor (0–1).
Osc > 0: up-move emphasized under low volume ⇒ Buy-Side Imbalance.
Osc < 0: down-move emphasized under low volume ⇒ Sell-Side Imbalance.
█ Why Use It
⚪ Targets Inefficient Moves
By filtering for low participation, the oscillator focuses on moves most likely driven by thin books/noise trading, which are statistically more likely to retrace.
⚪ Simple, Robust Logic
No need for tick data or order-book depth. It derives a practical void proxy from OHLCV, making it portable across assets and timeframes.
⚪ Complements Price-Action Tools
Use alongside FVG/imbalance zones, key levels, and volume profile to prioritize voids that carry the highest reversal probability.
█ How to Use
Sell-Side Imbalance = aggressive sell move (price goes down on low volume) → expect price to move up to fill it.
Buy-Side Imbalance = aggressive buy move (price goes up on low volume) → expect price to move down to fill it.
█ Settings
Volume Baseline Length — Bars for the volume trend used in VolShock. Larger = smoother baseline, fewer low-volume flags.
Vol Shock Z-Score Lookback — Bars to standardize VolShock; larger = smoother, fewer extremes.
Low-Volume Threshold (VolShock Z ≤) — Defines “thin participation.” Typical: −0.5 to −1.0.
Return Z-Score Lookback — Bars to standardize the 1-bar log return; larger = smoother “extremeness” measure.
Fade When Volume Not Low (0–1) — Weight applied when volume is not low. 0.00 = ignore non-low-volume bars entirely. 1.00 = treat volume condition as irrelevant (pure return extremeness).
Upper Threshold (Osc ≥) — Trigger for Sell-Side Imbalance (void below).
Lower Threshold (Osc ≤) — Trigger for Buy-Side Imbalance (void above).
-----------------
Disclaimer
The content provided in my scripts, indicators, ideas, algorithms, and systems is for educational and informational purposes only. It does not constitute financial advice, investment recommendations, or a solicitation to buy or sell any financial instruments. I will not accept liability for any loss or damage, including without limitation any loss of profit, which may arise directly or indirectly from the use of or reliance on such information.
All investments involve risk, and the past performance of a security, industry, sector, market, financial product, trading strategy, backtest, or individual's trading does not guarantee future results or returns. Investors are fully responsible for any investment decisions they make. Such decisions should be based solely on an evaluation of their financial circumstances, investment objectives, risk tolerance, and liquidity needs.

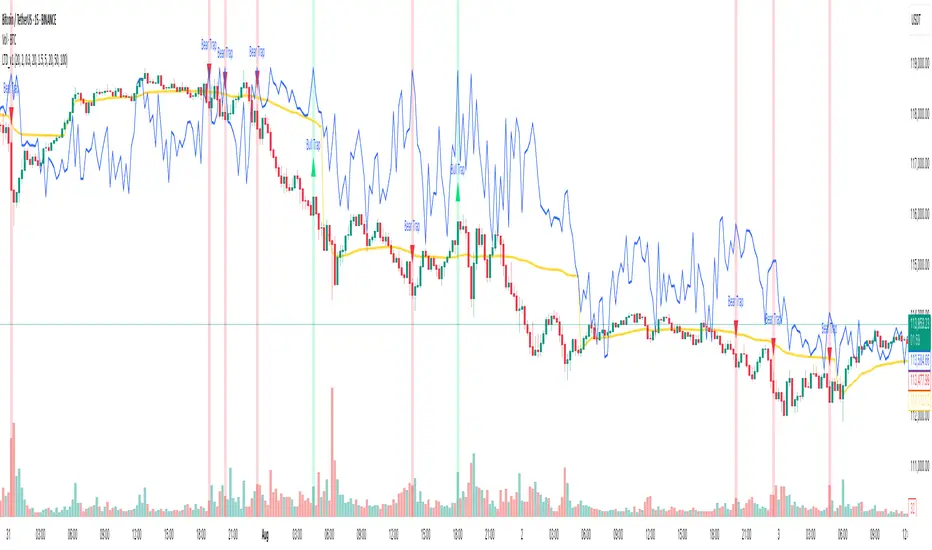
Liquidity TriggersKey Points
Liquidity Triggers indicate:
Where liquidity-derived support levels are.
Where liquidity-derived resistance levels are.
When a large price increase is approaching via the Rip Currents .
- When a large price decrease is approaching via the Dip Currents .
Summary
Liquidity Triggers are produced by measuring liquidity and determining where supportive liquidity and resistance-liquidity are. These trigger-levels designate price-points where breakouts, breakthroughs, and bounces are anticipated.
Liquidity Triggers are dynamic, and they constantly re-evaluate liquidity conditions to determine where the next group of sellers or buyers are that can fuel rapid changes in price movement, such as initiating a trend change or stalling price-action completely.
To use, simply apply to your chart and monitor for Supportive Liquidity Triggers (LTs that are below price) for bounces, and Resistance Liquidity Triggers (LTs that are above price) for rejections.
You can also set Alerts designed specifically around the Liquidity Triggers.
Examples
Example 1: A quick look at LT Resistances and Supports. When a LT is above spot, then it is considered a resistance. When LT is below spot, it is considered a support.
Example 2: LTs can indicate to us when an upcoming Rip Current (large price appreciation) or a Dip Current (large price depreciation) is starting.
Here is an example of a Rip Current:
And here is a Dip Current:
Details
Liquidity Triggers come with a default load-out that utilizes several pre-configured settings for quick and easy start-up.
Triggers
The default triggers are labeled LT-1 through LT-7, these correspond ` orders ` that describe which type of liquidity is monitored. The two groups of traders that are monitored are the ` Eager ` and the ` Organic `.
The default triggers use the Fibonacci sequence to adjust their orders in a standardized way.
Triggers 1, 2, 3, and 4 monitor the ` Eager ` traders (with default settings) while triggers 5, 6, and 7 monitor the ` Organic `traders.
Eager Triggers represent profit-takers and dip-buyers .
When the Eager Triggers are above the price, they are ` selling the rip `, and when the Eager Triggers are below price, they are ` buying the dip `. These moments indicate growing pressure for a reversal. Eager triggers are any trigger with an order of 89 or less .
Organic Triggers represent value-seekers with long-term goals. When they are below price, they are areas of support and tend to fuel bounces, while when organic triggers that are above price are areas of resistance and often provoke rejections. Organic triggers are any trigger with an order of 90 or more .
Here's an example showing the faint eager liquidity triggers above spot, indicating profit-taking and below spot after a price-dip indicating dip-buying .
Customization
There are additional settings and configurations available to the Liquidity Triggers indicator that help customize your view of liquidity.
Smoothing
Smoothing can be applied to the triggers for a more peaceful showing. The smoothing options are:
None - Default.
Exponential-Moving Average (EMA) : Ideal for when you want the most recent activity to take higher priority.
Simple-Moving Average (SMA) : Ideal for when you want a smoother appearance but do not want to change the data too much.
Weighted-Moving Average (WMA): Ideal for when you want the smoothing to increase as the trigger order increases.
Modified-Moving Average (RMA): Produces the most smooth data.
Here is an example of how smoothing can change the appearance of LTs for easier analysis for when things get complicated:
Modifying the Default Load-out
The default loadout attempts to balance having a wide view of the data without bringing too many lines or values into the picture that might be too noisy, but these values can be added to customize and expand your view if desired.
The Fib load-out has the options with t he default load-out being .
Feel free to mix and match and explore which views you prefer when analyzing liquidity.
For example, for the extreme data-heads, you can add LDPM twice on the chart to get all of the orders displayed at once:
Liquidity Triggers - Granular Triggers
The granular trigger can be toggled on (default: off) for when candle-specific liquidity measurements desired. They can help identify which specific candles have eager and aggressive traders attempting to move spot: the further away the granular trigger is from the candle, the more force is being applied!
Manual LTs
If you’re not satisfied with the default options for triggers, you can set your own with the Manual Liquidity Triggers option.
Time-Based LTs
Time-based liquidity triggers give you a view of support and resistance triggers based off of the time chosen, rather than by an order. This allows you to construct “weekly Liquidity-Triggers” or “hourly Liquidity Triggers” to analyze and compare against.
Note: If the timeframes are too far apart, you might get an error. For instance, putting a 1-week reference LT onto a 30-second chart may not work.
Liquidity-Triggers Data-Table
With the `Display Liquidity Trigger Statuses and Values` option, you can place a data-table on the chart that will display the time-based triggers, their values, and if they are above (bearish) or below (bullish) spot.
Alerts
When you set alerts, you can determine which order is used for determining `Is bullish`, `Is Bearish`, `Has Become Bullish`, `Has Become Bearish` alerts in the LT Alert Order setting.
Several LT alerts are available to set:
Is Bullish / Bearish: these are designed to analyze conditions at the end of the candle and if spot is above the alert-trigger, then an alert is sent out that conditions are bullish, and if spot is below the alert-trigger, then an alert is sent out if conditions are bearish.
Has Become Bullish / Bearish: designed to analyze conditions at the start of a candle and determine if a change has occurred (a LT cross-over).
Suspected Rip Current: these are designed to alert you when a suspected upwards rip in price is underway, as characterized by all LT triggers moving rapidly down away from spot.
Suspected Dip Current: these are designed to alert you when a suspected downwards rip in price is underway, as characterized by all LT triggers moving rapidly up and above, away from spot.
These alerts can then be put into a webhook for external processing if desired.
Frequently Asked Questions
How can I gain access to LT?
Check out the Author's Instructions section below.
Where can I get more information?
Check out the Author's Instructions section below for how to obtain more information.
I tried to add LT to my chart but it produced an error.
Sometimes this happens but no worries. Just change the chart's interval to a different time and then back, the indicator should re-load. If that fails, try removing it completely and re-applying it.
Is it normal for LTs to have different values on different timeframes?
Yup! Think of each time-interval as a different "zoom" of the market. Imagine you are taking a picture of the ocean to figure out the direction of water movement. If you take the picture from space, you will see big general trends but if you take the photo from your boat in the harbor, you're going to get specific data about that area. That's how LT works!
The view of the liquidity depends on the "zoom-age" (the chart's interval) used when taking the photo.
I think there is an issue with the alerts - what should I do?
This is not ideal! If this happens, please reach out via the contact information in the Author's Instructions section below with the following details:
What symbol?
What timeframe?
Which alert?
When did the alert occur?
Can I attach the alerts to webhooks?
Yup! Be sure to check out TV's guide on webhooks ( T.V. Guide to Alerts ) for how to get started.
Does LT receive updates?
Yup! If a bug or issue is found, an update is pushed out. You will be notified when this occurs and it is highly recommended that you replace all charts with LT on them with the new version as the updates go out.
Liquidity Grab Zones | Flux Charts💎 GENERAL OVERVIEW
Introducing our new Liquidity Grab Zones Indicator! This indicator finds liquidity grabs in the current ticker and renders buyside & sellside liquidity grab zones. The retests and breakout of the zones are labeled, and you can set up alerts to get notified. For more information, please check the "HOW DOES IT WORK" section.
Features of the new Liquidity Grab Zones Indicator :
Renders Buyside & Sellside Liquidity Grab Zones
Retests & Breaks
Inverse Zones After Broken Feature
Alerts For All Features
Customizable Algorithm
Customizable Styles
🚩UNIQUENESS
Liquidity grabs can be useful when determining candles that have executed a lot of market orders, so you can plann your trades accordingly. This indicator lets you customize the pivot length and the wick-body ratio for liquidity grabs, provide retest & breakout labels, with customized styling and alerts.
📌 HOW DOES IT WORK ?
Liquidity grabs occur when one of the latest pivots has a false breakout. Then, if the wick to body ratio of the bar is higher than 0.5 (can be changed from the settings) a zone is plotted.
These zones usually indicate areas of high market interest where price action may reverse or accelerate. Identifying these zones can provide traders with critical levels for entering or exiting trades. A breakout of these zones generally mean strong movements are inbound, while failing breakouts make these zones act like support / resistance zones.
The indicator also reverses the type of the zone after an invalidation (can be turned off from the settings). This feature helps traders identify potential reversals more accurately.
The zone width is set to the area from the wick to the body of the candlestick, which can be seen here :
⚙️SETTINGS
1. General Configuration
Pivot Length -> This setting determines the range of the pivots. This means a candle has to have the highest / lowest wick of the previous X bars and the next X bars to become a high / low pivot.
Wick-Body Ratio -> After a pivot has a false breakout, the wick-body ratio of the latest candle is tested. The resulting ratio must be higher than this setting for it to be considered as a liquidity grab.
Zone Invalidation -> Select between Wick & Close price for Liquidity Grab Zone Invalidation.
Use these customizable settings to fine-tune the indicator according to your trading strategy and preferences.

Liquidity & inducementsHi all!
This indicator will show liquidity and inducements.
I will continue to try to add different types of liquidity and inducements, at this moment it contains 6 kinds of liquidity/inducement, they are:
• Grabs
• Big grabs
• Sweeps
• Turtle soups
• Equal highs/lows (liquidity and inducement)
• BSL & SSL
And 1 type of inducement:
• Retracement
This description will contain indicator examples of each individual liquidity and inducement. They will all be with the default settings.
Settings
First you will find settings for the market structure (BOS/CHoCH/CHoCH+). Select left and right pivot lengths and if the pivots should have a label or not.
This is the base foundation of this indicator and is possible with my library 'PriceAction' ().
You will see solid lines for break of structures (BOS), change of characters (CHoCH) and change of character plus (CHoCH+).
The pivots found will be the core of this indicator and will show you when the closing price breaks it. When that happens a break of structure (BOS) or a change of character (CHoCH or CHoCH+) will be created. The latest 5 pivots found within the current trend will be kept to take action on.
A break of structure is removed if an earlier pivot within the same trend is broken and the pivot's high price for a bullish trend or low price for a bearish trend is more extreme than the BOS pivot's price.
You are able to show the pivots that are used. "HH" (higher high), "HL" (higher low), "LH" (lower high), "LL" (lower low) and "H"/"L" (for pivots (high/low) when the trend has changed) are the labels used.
In the next section ('Liquidity ($$$)') you can select which types of liquidity you want to see. Note that 'Equal highs/lows' can also show inducement (more on that later).
In the section afterwards ('Inducement (IDM)') you can select if you want retracement inducements to be visible or not. More information on what they are later on.
The section for each individual liquidity and/or inducement can first contain a line named 'Pivot', where you can set the pivot lengths (first left, then right). Then you can set the 'Lookback', which means that the 'Lookback' number of past pivots is to take action on. After that you set the 'Timeframe' for the pivots used. That means that all available liquidity/inducements will be from your desired timeframe. Lastly you set the color of the liquidity/inducement (either a single color or bullish followed by bearish colors).
Lastly in the settings you can select the font sizes for the market structure and liquidity/inducements and what style liquidity/inducements lines will have. The sizes defaults to 7 and has a dotted line look.
Grabs
Liquidity grabs and liquidity sweeps are very similar. It all depends on if the current bar closed above/below the liquidity pivot and on if its a continuation or reversal. In a liquidity grab the bar that's above or below the liquidity pivot was not closed above or below it. Like this:
Or
The visual feedback will be a dotted line between the liquidity pivot and liquidity grab bar and a linefill between the high of the liquidity grab bar and the liquidity pivot.
Indicator example:
Big grabs
This is another 'grabs' option. You can show an additional grab if you want to. I suggest having this grab from a higher timeframe or with larger pivot lengths than the other grab.
The default is with the chart timeframe and 10/10 as pivot lengths.
Indicator example:
Sweeps
A liquidity sweep is like a liquidity grab but with the difference that price closes above/below and has a continuation instead of a reversal. If the liquidity pivot was at the same bar as a BOS/CHoCH/CHoCH+ it will not be a liquidity grab but a structural break instead.
They can look like this:
Indicator example;
Turtle soups
If only one candle is beyond the pivot it could be a liquidity grab. It's a grab if price didn't close beyond the liquidity pivot, if so it's invaliditet. Turtle soups are basically false breakouts that takes liquidity (is a false breakout from a pivot with the lengths and timeframe from the settings).
The turtle soup can have a confirmation in the terms of a change of character (CHoCH). You can enable this in the settings section for 'Turtle soups' through the 'Confirmation' checkbox (enabled by default). The turtle soup strategy usually comes with some sort of confirmation, in this case a CHoCH, but it can also be a market structure shift (MSS) or a change in state of delivery (CISD).
The addition of turtle soups is possible through my script 'Turtle soup' ().
The drawing will be a dotted line between the liquidity pivot and the last bar of the false breakout and a box from the start of the false breakout to the end of it.
Indicator example:
Equal highs/lows
Equal highs/lows will always show liquidity, but might also show inducement. Inducement will be shown on equal lows if the trend is bullish and on equal highs if it's bearish, like this:
Or
Equal highs can only be created if the second pivot is lower than the first one. Equal lows can only be created if the second pivot is higher than the first one. If that is not the case it could be a liquidity grab.
When equal highs or equal lows are find that produces inducement (equal lows in a bullish trend and equal highs in a bearish trend), the indicator will first display inducement and will show liquidity once traders are induced to enter the security. Stop loss placement, for liquidity, is 0.1 * the average true range (ATR, of length 14). They will look like this:
Only inducement:
Inducement and liquidity:
Indicator example:
Equal highs/lows inducements can not be triggered after a BOS/CHoCH/CHoCH+. They are cleared upon a structural break.
BSL & SSL
Buyside liquidity (BSL) and sellside liquidity (SSL) will be shown. A pivot that's been mitigated (touched by price) can never be BSL or SSL. The BSL/SSL available will be dynamic while price moves (work in Replay and lower timeframes that moves fast) and pick the latest pivot/s (with left and right lengths from the 'Market structure' section). You can define how many BSL/SSL you want to see with a default value of 1, meaning only 1 BSL and 1 SSL can be shown. If there is no unmitigated high (BSL) or low (SSL), no BSL/SSL will be available to show. If there are BSL/SSL available they're very useful to use as targets for entering a trade.
The will look like this when available;
And without BSL available:
Or
And without SSL available:
Note that the examples without BSL/SSL available could have liquidity available from previous price legs.
This can be an example of a BSL/SSL sequence:
First both buyside and sellside liquidity is available:
Then a new low appears and new sellside liquidity is available:
Then buyside liquidity is mitigated, so only sellside liquidity is available:
A new high pivot appears and buyside liquidity is available again:
Lastly a bearish CHoCH happens and sellside liquidity is mitigated, only buyside liquidity is available:
Retracement
The first retracement after a BOS/CHoCH/CHoCH+ is considered an inducement with the mission to get traders into a trade prematurely to get stopped out. This level is shown and look like this:
Or
A retracement inducement is removed when a new BOS/CHoCH/CHoCH+ appears and it's not triggered.
---------------------------
As of now there aren't any alerts available. You cannot use the Pine Screener from Tradingview either to see new liquidity/inducement events. I have this planned for future updates though.
I hope that this long description makes sense, let me know otherwise! Also let me know if you experience any bugs or have a feature request or just want to share good settings to use.
Best of trading luck!

Liquidity + Order-Flow Exhaustion (Smart-Money Logic)Liquidity + Order-Flow Exhaustion (Smart-Money Logic) is a visual tool that helps traders recognize where big market participants (“smart money”) are likely accumulating or distributing positions.
It identifies liquidity sweeps (stop-hunts above or below previous swing levels) and market structure shifts (reversals confirmed by price closing back in the opposite direction).
In simple terms, it shows where price “tricks” retail traders into chasing breakouts — right before reversing.
How it works:
The script scans recent highs and lows to find when price breaks them and quickly rejects — a sign of stop-hunts or liquidity grabs.
It then checks for a close back inside the previous range to confirm a possible Market Structure Shift (MSS).
When this happens, the chart highlights the zone and optionally adds directional labels (🔹 or 🔸) to mark where the liquidity event occurred.
How to read the signals:
🟢 Bullish shift — Price takes out a previous low, then closes higher. This often marks the end of a short-term down-move.
🔴 Bearish shift — Price sweeps a previous high, then closes lower. This often marks the end of a short-term rally.
Colored backgrounds and labels help visualize these key reversals directly on the chart.
How to use it:
Apply to any timeframe; 15-minute to 4-hour charts work best.
Use it to confirm reversals near major swing points or liquidity zones.
Combine with volume spikes, displacement candles, or Fair-Value Gaps (FVGs) for stronger confirmation.
What makes it original:
Simple, self-contained logic inspired by Smart Money Concepts (SMC).
Automatically detects both liquidity sweeps and the subsequent structural shift.
Visual and alert-ready design — perfect for discretionary or algorithmic strategies.
Tip: For even better accuracy, align detected shifts with higher-timeframe bias or VWAP deviations.

Liquidity Sweep Scanner [TradingFinder]🔵 Introduction
Recognizing how liquidity develops and how price reacts at key structural levels is critical for spotting precise, low-risk trade entries. The Liquidity Sweep Scanner is an advanced tool built to track market activity in real time, pinpoint liquidity sweeps, define reaction zones, and identify confirmation candles across multiple instruments and timeframes.
Key Advantages :
Detects high-probability reversal points with precision.
Combines liquidity analysis, market structure, and candle confirmation.
Works seamlessly across multiple symbols and timeframes.
This screener can scan a broad watchlist or analyze every timeframe of a single asset to find optimal reversal zones. It starts by identifying a clear swing point either a swing high or swing low and marking a reaction zone between that point and the candle’s highest or lowest open/close value.
If price revisits the zone, performs a liquidity grab, and forms an indecision candle such as a doji or narrow-bodied bar that closes inside the zone, this may indicate rejection of the level and a failed breakout attempt. Based on the surrounding market context, the screener then flags a potential bullish or bearish reversal and generates the appropriate Long or Short signal.
By focusing on precise entry timing, institutional order flow alignment, and filtering out false breakouts, the Liquidity Sweep Scanner zeroes in on the market areas where liquidity engineering, reversal potential, and inefficiency overlap. This makes it an indispensable tool for price action traders who rely on clear, high-quality setups without the distraction of market noise.
🔵 How to Use
The Liquidity Sweep Scanner continuously evaluates market structure, issuing alerts when a potential reversal setup emerges. It merges liquidity behavior, swing point analysis, and candle confirmation within predefined reaction zones.
To illustrate, imagine price forms a swing high or low, then later returns to that level. If it sweeps the prior extreme and produces a qualifying candle inside the reaction zone, the tool signals a possible reversal.
🟣 Long Setup
For a bullish scenario, the screener first spots a valid swing low a level often packed with sell-side liquidity. From there, it defines a reaction zone stretching from the swing low to the candle’s lowest open/close point.
If price retests this area with a wick dipping below the swing low but then closes back inside the zone, it signals absorption of selling pressure and rejection of further downside. The screener then awaits a confirmation candle commonly a doji or small-bodied bar closing inside the zone. Once these conditions align, a Long signal is logged and, if alerts are active, the trader receives a notification.
🟣 Short Setup
For bearish opportunities, the process begins by locating a valid swing high typically an area dense with buy-side liquidity. The reaction zone is drawn from the swing high to the candle’s highest open/close value.
When price retests this zone, sweeps above the swing high, and fails to close higher, it suggests a bull trap and waning upward momentum. The screener then requires a confirmation candle often a doji or rejection bar that closes back within the zone before confirming a Short signal.
These bearish setups help traders pinpoint likely institutional sell zones, offering a clear view of where price may reverse following a liquidity event.
🔵 Settings
🟣 Logical settings
Liquidity Swing period : You can set the swing detection period.
Market Structure Period :You can set the Pivot Period to determine the detection direction.
Max Swing Back Method : It is in two modes "All" and "Custom". If it is in "All" mode, it will check all swings, and if it is in "Custom" mode, it will check the swings to the extent you determine.
Max Swing Back : You can set the number of swings that will go back for checking.
Maximum Distance Between Swing and Signal : The maximum number of candles allowed between the swing point and the potential signal. The default value is 50, ensuring that only recent and relevant price reactions are considered valid.
🟣 Display Settings
Table on Chart : Allows users to choose the position of the signal dashboard either directly on the chart or below it, depending on their layout preference.
Number of Symbols : Enables users to control how many symbols are displayed in the screener table, from 10 to 20, adjustable in increments of 2 symbols for flexible screening depth.
Table Mode : This setting offers two layout styles for the signal table :
Basic : Mode displays symbols in a single column, using more vertical space.
Extended : Mode arranges symbols in pairs side-by-side, optimizing screen space with a more compact view.
Table Size : Lets you adjust the table’s visual size with options such as: auto, tiny, small, normal, large, huge.
Table Position : Sets the screen location of the table. Choose from 9 possible positions, combining vertical (top, middle, bottom) and horizontal (left, center, right) alignments.
🟣 Symbol Settings
Each of the 10 symbol slots comes with a full set of customizable parameters :
Symbol : Define or select the asset (e.g., XAUUSD, BTCUSD, EURUSD, etc.).
Timeframe : Set your desired timeframe for each symbol (e.g., 15, 60, 240, 1D).
🟣 Alert Settings
Alert : Enables alerts for LSS.
Message Frequency : Determines the frequency of alerts. Options include 'All' (every function call), 'Once Per Bar' (first call within the bar), and 'Once Per Bar Close' (final script execution of the real-time bar). Default is 'Once per Bar'.
Show Alert Time by Time Zone : Configures the time zone for alert messages. Default is 'UTC'.
🔵 Conclusion
The Liquidity Sweep Scanner equips traders with a precise, structured method for spotting high-probability reversals by merging liquidity sweeps, reaction zone mapping, and candle confirmation.
It not only filters out market noise but also highlights price areas where inefficiency and reversal potential align. Beyond identifying clean entry points, the tool includes a market direction detection feature allowing traders to quickly determine the prevailing trend and align their trades accordingly.
With adjustable settings such as the Pivot Period for fine-tuning detection direction, it adapts to various trading styles and timeframes, making it a powerful and versatile addition to any trader’s strategy.
Skrip berbayar

Liquidity mark-out indicator(by Lumiere)This indicator marks out every High that has a bullish candle followed by a bearish one, vice versa for lows.
Once the price reaches the marked-out liquidity, the line is removed automatically.
This indicator only shows the current liquidity of the time frame you are at.
(To get it look like the picture just chance the length to 30-50)
Key Features of the Liquidity Mark-Out Indicator:
🔹 Identifies Liquidity Zones – Marks highs and lows based on candlestick patterns.
🔹 Customizable Settings – Toggle highs/lows visibility 🎚️, adjust line colors 🎨, and set line length (bars) 📏.
🔹 Smart Clean-Up – Automatically removes swept levels (when price breaks through) for a clean chart 🧹.
🔹 Pattern-Based Detection –
Highs: Detects two-candle reversal patterns (🟢 bullish close → 🔴 bearish close).
Lows: Detects two-candle reversal patterns (🔴 bearish close → 🟢 bullish close).
🔹 Dynamic Lines – Projects liquidity levels forward (adjustable length) to track key zones 📈.
Perfect For Traders Looking To:
✅ Spot potential liquidity grabs 🎯
✅ Identify key support/resistance levels 🛑
✅ Clean up their chart from outdated levels 🖥️

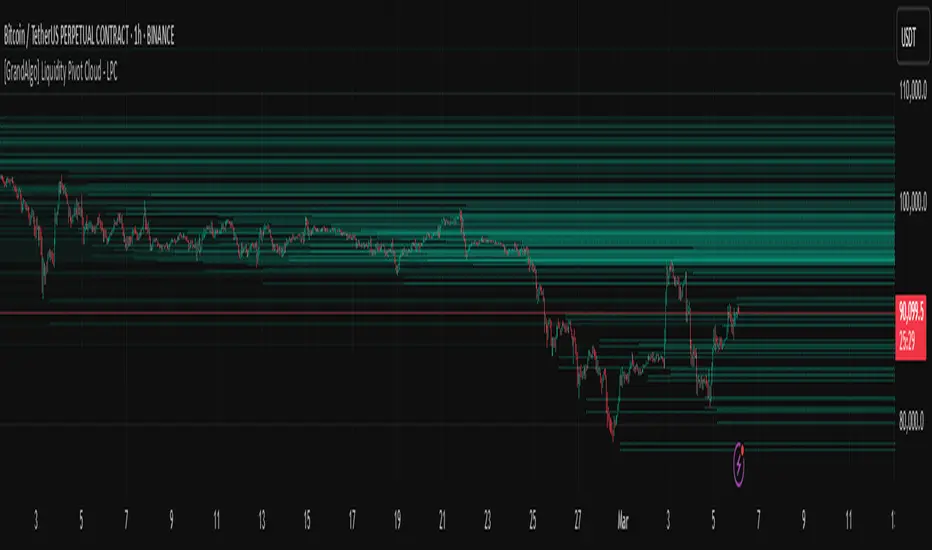
[GrandAlgo] Liquidity Pivot Cloud - LPCLiquidity Pivot Cloud (LPC) is a visualization tool that extends all pivot levels to the right, creating a structured liquidity map across the chart. Instead of treating pivot points as static levels, LPC transforms them into a dynamic cloud, highlighting key areas where price has historically reacted.
Key Features:
Extended Pivot Levels – Automatically stretches all pivot highs and lows, forming a continuous liquidity zone.
Clear Structure – Provides an organized view of price action, making it easy to identify reaction zones.
Dynamic Liquidity Map – Helps traders spot potential liquidity sweeps and areas of price absorption.
How to Use:
Identify Liquidity Zones – Areas with multiple overlapping pivots signal strong liquidity pools.
Look for Reactions – Price often consolidates, wicks, or reverses around extended pivot clouds.
Combine with Confluence – Use alongside Fair Value Gaps, Institutional Price Blocks, or Market Structure shifts for higher probability setups.
LPC aligns with smart money concepts by revealing key liquidity areas where stop hunts, liquidity grabs, and institutional activity are likely to occur. It helps traders see where price is likely to be drawn before a major move, making it a valuable tool for those trading liquidity-based strategies.
Liquidity Trap Detector (LTD)The Liquidity Trap Detector is an advanced trading tool designed to identify liquidity zones and potential traps set by institutional players. It provides traders with a comprehensive framework to align with smart money movements, helping them avoid common retail pitfalls such as bull and bear traps.
The indicator focuses on detecting liquidity sweeps, breaker blocks, and areas of institutional accumulation/distribution. It integrates multiple technical analysis methods to offer high-probability signals and insights into how liquidity dynamics unfold in the market.
Note : This indicator is not designed for beginners; it is intended for traders who already have a solid understanding of trading fundamentals. It is tailored for individuals who are familiar with concepts like liquidity, order blocks, and traps. Traders with at least 6 months to 1 year of trading experience will fully appreciate the power and potential of this indicator, as they will have the necessary knowledge to leverage its features effectively. Beginners may find it challenging to grasp the advanced concepts embedded in this tool.
Why Combine These Elements?
The components of the Liquidity Trap Detector are carefully chosen to address the core challenges of identifying institutional activity and liquidity traps. Here’s why each element is included and how they work together:
1. Order Blocks:
• Purpose: Identify zones where large institutional players accumulate or distribute positions.
• Role in the Indicator: These zones act as primary liquidity areas, where price is likely to reverse or consolidate due to significant order flow.
2. Breaker Blocks:
• Purpose: Highlight areas where liquidity has been swept, leading to potential price reversals or continuations.
• Role in the Indicator: Confirms whether a liquidity trap has occurred and provides actionable levels for entry or exit.
3. ATR-Based Volatility Zones:
• Purpose: Filter signals based on market volatility to ensure trades align with statistically significant price movements.
• Role in the Indicator: Defines dynamic support and resistance zones, improving the accuracy of signal generation.
4. Volume Delta:
• Purpose: Measure the imbalance between aggressive buyers and sellers, often indicating institutional activity.
• Role in the Indicator: Validates whether a liquidity trap is backed by smart money absorption or retail-driven momentum.
5. Trend Confirmation (EMA):
• Purpose: Align liquidity trap signals with the broader market trend, reducing false positives.
• Role in the Indicator: Ensures trades are executed in the direction of the prevailing trend.
What Makes It Unique?
1. Gen 1 Liquidity Zones and Traps:
• The indicator identifies Gen 1 Liquidity Zones, which represent the first areas where liquidity is accumulated or swept. While these zones often lead to reversals, they can sometimes fail, resulting in continuation moves. The indicator highlights these scenarios, helping traders adapt.
• For example, a bull trap identified in a Gen 1 Zone may see price move higher after an initial red candle, completing a secondary liquidity sweep before reversing.
2. Multi-Layer Signal Validation:
• Signals are only generated when liquidity, volume, trend, and volatility align. This ensures high-probability setups and reduces noise in choppy markets.
3. Dynamic Adaptability:
• ATR-based zones and volume delta filtering allow the indicator to adapt to different market conditions, from trending to range-bound environments.
4. Institutional Insights:
• By focusing on liquidity sweeps, order blocks, and volume imbalances, the indicator helps traders align with institutional strategies rather than retail behavior.
How It Works
The Liquidity Trap Detector uses a step-by-step process to identify and validate liquidity traps:
1. Identifying Liquidity Zones:
• Order Blocks: Mark key zones of institutional activity where price is likely to reverse.
• Breaker Blocks: Highlight areas where liquidity sweeps have occurred, signaling potential traps.
2. Filtering with Volatility (ATR):
• ATR defines dynamic support and resistance zones, ensuring signals are only generated near significant price levels.
3. Validating Traps with Volume Delta:
• Volume delta shows whether liquidity sweeps are backed by aggressive buying/selling from institutions, confirming the trap’s validity.
4. Aligning with Market Trends:
• EMA ensures signals align with the broader trend to reduce false positives.
5. Monitoring Gen 1 Liquidity Zones:
• The indicator highlights Gen 1 Liquidity Zones where price may initially reverse or sweep further before a true reversal. Traders are alerted to potential continuation scenarios if volume or momentum suggests unmet liquidity above/below the zone.
How to Use It
Buy Signal:
• Triggered when:
• Price sweeps below an order block and forms a breaker block, indicating a liquidity trap.
• Volume delta confirms aggressive selling absorption.
• ATR volatility zone supports the reversal.
• EMA confirms a bullish trend.
• Action: Enter a Buy trade and set:
• Stop Loss (SL): Below the order block.
• Take Profit (TP): Near the next resistance or liquidity zone.
Sell Signal:
• Triggered when:
• Price sweeps above an order block and forms a breaker block, indicating a liquidity trap.
• Volume delta confirms aggressive buying absorption.
• ATR volatility zone supports the reversal.
• EMA confirms a bearish trend.
• Action: Enter a Sell trade and set:
• SL: Above the order block.
• TP: Near the next support or liquidity zone.
Timeframes:
• Best suited for scalping and intraday trading on lower timeframes (5m, 15m, 1H).
• Can also be applied to swing trading on higher timeframes.
Example Scenarios:
1. Bull Trap in a Gen 1 Zone:
• Price sweeps above a resistance order block, forms a breaker block, and reverses sharply. However, if momentum persists, price may continue higher after a minor pullback. The indicator helps traders anticipate this by monitoring volume and trend shifts.
2. Bear Trap with Secondary Sweep:
• Price sweeps below a support order block but fails to reverse immediately, instead forming a secondary liquidity sweep before turning bullish. The indicator highlights both scenarios, allowing for flexible trade management.
Why Use It?
The Liquidity Trap Detector offers:
1. Precision: Combines multiple filters to identify institutional liquidity traps with high accuracy.
2. Adaptability: Works across trending and range-bound markets.
3. Smart Money Alignment: Helps traders avoid retail traps by focusing on liquidity sweeps and institutional behavior.
Liquidity Finder🔵 Introduction
The concept of "liquidity pool" or simply "liquidity" in technical analysis price action refers to areas on the price chart where stop losses accumulate, and the market, by reaching those areas and collecting liquidity (Stop Hunt), provides the necessary energy to move the price. This concept is prominent in the "ICT" and "Smart Money" styles. Imagine, as depicted below, the price is at a support level. The general trader mentality is that there is "demand" for the asset at this price level, and this demand will outweigh "supply" as before. So, it is likely that the price will increase. As a result, they start buying and place their stop loss below the support area.
Stop Hunt areas are essentially traders' "stop loss" levels. These are the liquidity that institutional and large traders need to fill their orders. Consequently, they penetrate the price below support areas or above resistance areas to touch their stop loss and fill their orders, and then the price trend reverses.
Cash zones are generally located under "Swings Low" and above "Swings High." More specifically, they can be categorized as support levels or resistance levels, above Double Top and Triple Top patterns, below Double Bottom and Triple Bottom patterns, above Bearish Trend lines, and below Bullish Trend lines.
Double Top and Triple Top :
Double Bottom and Triple Bottom :
Bullish Trend line and Bearish Trend line :
🔵 How to Use
To optimally use this indicator, you can adjust the settings according to the symbol, time frame, and your needs. These settings include the "sensitivity" of the "liquidity finder" function and the swing periods related to static and dynamic liquidity lines.
"Statics Liquidity Line Sensitivity" is a number between 0 and 0.4. Increasing this number decreases the sensitivity of the "Statics Liquidity Line Detection" function and increases the number of lines identified. The default value is 0.3.
"Dynamics Liquidity Line Sensitivity" is a number between 0.4 and 1.95. Increasing this number increases the sensitivity of the "Dynamics Liquidity Line Detection" function and decreases the number of lines identified. The default value is 1.
"Statics Period Pivot" is set to 8 by default. By changing this number, you can specify the period for the static liquidity line pivots.
"Dynamics Period Pivot" is set to 3 by default. By changing this number, you can specify the period for the dynamic liquidity line pivots.
🔵 Settings
Access to adjust the inputs of Static Dynamic Liquidity Line Sensitivity, Dynamics Liquidity Line Sensitivity, Statics Period Pivot, and Dynamics Period Pivot is possible from this section.
Additionally, you can enable or disable liquidity lines as needed using the buttons for "Show Statics High Liquidity Line," "Show Statics Low Liquidity Line," "Show Dynamics High Liquidity Line," and "Show Dynamics Low Liquidity Line."

Liquidity Levels/Voids (VP) [LuxAlgo]The Liquidity Levels/Voids (VP) is a script designed to detect liquidity voids & levels by measuring traded volume at all price levels on the market between two swing points and highlighting the distribution of the liquidity voids & levels at specific price levels.
🔶 USAGE
Liquidity is a fundamental market force that shapes the trajectory of assets.
The creation of a liquidity level comes as a result of an initial imbalance of supply/demand, which forms what we know as a swing high or swing low. As more players take positions in the market, these are levels that market participants will use as a historical reference to place their stops. When the levels are then re-tested, a decision will be made. The binary outcome here can be a breakout of the level or a reversal back to the mean.
Liquidity voids are sudden price changes that occur in the market when the price jumps from one level to another with little trading activity (low volume), creating an imbalance in price. The price tends to fill or retest the liquidity voids area, and traders understand at which price level institutional players have been active.
Liquidity voids are a valuable concept in trading, as they provide insights about where many orders were injected, creating this inefficiency in the market. The price tends to restore the balance.
🔶 SETTINGS
The script takes into account user-defined parameters and detects the liquidity voids based on them, where detailed usage for each user-defined input parameter in indicator settings is provided with the related input's tooltip.
🔹 Liquidity Levels / Voids
Liquidity Levels/Voids: Color customization option for Unfilled Liquidity Levels/Voids.
Detection Length: Lookback period used for the calculation of Swing Levels.
Threshold %: Threshold used for the calculation of the Liquidity Levels & Voids.
Sensitivity: Adjusts the number of levels between two swing points, as a result, the height of a level is determined, and then based on the above-given threshold the level is checked if it matches the liquidity level/void conditions.
Filled Liquidity Levels/Voids: Toggles the visibility of the Filled Liquidity Levels/Voids and color customization option for Filled Liquidity Levels/Voids.
🔹 Other Features
Swing Highs/Lows: Toggles the visibility of the Swing Levels, where tooltips present statistical information, such as price, price change, and cumulative volume between the two swing levels detected based on the detection length specified above, Coloring options to customize swing low and swing high label colors, and Size option to adjust the size of the labels.
🔹 Display Options
Mode: Controls the lookback length of detection and visualization.
# Bars: Lookback length customization, in case Mode is set to Present.
🔶 RELATED SCRIPTS
Liquidity-Voids-FVG
Buyside-Sellside-Liquidity
Swing-Volume-Profiles

Liquidity Hunter - FattyTradesThis indicator is used to automatically identify and plot two forms of liquidity that will be targeted by market makers.
The first form of liquidity is based on multi-time fame highs and lows. It plots 1H, 4H, D, W, & M liquidity on an intraday chart to make it easier to identify. I believe hat liquidity is what drives the market and the most common form of this liquidity can be identified through higher time frame highs and lows. You can use whatever method you prefer to determine which liquidity pool will be targeted. When the liquidity is purged, it will be shown as dotted lines. This should not be used as traditional support/resistance, but rather as targets for the market.
The second form of liquidity is in the form of imbalances or fair value gaps. You can select a higher time frame to be plotted along with the current time frame you're viewing to identify imbalances that will likely be targeted intraday. We know that higher time frame fair value gaps work equally well as targets for market makers. When a higher time frame FVG is broken into, it can also act as a very powerful form of support and resistance. By default, when a fair value gap has been mitigated it will be removed from the chart, however this can be disabled.
Between these two forms of market maker liquidity targets on the chart, it will be easier to formulate a thesis intraday to determine where the market will move. It can help minimize the amount of switching between higher time frames that needs to be done, allowing you to identify targets while trading on your favorite intraday time frame for optimal risk/reward.
In the near future, I will build in alerting mechanism to alert when liquidity on higher time frames as been purged/mitigated.

Liquidity Break Probability [PhenLabs]📊 Liquidity Break Probability
Version: PineScript™ v6
The Liquidity Break Probability indicator revolutionizes how traders approach liquidity levels by providing real-time probability calculations for level breaks. This advanced indicator combines sophisticated market analysis with machine learning inspired probability models to predict the likelihood of high/low breaks before they happen.
Unlike traditional liquidity indicators that simply draw lines, LBP analyzes market structure, volume profiles, momentum, volatility, and sentiment to generate dynamic break probabilities ranging from 5% to 95%. This gives traders unprecedented insight into which levels are most likely to hold or break, enabling more confident trading decisions.
🚀 Points of Innovation
Advanced 6-factor probability model weighing market structure, volatility, volume, momentum, patterns, and sentiment
Real-time probability updates that adjust as market conditions change
Intelligent trading style presets (Scalping, Day Trading, Swing Trading) with optimized parameters
Dynamic color-coded probability labels showing break likelihood percentages
Professional tiered input system - from quick setup to expert-level customization
Smart volume filtering that only highlights levels with significant institutional interest
🔧 Core Components
Market Structure Analysis: Evaluates trend alignment, level strength, and momentum buildup using EMA crossovers and price action
Volatility Engine: Incorporates ATR expansion, Bollinger Band positioning, and price distance calculations
Volume Profile System: Analyzes current volume strength, smart money proxies, and level creation volume ratios
Momentum Calculator: Combines RSI positioning, MACD strength, and momentum divergence detection
Pattern Recognition: Identifies reversal patterns (doji, hammer, engulfing) near key levels
Sentiment Analysis: Processes fear/greed indicators and market breadth measurements
🔥 Key Features
Dynamic Probability Labels: Real-time percentage displays showing break probability with color coding (red >70%, orange >50%, white <50%)
Trading Style Optimization: One-click presets automatically configure sensitivity and parameters for your trading timeframe
Professional Dashboard: Live market state monitoring with nearest level tracking and active level counts
Smart Alert System: Customizable proximity alerts and high-probability break notifications
Advanced Level Management: Intelligent line cleanup and historical analysis options
Volume-Validated Levels: Only displays levels backed by significant volume for institutional-grade analysis
🎨 Visualization
Recent Low Lines: Red lines marking validated support levels with probability percentages
Recent High Lines: Blue lines showing resistance zones with break likelihood indicators
Probability Labels: Color-coded percentage labels that update in real-time
Professional Dashboard: Customizable panel showing market state, active levels, and current price
Clean Display Modes: Toggle between active-only view for clean charts or historical view for analysis
📖 Usage Guidelines
Quick Setup
Trading Style Preset
Default: Day Trading
Options: Scalping, Day Trading, Swing Trading, Custom
Description: Automatically optimizes all parameters for your preferred trading timeframe and style
Show Break Probability %
Default: True
Description: Displays percentage labels next to each level showing break probability
Line Display
Default: Active Only
Options: Active Only, All Levels
Description: Choose between clean active-only view or comprehensive historical analysis
Level Detection Settings
Level Sensitivity
Default: 5
Range: 1-20
Description: Lower values show more levels (sensitive), higher values show fewer levels (selective)
Volume Filter Strength
Default: 2.0
Range: 0.5-5.0
Description: Controls minimum volume threshold for level validation
Advanced Probability Model
Market Trend Influence
Default: 25%
Range: 0-50%
Description: Weight given to overall market trend in probability calculations
Volume Influence
Default: 20%
Range: 0-50%
Description: Impact of volume analysis on break probability
✅ Best Use Cases
Identifying high-probability breakout setups before they occur
Determining optimal entry and exit points near key levels
Risk management through probability-based position sizing
Confluence trading when multiple high-probability levels align
Scalping opportunities at levels with low break probability
Swing trading setups using high-probability level breaks
⚠️ Limitations
Probability calculations are estimations based on historical patterns and current market conditions
High-probability setups do not guarantee successful trades - risk management is essential
Performance may vary significantly across different market conditions and asset classes
Requires understanding of support/resistance concepts and probability-based trading
Best used in conjunction with other analysis methods and proper risk management
💡 What Makes This Unique
Probability-Based Approach: First indicator to provide quantitative break probabilities rather than simple S/R lines
Multi-Factor Analysis: Combines 6 different market factors into a comprehensive probability model
Adaptive Intelligence: Probabilities update in real-time as market conditions change
Professional Interface: Tiered input system from beginner-friendly to expert-level customization
Institutional-Grade Filtering: Volume validation ensures only significant levels are displayed
🔬 How It Works
1. Level Detection:
Identifies pivot highs and lows using configurable sensitivity settings
Validates levels with volume analysis to ensure institutional significance
2. Probability Calculation:
Analyzes 6 key market factors: structure, volatility, volume, momentum, patterns, sentiment
Applies weighted scoring system based on user-defined factor importance
Generates probability score from 5% to 95% for each level
3. Real-Time Updates:
Continuously monitors price action and market conditions
Updates probability calculations as new data becomes available
Adjusts for level touches and changing market dynamics
💡 Note: This indicator works best on timeframes from 1-minute to 4-hour charts. For optimal results, combine with proper risk management and consider multiple timeframe analysis. The probability calculations are most accurate in trending markets with normal to high volatility conditions.
