Trading Sessions Low and HighVisualize and analyze different trading sessions (Tokyo, London, New York) on your charts.
Key Features:
Colored Session Zones: Displays colored rectangles to visually identify each active trading session
Smart High/Low Lines:
Draws horizontal lines at the highest and lowest points of each session
These lines automatically extend forward in time until a candle crosses them
Helps identify support/resistance levels created during each session
Detailed Session Information:
Range (difference between highest and lowest points)
Average price of the session
Open and close lines
Full Customization:
Choose the number of historical sessions to display (e.g., last 10, 20 sessions)
Line style and width for high/low lines
Enable/disable each element independently
Trading Benefits:
Identify liquidity zones created during each session
Spot key levels that continue to influence price after a session closes
Analyze volatility and price behavior across different sessions
Detect breakouts of important levels established during previous sessions
Cari dalam skrip untuk "low"

Session High/LowSession High Low
Trading Sessions
Forex Sessions (oder Futures Sessions, je nachdem, was du handelst)
Pine Script Indicator
Intraday Levels
Market Sessions
High Low Lines
Day Trading Tools

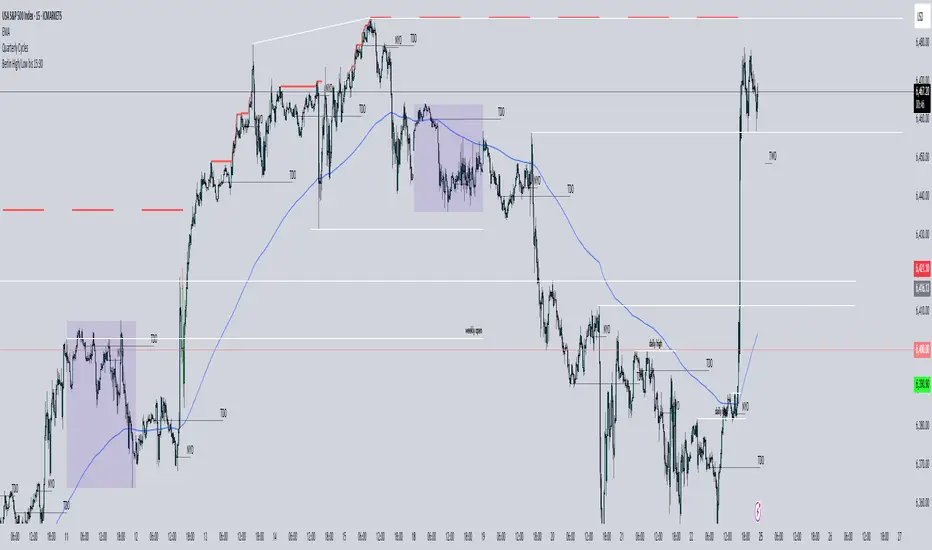
Previous Session Lines — High, Low, and 50% LevelsThis indicator automatically marks the previous completed session’s price range on your chart. You select a daily session window (for example: 09:30–16:00) and the script calculates:
* Previous Session High
* Previous Session Low
* Previous Session 50% (Midpoint)
When a session closes, the indicator draws all three levels on the chart and extends them forward for 24 hours, giving you clean, stable reference levels for the current trading day. Only the most recent session is shown; older sessions are automatically removed.
These levels are commonly used by day traders and swing traders to identify:
* Key support and resistance zones
* Breakout or rejection levels
* Market bias for the new session
* Areas where liquidity tends to accumulate
* Price reaction levels during overnight or intraday trading
Because the lines do not update in real time during the session, the levels remain static, accurate, and truly represent the completed session.
Settings users can adjust:
Session Settings:
* Start and end time of the session (repeats daily)
* Custom session name, which appears on the line labels
Line Appearance:
* Color
* Line thickness
* Line style (solid, dashed, dotted)
Label Appearance:
* Text size (tiny to huge)
* Text color automatically adjusts to contrast with the selected line color
Why this indicator is useful:
* Makes prior session structure immediately visible
* Helps identify high-probability reaction areas
* Shows only one session to reduce clutter
* Lines stay stable regardless of chart zoom or scaling
* Labels stay aligned at the right side of the chart
* Works on all timeframes, including extended hours and crypto charts
This tool is ideal for traders who rely on structured session analysis, including day traders, futures traders, forex traders, crypto traders, and anyone using session highs and lows to guide trading decisions.
This was developed to create an auto-mapping tool to comply with MrZinc's "London 50" strategy. You can learn more about that on his YouTube channel www.youtube.com
You can follow my YouTube trading channel here
www.youtube.com

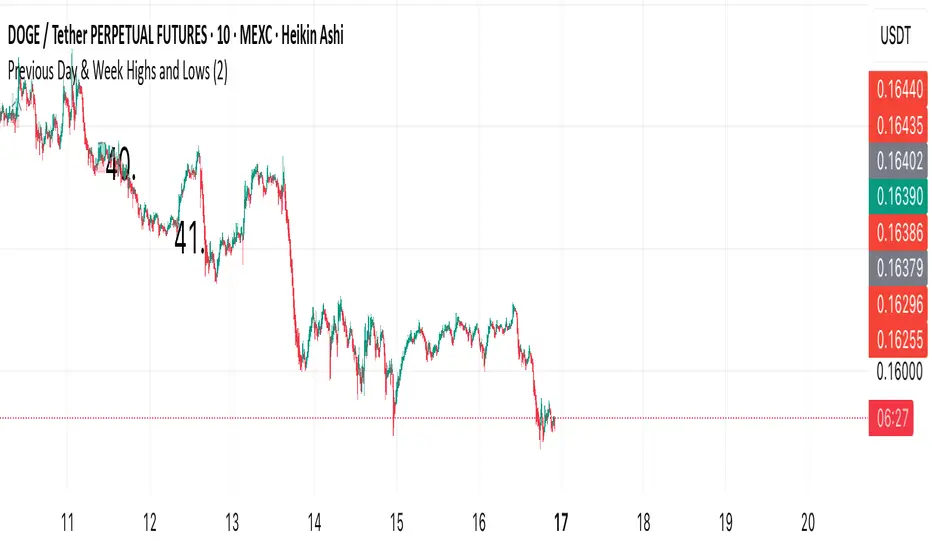
Previous Day & Week Highs and Lows 1.3Overlay indicator that plots horizontal lines for the previous day’s and previous week’s highs and lows. Lines extend until the next period starts, so you can see these levels throughout the current day or week.
The indicator detects new daily and weekly sessions and draws lines at the previous period’s high and low. Daily levels use green (high) and red (low); weekly levels use blue (high) and magenta (low). You can toggle daily/weekly independently, customize colors, and adjust line width. It works on intraday timeframes and helps identify support/resistance and track breakouts relative to prior periods.

Previous Day & Week Highs and LowsOverlay indicator that plots horizontal lines for the previous day’s and previous week’s highs and lows. Lines extend until the next period starts, so you can see these levels throughout the current day or week.
The indicator detects new daily and weekly sessions and draws lines at the previous period’s high and low. Daily levels use green (high) and red (low); weekly levels use blue (high) and magenta (low). You can toggle daily/weekly independently, customize colors, and adjust line width. It works on intraday timeframes and helps identify support/resistance and track breakouts relative to prior periods.
Asian High + London Low Rejection SignalsAsian High & London Low - High Accuracy signals - Enter the Buy if it rejects from London Low and Enter the Sell if it rejects from Asian High

London Killzone High/Low (live → lock & extend @07:59 UTC-5)London Killzone High/Low (live → lock & extend @07:59 UTC-5)London Killzone High/Low (live → lock & extend @07:59 UTC-5)

Tokyo Session High/Low (live → lock & extend @02:59 UTC-5)Tokyo Session High/Low (live → lock & extend @02:59 UTC-5)Tokyo Session High/Low (live → lock & extend @02:59 UTC-5)

NY KZ High/Low (live → lock @10:00 UTC-5)NY KZ High/Low (live → lock @10:00 UTC-5) NY KZ High/Low (live → lock @10:00 UTC-5)

High/Low from Set Period with LabelsMark high and low from a set period.
I use it to mark Overnight Low and High of FDAX instrument, to achieve that :
- you need to use candle chart
- you need to use regular trading hours ( to include overnight trades )
- you need to set that on M2 timeframe
- you need to set time begin : 17:30
- you need to set time end : 08:58
- when it will be drawn in 09:02, then let extend it via a hand and then you can disable
Issues :
- it will be visible after finished miminum period time :
-- after 2 minutes on M2 ( 9:02 )
-- after 5 minutes on M5 ( 9:05 )
etc ...

Session High and Lowmarks out previous NY session high/low, asian and london session high/low and updates automatically. Perfect indicator for overnight liquidity.

High-Low-Avg Plot (1D)This script aims to plot the High, Low, Average (of High+Low+Close) for past 14 days of an index/a stock to provide certain levels in trading

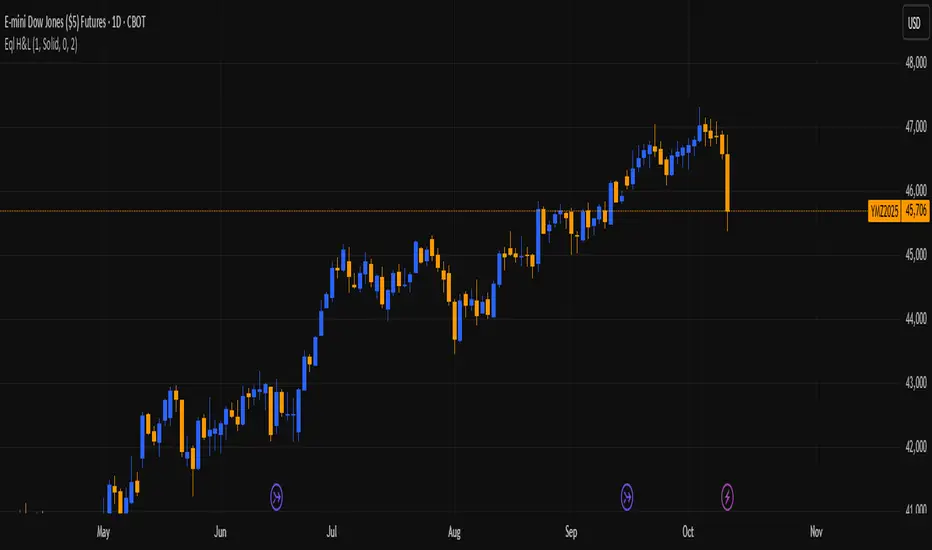
Equal Highs and Lows (Live)live eq highs and lows
gotta yap a little because shi wont let me publish it. talm about some "gosh thats very breif, tell your users a little more about your script"
eq highs and lows and idc if you use it or change the code to suit you.
ts shi is free to use and idgaf what you do with it really
Session First 5-Min High/LowHere's a professional description for your indicator:
Session First 5-Min High/Low Marker
This indicator automatically identifies and marks the high and low price levels established during the first 5 minutes of major trading sessions, helping traders identify key intraday support and resistance zones.
Key Features:
Tracks three major trading sessions in IST (Indian Standard Time):
Asian Session: 5:30 AM - 5:35 AM
London Session: 12:30 PM - 12:35 PM
New York Session: 5:30 PM - 5:35 PM
Draws horizontal lines at the highest and lowest prices reached during each session's opening 5-minute window
Color-coded for easy identification (Yellow for Asian, Blue for London, Red for New York)
Lines extend across the chart to help track price reactions throughout the day
Clean, minimal design with optional labels
Best Used For:
Identifying key intraday support and resistance levels
Session breakout trading strategies
Understanding institutional order flow at market opens
Works on 1-minute timeframe for precise tracking
Customizable Settings:
Toggle line extensions on/off
Adjust line width (1-5)
Change colors for each session
Show/hide session labels
Perfect for day traders and scalpers who trade around major session openings and want to identify high-probability support/resistance zones established during peak liquidity periods.
This description explains what the indicator does, its practical applications, and its key features in a way that's clear for TradingView users.RetryClaude can make mistakes. Please double-check responses.

RTH & ETH High/Low (Today & Prev)RTH and ETH High Low Indicator. This draws a line for the ETH and RTH highs and lows for todays session and yesterdays session. it allows you to toggle off any of the 8 potential levels as well as change the colour of the 8 levels. WIP

3 Red Heikin Ashi with Higher Lows3 Red Heikin Ashi with Higher Lows will give Buy signal when 3 Red Heikin Ashi with Higher Lows is formed

Cycle Low (RSI + StochRSI) – v5 John.KCycle Low (RSI + StochRSI) – v5 John.K
This tool is designed to detect potential cycle lows by combining RSI and Stochastic RSI oversold signals.
RSI Oversold + Cross → confirms momentum exhaustion
StochRSI Cross from Oversold → confirms short-term cycle turn
Score System (0–4) → evaluates confluence strength
Strict Mode → requires both RSI and StochRSI to be oversold for A+ signals
One-Bar Tolerance → allows RSI & StochRSI to cross within 1 bar
Anchor Option → optional reference level for cycle projection
Signals are plotted directly on the candles as green triangles (CL) when conditions are met.
Adjust thresholds (RSI, Stoch, Score) to control signal frequency.

Sessions Highs/LowsThis indicator plots the High and Low of the three main trading sessions:
Asia (20:00–03:00) – green lines
London (03:00–08:00) – blue lines
New York (08:00–13:00) – red lines
Features:
Levels update in real time during each session.
When a new session starts, the previous lines are deleted – only the latest active sessions remain visible.
Default session times are set to Asia (20:00–03:00), London (03:00–08:00), and New York (08:00–13:00), but you can adjust them to your own custom hours in the settings.
Colors can also be customized.
Use cases:
Quickly visualize session ranges.
Track session highs/lows for breakouts, fakeouts, and reactions around liquidity zones.

Renko Trend Indicator with High/LowRenko Trend Indicator with High/Low
Version: 1.0
Pine Script Version: 5
Type: Indicator
Overlay: Yes
Description
The Renko Trend Indicator with High/Low provides a visual representation of market trends using Renko-style calculations based on either a fixed brick size or ATR (Average True Range). It helps traders identify trend direction, potential reversals, and key support/resistance levels.
The indicator plots Renko-based trend signals directly on your chart and provides a colored Renko close line, making trend analysis simpler and clearer.
Features
Customizable Renko Brick Size
Fixed brick size or dynamic ATR-based bricks.
Step input for precise control over brick size.
Trend Identification
Detects uptrend and downtrend based on Renko logic.
Plots visual signals for trend direction:
Green triangle below bars → Uptrend
Red triangle above bars → Downtrend
Renko Close Line
Shows the Renko-adjusted closing price as a line.
Line color changes with trend (green for uptrend, red for downtrend).
Inputs
Name Type Default Description
Brick Size float 50 Size of Renko bricks (price units)
Use ATR for Brick Size? bool false Enable ATR-based dynamic brick sizing
ATR Period int 14 Number of periods for ATR calculation if enabled
How It Works
The indicator calculates Renko bricks using either a fixed size or ATR.
It maintains internal variables:
renko_close → Current Renko price
renko_high → Highest point of the current trend
renko_low → Lowest point of the current trend
trend → Current trend direction (1 for uptrend, -1 for downtrend)
last_extreme → Last extreme point to detect trend reversal
When price moves above or below the Renko threshold, the trend is updated.
Trend signals are plotted on the chart for easy visualization.
Plots
Plot Name Description Color
Up Trend Triangle below bar when trend is up Green
Down Trend Triangle above bar when trend is down Red
Renko Close Line connecting Renko-adjusted close prices Green (up) / Red (down)
Usage
Add the indicator to any chart with your preferred timeframe.
Configure the brick size or enable ATR-based bricks for dynamic calculation.
Observe the trend triangles and Renko line to identify trend direction and potential reversals.
Can be used in combination with other indicators or strategies for trading decisions.
Notes
This indicator is for analysis purposes only and does not place trades automatically.
ATR-based bricks adapt to market volatility, while fixed bricks provide a static reference.
Works best on liquid markets with regular price movements.
Example Chart
Green triangles below bars signal a buying trend.
Red triangles above bars signal a selling trend.
The colored Renko line shows the trend progression visually.
Author
DB
Pine Script Version: 5
License: MIT

Multi-Session High/Low Trackertable that shows rth eth and full weekly range high and low with range difference from high and low

High Minus LowThis indicator is a simple yet powerful tool for technical analysis. It measures the range of each candlestick by calculating the difference between its high and low, providing a direct visualization of market volatility.
Key Features:
Volatility at a Glance: The plot's height in the separate panel directly corresponds to the candle's trading range, allowing you to easily spot periods of high or low volatility.
Customizable Color: Easily change the line color to match your chart's theme and personal preferences.
Actionable Insights: Use this indicator to confirm periods of market consolidation before a breakout or to gauge the strength of a trend based on the expansion of candle ranges.

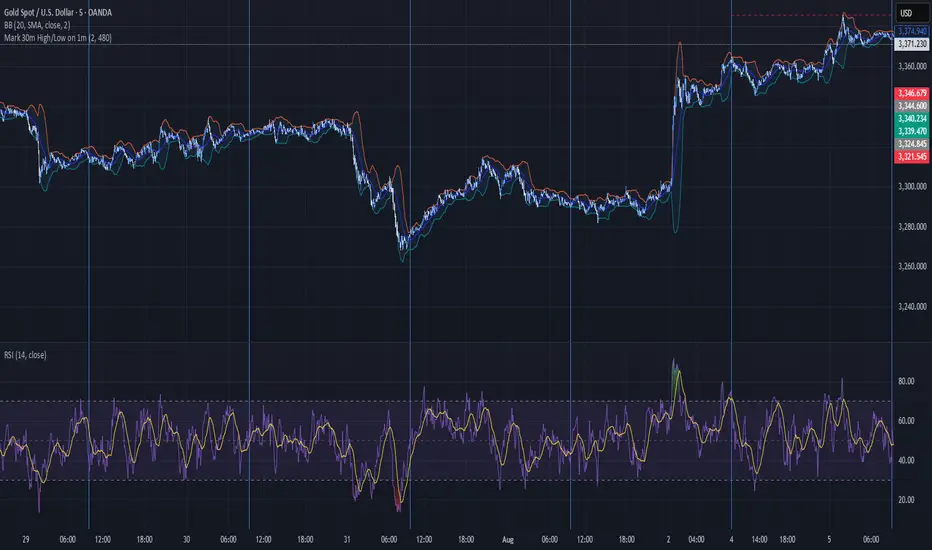
Mark 30m High/Low on 1m30 MIN HIGHS AND LOWS
Marked on the one minute chart.
High is marked with a green line.
Low is marked with a red line.
Berlin High/Low bis 15:30dayHigh := na(dayHigh) ? high : math.max(dayHigh, high)
dayLow := na(dayLow) ? low : math.min(dayLow, low)