RSI of MACD Strategy [Long only]This strategy uses the RSI on MACD indicator.
BUY
====
When RSI indicator crossing over 30 or 35 line and price above slow ema
Note: when the position already taken, you may reenter on the purple candle
Partial Exit
==========
Partial profit taking option is available in settings. If this is selected , 1/3 position exited when RSI indicator crossing down 80 line
Close
=====
When RSI indicator crossing below 15
Stop Loss
=========
I havent used hard stop loss in this strategy. Reason is , when price going down , indicator may go up ... so just wanted to ride along with indicator ...
Stop loss mentioned in the settings is used in calculation of how many units can be be purchased based on risk level
Tested with SPY and QQQ ETFs on hourly chart
Warning
=========
For the eductional purposes only ...
This is not a financial advise. please do your own research before taking any trading decission
Cari dalam skrip untuk "macd strategy"

Efficient PriceTrading The Movements That Matters
Inspired by the Price Volume Trend indicator the Efficient Price aim to create a better version of the price containing only the information a trend trader must need.
Calculation
This indicator use the Efficiency Ratio as a smoothing constant, it is calculated as follow :
ER = abs(change(close,length))/sum(abs(change(close)),length)
The goal of the Efficiency Ratio is to show if the market is trending or ranging.If ER is high then the market is considered to be trending, if ER is low then the market is considered to be ranging.
Then the Efficient Price is calculated :
EP = cum(change(close)*ER)
When the price is trending, the indicator will show movements of the price with unchanged volatility, but if the price is not trending then the indicator will flatten those movements.Think of this indicator as both a filter and a compressor and the Efficient Price as some kind of threshold.
The Efficient Price As Input For Indicators/Strategies
If the indicator show the movement of the trending price, it can be interesting to use it as input in order to reduce the number of false signals in a strategy.
We will test 2 MACD strategy provided by tradingview, one using the closing price (In Red) and one with the efficient price (In White) as input
with both the following parameters :
fastLength = 50
slowlength = 200
MACDLength = 20
length = 50
Where length is the parameter of the Efficient Price.A spread of 2 pips is used.
Without Efficient Price : 26.88% of profitability, 69 pips of profit.
With Efficient Price : 38.46% of profitability, 336 pips of profit.
The difference of profitability is of 11.58%, the strategy with the Efficient Price made few trades and its equity have a lower variance than the equity of the MACD strategy using closing price.
Smoothed Version
It is possible to smooth the indicator output by using the following code :
EP = cum(change(close,length)*ER)
Hope you enjoy
For any questions/demands feel free to pm me, i would be happy to help you

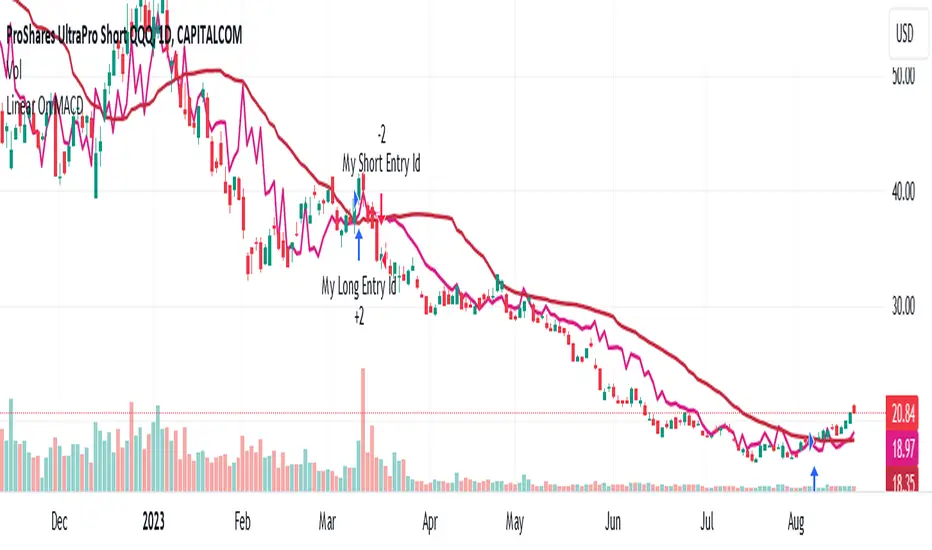
Linear On MACDUnlocking the Magic of Linear Regression in TradingView
In the ever-evolving world of financial markets, traders and investors seek effective tools to gauge price movements, make informed decisions, and achieve their financial goals. One such tool that has proven its worth over time is linear regression, a mathematical concept that has found its way into technical analysis and trading strategies. In this blog post, we will explore the magic behind linear regression, delve into its history, and understand how it's widely used as a technical indicator.
The Birth of Linear Regression: From Mathematics to Trading
Linear regression is a statistical method that aims to model the relationship between two variables by fitting a linear equation to observed data. The formula for a linear regression line is typically expressed as y = a + bx, where y is the dependent variable, x is the independent variable, a is the intercept, and b is the slope.
While the roots of linear regression trace back to the field of statistics, it didn't take long for traders and investors to recognize its potential in the financial world. By applying linear regression to historical price data, traders can identify trends, assess the relationship between variables, and even predict potential future price levels.
The Linear On MACD Strategy
Let's take a closer look at a powerful example of how linear regression is employed in a trading strategy right within TradingView. The "Linear On MACD" strategy harnesses the potential of linear regression in conjunction with the Moving Average Convergence Divergence (MACD) indicator. The goal of this strategy is to generate buy and sell signals based on the interactions between the predicted stock price and the MACD indicator.
Here's a breakdown of the strategy's components:
Calculation of Linear Regression: The strategy begins by calculating linear regression coefficients for the historical stock price based on volume. This helps predict potential future price levels.
Predicted Stock Price: The linear regression results are then used to plot the predicted stock price on the chart. This provides a visual representation of where the price could trend based on historical data.
Buy and Sell Signals: The strategy generates buy signals when certain conditions are met. These conditions include the predicted stock price being between the open and close prices, a rising MACD, and other factors that suggest a potential bullish trend. On the other hand, sell signals are generated based on MACD trends and predicted price levels.
Risk Management: The strategy also incorporates risk tolerance levels to determine entry and exit points. This ensures that traders take into account their risk appetite when making trading decisions.
Embracing the Magic of Linear Regression
As we explore the "Linear On MACD" strategy, we uncover the power of linear regression in aiding traders and investors. Linear regression, a mathematical marvel, seamlessly merges with technical analysis to provide insights into potential price movements. Its historical significance in statistics blends perfectly with the demands of modern financial markets.
Whether you're a seasoned trader or a curious investor, the Linear On MACD strategy exemplifies how a robust mathematical concept can be harnessed to make informed trading decisions. By embracing the magic of linear regression, you're tapping into a tool that continues to evolve alongside the financial world it empowers.
Disclaimer: The information provided in this blog post is for educational purposes only and does not constitute financial advice. Trading and investing carry risks, and it's important to conduct thorough research and consider seeking professional advice before making any trading decisions.
MACD Indicator BFThis is my MACD strategy but in indicator format so I can include alerts. The default settings are the same as in the strategy. The long and short conditions that the alerts are attached to are when the delta (usually illustrated as the histogram) crosses above or below the zero line respectively. There is one alert for long, one for short.

Ichimoku + RSI + MACD Strategy1. Relative Strength Index (RSI)
Overview:
The Relative Strength Index (RSI) is a momentum oscillator that measures the speed and change of price movements. It ranges from 0 to 100 and is typically used to identify overbought or oversold conditions in a market.
How to Use with Ichimoku:
Long Entry: Look for RSI to be above 30 (indicating it is not oversold) when the price is above the Ichimoku Cloud.
Short Entry: Look for RSI to be below 70 (indicating it is not overbought) when the price is below the Ichimoku Cloud.
2. Moving Average Convergence Divergence (MACD)
Overview:
The MACD is a trend-following momentum indicator that shows the relationship between two moving averages of a security’s price. It consists of the MACD line, signal line, and histogram.
How to Use with Ichimoku:
Long Entry: Enter a long position when the MACD line crosses above the signal line while the price is above the Ichimoku Cloud.
Short Entry: Enter a short position when the MACD line crosses below the signal line while the price is below the Ichimoku Cloud.
Combined Strategy Example
Here’s a brief outline of how to structure a trading strategy using Ichimoku, RSI, and MACD:
Long Entry Conditions:
Price is above the Ichimoku Cloud.
RSI is above 30.
MACD line crosses above the signal line.
Short Entry Conditions:
Price is below the Ichimoku Cloud.
RSI is below 70.
MACD line crosses below the signal line.
Exit Conditions:
Exit long when MACD line crosses below the signal line.
Exit short when MACD line crosses above the signal line.

Data Trader Stoch | RSI | MACD Strategy IndicatorImplementation of Data Trader's strategy, described in the youtube video, "Highly Profitable Stochastic + RSI + MACD Trading Strategy (Proven 100x)"
Also see Algovibes' video, "Highly Profitable Stochastic + RSI + MACD Trading Strategy? Testing Data Traders strategy in Python"
Note: Despite the claims, it generates barely, if any, signals, certainly in the crypto markets
If there are any mistakes, give feedback in the comments, and I'll fix
### Strategy Summary ###
# Long Signals #
Stoch K and D are oversold
RSI above midline
MACD above signal line
# Short Signals #
Stoch K and D are overbought
RSI below midline
MACD below signal line
# Stop loss and Take Profit #
Stop loss
Longs: below last swing low
Shorts: above last swing high
Take profit at 1.5x stop loss
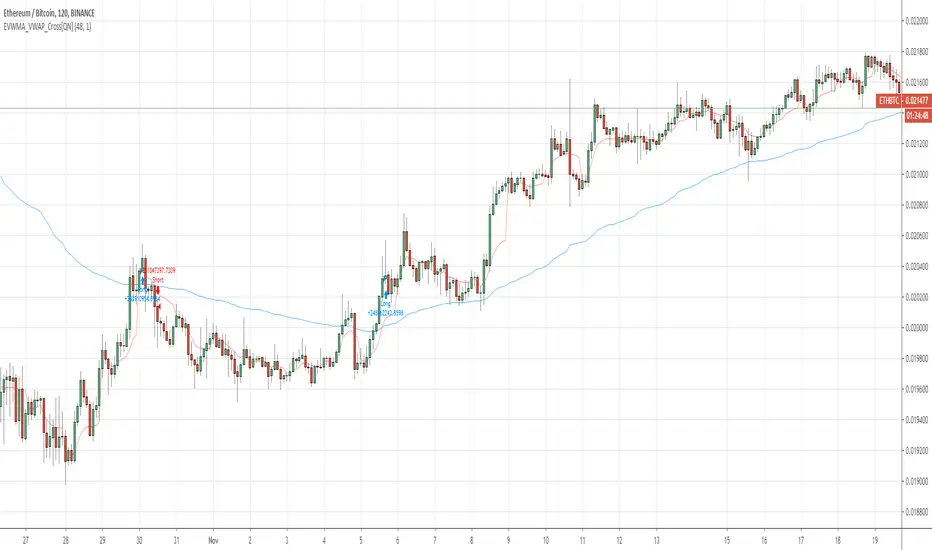
EVWMA VWAP Cross Strategy [QuantNomad]Continue to experiement with VWAP and EVWMA.
It seems that just simple crosses between VWAP and EVWMA can be pretty good signals. VWAP is a bit choppy so you can use VWAP smoothing input to smoth it a bit.
Here are few other strategies based on EVWMA:
EVWMA VWAP MACD Strategy
QuantNomad - EVWMA MACD Strategy
MACD + Stochastic, Double Strategy (by ChartArt)This strategy combines the classic stochastic strategy to buy when the stochastic is oversold with a classic MACD strategy to buy when the MACD histogram value goes above the zero line. Only difference to the classic stochastic is a default setting of 71 for overbought (classic setting 80) and 29 for oversold (classic setting 20).
Therefore this strategy goes long if the MACD histogram goes above zero and the stochastic indicator detects a oversold condition (value below 29). If the inverse logic is true, the strategy goes short (stochastic overbought condition with a value above 71 and the MACD histogram falling below the zero line value).
Please be aware that this pure double strategy using simply two classic indicators does not have any stop loss or take profit money management logic.
All trading involves high risk; past performance is not necessarily indicative of future results. Hypothetical or simulated performance results have certain inherent limitations. Unlike an actual performance record, simulated results do not represent actual trading. Also, since the trades have not actually been executed, the results may have under- or over-compensated for the impact, if any, of certain market factors, such as lack of liquidity. Simulated trading programs in general are also subject to the fact that they are designed with the benefit of hindsight. No representation is being made that any account will or is likely to achieve profits or losses similar to those shown.

MACD, backtest 2015+ only, cut in half and doubledThis is only a slight modification to the existing "MACD Strategy" strategy plugin!
found the default MACD strategy to be lacking, although impressive for its simplicity. I added "year>2014" to the IF buy/sell conditions so it will only backtest from 2015 and beyond ** .
I also had a problem with the standard MACD trading late, per se. To that end I modified the inputs for fast/slow/signal to double. Example: my defaults are 10, 21, 10 so I put 20, 42, 20 in. This has the effect of making a 30min interval the same as 1 hour at 10,21,10. So if you want to backtest at 4hr, you would set your time interval to 2hr on the main chart. This is a handy way to make shorter time periods more useful even regardless of strategy/testing, since you can view 15min with alot less noise but a better response.
Used on BTCCNY OKcoin, with the chart set at 45 min (so really 90min in the strategy) this gave me a percent profitable of 42% and a profit factor of 1.998 on 189 trades.
Personally, I like to set the length/signals to 30,63,30. Meaning you need to triple the time, it allows for much better use of shorter time periods and the backtests are remarkably profitable. (i.e. 15min chart view = 45min on script, 30min= 1.5hr on script)
** If you want more specific time periods you need to try plugging in different bar values: replace "year" with "n" and "2014" with "5500". The bars are based on unix time I believe so you will need to play around with the number for n, with n being the numbers of bars.

MACD + Supertrend + DEMA StrategySTRATEGY 📊 STRATEGY LOGIC:
Long Entry: When ALL of these occur simultaneously:
MACD histogram crosses above 0
Supertrend is bullish (green)
Short DEMA > Long DEMA
Short Entry: When ALL of these occur simultaneously:
MACD histogram crosses below 0
Supertrend is bearish (red)
Short DEMA < Long DEMA
Exits: Based on your TP/SL percentages from entry price
This follows the same clean structure as your MACD strategy but adds the alignment concept and proper risk management!

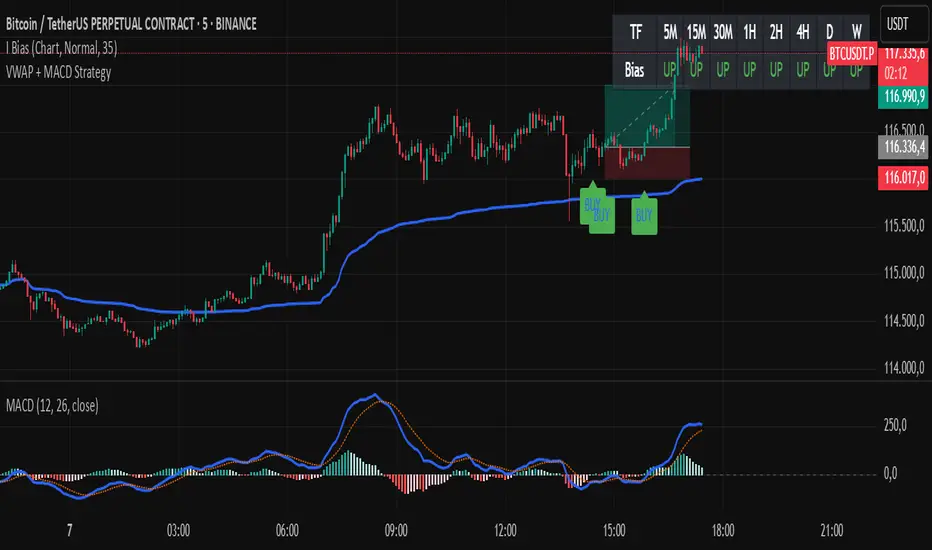
VWAP + MACD Estrategia MilloVWAP + MACD Strategy
This indicator combines the VWAP (Volume Weighted Average Price) with MACD (Moving Average Convergence Divergence) to create buy and sell signals. It helps traders identify potential market entry and exit points based on price action and momentum.
Conditions for Buy:
The price must be above the VWAP.
The MACD line crosses above the signal line (bullish crossover).
The MACD line is below the zero line.
Conditions for Sell:
The price must be below the VWAP.
The MACD line crosses below the signal line (bearish crossover).
The MACD line is above the zero line.
Features:
The VWAP line is plotted to represent the average price, weighted by volume, over a specified period.
Buy signals appear when all conditions are met for an upward price movement.
Sell signals appear when all conditions are met for a downward price movement.
MACD and Signal Line: The MACD helps to confirm momentum, while the signal line indicates possible trend reversals.
Customizable: You can modify the VWAP and MACD parameters to suit different trading strategies.
This strategy is designed for intraday traders and scalpers, aiming to catch quick movements while being aware of market momentum.
Feel free to share this description along with the code! Let me know if you need any adjustments or further explanations.
MACD classic strategy setupsetup for a classic MACD strategy with some filter to choose.
it keep the default setup of MACD because is the most popular.
it place the stop loss and take profit based on the trading rush video of MACD, if you want a different profict factor you can change until to reach 3, over this as a fixed risk reward don't have so much sense

MACD Crossover Strategy with EMA200 Trend DetectionSimple MACD Strategy Indicator.
Rules:
- MACD Crossover with Signal Line
If
- MACD Crossover above zero line
- Price is below EMA200
=> Sell
If
- MACD Crossover below zero line (buy)
- Price is above EMA200
=> Buy
SALEH All in One Strategythis script is based on MACD strategy
for MACD:
when we have an uptrend ( the price is above the EMA 200) & the macd line cross up the signal line while they are both under the 0 level of histogram it generates buy signals.
when we have a downtrend ( the price is below the EMA 200) & the macd line cross below the signal line while they are both above the 0 level of histogram it generates sell signals.
donchian channel works as a confirmation for the macd signal.
this strategy works best at London session.
feel free to comment
best regards Forexsquad2020
EMA50Diff & MACD StrategyOne of my attempts to create a strategy for BTC.
Its a combination of EMA50Diff (the difference between spot and EMA50) and MACD.
Buy signal if (EMA50Diff) < -(EMADiffThreshold),
(MACD bearish crossunder),
(MACD) < -(MACDThreshold),
(EMA50Diff) > (EMA50Diff 1 candle ago),
(EMA50Diff 1 candle ago) < (EMA50Diff 2 candles ago)
Sell signal if (EMA50Diff) > (EMADiffThreshold),
(MACD bullish crossover),
(MACD) > (MACDThreshold),
(EMA50Diff) < (EMA50Diff 1 candle ago),
(EMA50Diff 1 candle ago) > (EMA50Diff 2 candles ago)
Exit either when target or stoploss get reached.
Initial capital is set to 100k and its currently going all-in on every trade but im looking for a better way to handle position sizes already..
Also i included slippage of 30 ticks and exchange commission of 0.15% (e.g. 2x BitMEX market taker fee)
Works best on 15m on bitfinex, bitstamp and gdax and i'm still trying to optimize it for bitmex too, will update when i got there..

Scalper SMA-RSI-MACD – Entry/Exit Signals v2Scalper SMA–RSI–MACD Strategy (Intraday) – Indicator Version
This is an intraday scalping and short-term trading tool designed for manual trading. It provides entry and exit signals based on a combination of trend, momentum, and volatility-based risk management.
Core Components
Trend Filter (Optional)
Uses an EMA (default 200) and an SMA ribbon (5/8/13) to identify the primary trend direction.
Only allows long trades in uptrend and short trades in downtrend (can be turned off for more signals).
Entry Conditions
RSI Pullback: Detects oversold (for long) or overbought (for short) conditions based on a short RSI (default length = 4).
MACD Momentum Turn: Detects bullish or bearish MACD crossovers or momentum shifts.
Both conditions must occur within a specified lookback period (default = last 3 bars).
Stop Loss (SL) Placement
SL is placed at a fixed multiple of the ATR (Average True Range) from the entry price (default = 1.5 × ATR).
Adjusting the multiplier changes how far the SL is placed.
Take Profit (TP) Levels
Two targets: TP1 and TP2, each based on R-multiples of the SL distance.
Default: TP1 = 1 × risk (1:1 R/R), TP2 = 2 × risk (1:2 R/R).
Exit Modes (Selectable)
TP1 or SL
TP2 or SL
Opposite signal (exit when the opposite entry condition appears)
Session Filter (Optional)
Can restrict trading signals to specific market hours (default off for more signals).
Signals and Alerts
Displays LONG and SHORT arrows for entries.
Plots SL and TP levels on the chart.
Marks exits as TP, SL, or opposite signal.
Built-in alertcondition() allows creating TradingView alerts for all entry and exit events.
Typical Usage
Works best on 1-minute to 5-minute charts for scalping; can be adapted to higher timeframes for swing trading.
Ideal for manual execution — the trader sees the signal, checks market conditions, and decides whether to enter.
Can be tuned for more or fewer signals by adjusting RSI thresholds, MACD lookback, and trend filter settings.

The Ultimate Buy and Sell IndicatorThis indicator should be used in conjunction with a solid risk management strategy that does not over-leverage positions and uses stop-losses. You can not rely 100% on the signals provided by this indicator (or any other for that matter).
With that said, this indicator can provide some excellent signals.
It has been designed with a large number of customization options intended for advanced traders, but you do not HAVE to be an advanced user to simply use the indicator. I have tried to make it easy to understand, and this section will provide you with a better understanding of how to use it.
NOTE:
While NOT REQUIRED, I would recommend also finding my indicator called, "Ultimate RSI", which is designed to work together with this indicator (visually). They both contain the same settings and allow you to visualize changes made in this indicator that can not be displayed on the main chart.
This indicator creates it's own candles(bars), so you have to go into your main settings and turn off the "body, border and wick" color settings. Using a dark background is also recommended.
How does it work?
The indicator mainly relies on the RSI indicator with Bollinger Bands for signals. (Though not entirely)
First, there are something that I call "Watch Signals", which are various Bollinger Band crossing events. This could be the price crossing Bollinger Bands or the RSI crossing Bollinger Bands.
There are separate watch signals for buys and sells. Buy watch signals are colored orange to match the BUY signal candle color and Fuchsia (kind of a bright purple) to match SELL signal candles.
In order for most buy or sell signals to be created, there must first be a watch signal. There is a lookback period (or length) for watch signals to be used, and after that many candles (bars) have passed, they will be ignored. You can set a length to look back as well as a time to wait before creating any.
What this means is that if there has previously been (for instance) a sell signal. You can tell it to wait 10 bars before creating any buy watch signals. You can then also tell it that it should look back 10 bars from the current one in order to find any buy watch signals. This means that if you had it set up that way 10 to wait and 10 to validate, it would start allowing buy watch signals 11 bars after a sell, and then once you hit 20 bars, it will start leaving a gap (invisible to you) as the 10 bar lookback period starts moving forward with each new bar. This is useful in order to keep signals more spaced apart as some bad signals come quickly after another one.
Example: You may get a sell signal where the Bollinger bands are tight, then the price easily drops down into the lower band creating a buy watch signal, then you get a "fake" or short pump up and it says buy, but then drops dramatically afterwards. The wait period can ensure that the sell stays in effect longer before a buy is considered by blocking any buy watch signals for a period of time.
After you get a watch signal, the system then looks for various other things to happen to create buy or sell signals. This could be the RSI crossing the (slow) RSI Basis line (from its Bollinger bands), it could be the price crossing its basis line, it could be MACD crosses, it could even be RSI crossing certain levels. All of these are options. If you like the MACD strategy and want it to give you buy and sell signals from just MACD crosses, simply select that option for signals.
It is also able to use the first of any of the options that takes place.
I included an option to force alternating buy and sell signals, rather than showing groups of, or subsequent buy, buy, buy signals, for instance.
Moving on....
You can change the moving average that is used to calculate the RSI. The standard moving average for RSI is the RMA (aka SWMA). Changes to this can dramatically change your signals. You also have the option to change the moving average type used in the Bollinger bands calculation. You can change the length of these as well. The same goes for the Bollinger bands over the Price chart. I added an ATR option for the RSI Bollinger bands to play with, as well. You are able to adjust the standard deviation (multiplier) of the bands as well, which will of course affect the signals.
The ways you can play with signals are nearly infinite, so have fun figuring it out.
The indicator allows for moving averages to be shown as well, with a variety of types to choose from. The standard numbers are 5, 10, 20, 50, 100 and 200, with the addition of a custom moving average of your choice. You can also change the color of this one. You can choose to show them all or any of them you want to show, in any combination, although the TYPE of moving average (SMA, EMA, WMA, etc.) will apply to all of them.
You may also notice the Bollinger Bands over the Price are colored, and become more or less transparent.
The color is derived from the trend of the RSI or the RSI basis (your choice). It looks back at the value however many bars you want and compares the values and that's how it determines if it is trending up or down. Since RSI is a directional momentum indicator, this can be quite useful. If you see the bands are getting darker, this will explain why.
The indicator has a lookback period for determining the widest the bands (which measure volatility) have been over that period of time. This is the baseline. It then will make the bands disappear (by making them more transparent) if the volatility is low. This indicates that a change in volatility is coming and that price isn't really changing much compared to the past (default 500) bars. If they become bright, this is because price has started trending in a direction and volatility is increasing.
I should also note that the candles are colored based on RSI levels.
If you use the Ultimate Companion indicator, you will be able to see the RSI levels (zones) that the colors are based on. As RSI moves into a new range, the candle color will change.
I have created a yellow zone where the candles turn yellow. This is when RSI is between (default) 45 and 55, indicating there is basically no momentum and price is going sideways. This is a good place to get trapped in bad trades, and there is a Yellow RSI Filter to block signals in this area to keep you from entering bad trades.
Green candles indicate values over 55 (getting brighter as RSI rises) and red candles are RSI values under 45 (getting brighter as RSI values get lower). If you see white, this means RSI is either over 80 or under 20. A sharp reversal is almost always imminent at this stage.
When we talk about Buy and Sell Signals, they draw a green or red triangle and it literally says BUY or SELL. There is an option to color the background for added visibility. These signals do not "repaint", what this means is that they can be late. To account for this, I have included a background color that will flash as a warning that a buy or sell could be imminent, although it may fail to break through and set a buy or sell signal. This is simply an advanced warning. The reason is that sometimes a candle may be very large and you won't be told to buy or sell during the candle until the move is completely over and now you're getting in on the next one. That's not a great feeling, so I made it repaint the background color and not repaint the completed signal. You get the best of both worlds.
This indicator also uses complex logic to handle things.
When there is a buy signal, it enters into a state of having been bought, or a "bought state". The same for sells. If Force alternating signals is off, you could have more than one buy in a bought state, or more than one sell in a sell state. There is an option to color the background green during the full duration of a bought state, or red during the full duration of a sold state.
I have added divergence.
This shows that the lows or highs of RSI and PRICE are different. If RSI is making higher highs but the price is not, then the price is likely to follow this bullish divergence, if the opposite happens, it's bearish. It will draw a line on the chart connecting the highs and lows and call it bearish or bullish. You can adjust this as well.
I have an RSI High/Low filter. If the RSI basis (or average) is very high or low, you can block signal from this area since the price is likely to continue in that direction before actually reversing.
You can change the settings of the MACD if you choose to use it for signals, and if you want to see it, you'll have to run that indicator below the chart and match the settings to see what is going on, just like the RSI.
Going back to Watch Signals. You can also choose to require more than one watch signal if you choose. You can skip watch signals, so it will ignore the first or second one, whatever you want to do. You can color the background to show you where watch signals have been skipped.
Regarding the wait period for creating watch signals after a sell or after a buy, you can also color the background to see where these were blocked by the wait period.
Lastly you can choose which type of watch signals to use, or keep them from being shown on the chart. This allows you to study the history of how the asset you are trading behaves and customize the behavior of signals based on your study of it.
Everything in the settings area has tooltips, which will explain what that thing does to help you along this journey.
I hope this indicator (and perhaps Ultimate RSI alongside this) will help you take your trading to the next level.

Heikin-Ashi MACD"Heikin-Ashi, also sometimes spelled Heiken-Ashi, means "average bar" in Japanese. The Heikin-Ashi technique can be used in conjunction with candlestick charts when trading securities to spot market trends and predict future prices. It's useful for making candlestick charts more readable and trends easier to analyze. For example, traders can use Heikin-Ashi charts to know when to stay in trades while a trend persists but get out when the trend pauses or reverses. Most profits are generated when markets are trending, so predicting trends correctly is necessary."
HA bars help us to smooth the price action, and I think MACD gives me a lot of signals and I need to eliminate them and add MACD strategy on Heiken-Ashi candles to look performance.
Mostly, it eliminates %75 of the signals, and most of the time it did increase backtest performance significantly.
There is still a way to it to combine other indicators for complete strategy, but at least We can achieve better MACD with this approach.

[KL] BOLL + MACD Strategy v2 (published)This strategy will look for opportunities when price touches the lower Bollinger band, then enters Long when it anticipates a MACD crossover signal.
Setup: on 1-day chart interval
Exits when either (a) hitting trailing stop loss, or (b) meeting risk-to-reward, if defined by user.

BV's MACD SIGNAL TESTERHello ladies and gentlemen,
Today, as you may have seen in the title, I have coded a strategy to determine once and for all if MACD could make you money in 2020.
So, at the end of this video, you will know which MACD strategy will bring you the most money.
Spoiler alert: we've hit the 90% WinRAte mark on the Euro New Zealand Dollar chart.
I've seen a lot of videos of people testing different MACD signals, some up to 100 times.
But In my opinion, all traders must rely on statistics to put all the odds on their side and good statistics require a lot more data.
The algorithm I'm showing you tests each signal one by one over a 3 year period and on 28 different graphs.
That way we are sure that we have encountered all possible market behavior.
From phases of congestion to major trends or even the effects of COVID-19
I use the ATR to determine my Stop Loss and Take Profits. The Stop Loss is placed at 1.5 times the ATR, the Take Profit is placed at 1 time the ATR.
If my Take Profit is hit, I take 50% of the profits and let the position run by moving my Stop Loss to Zero.
This way, the position can no longer be a losing position.
If you are not familiar with this practice, I invite you to study the "Scaling out" video from the NoNonsenseForex channel.
BV's Trading Journal.

T3 ICL MACD STRATEGY
Backtested manually and received approx 60% winrate. Tradingview strategy tester is skewed because this program does not specify when to sell at profit target or at a stop loss.
Uses 1 min for entry and a longer time frame for confirmation (5,10,15, etc..) (Not sure what the yellow arrows are in the picture but they can be ignored)
Ideal Long Entry - The algo uses T3 moving average (T3) and the Ichimoku Conversion Line (ICL) to determine when to enter a long or short position. In this case we are going to showcase what causes the algo to alert long. It first checks to see if the the ICL is greater than T3. Once that condition is met T3 must be green in order to enter long and finally the last closing price has to be greater than the ICL. You can use the MACD to further verify a long trend as well!
Ideal Short Entry - The algo uses T3 moving average (T3) and the Ichimoku Conversion Line (ICL) to determine when to enter a long or short position. In this case we are going to showcase what causes the algo to alert short. It first checks to see if the the ICL is less than T3. Once that condition is met T3 must be red in order to enter short and finally the last closing price has to be less than the ICL. You can use the MACD to further verify a long trend as well!

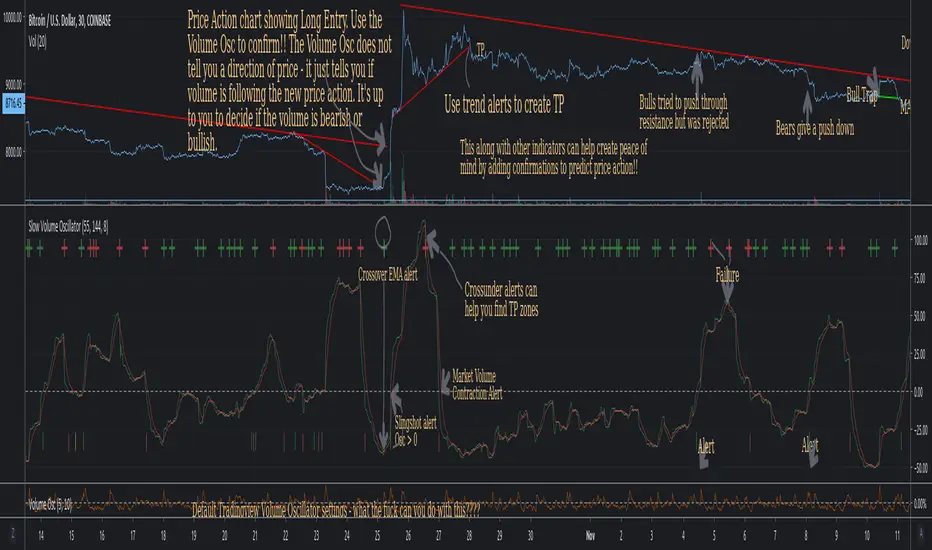
Slow Volume Oscillator Indicator - Just a Better Way To TradeThis script is nothing new. However, I feel that traders do not know the full potential it can provide if they just increase the lookback periods.
Tradingview's default Vol Osc uses a fast setting of 5 and a slow setting of 10. It just paints pointless scribbling. Slow all your indicators down and wake up to a whole new world of Technical Analysis.
To create consistency with variables I typically use Fib numbers for lookback periods. (3,5,8,13,21,34,55,89,144,233,377,610,987)
As noted in chart. An increase in volume can be either bullish or bearish. It's up to you to decide which way price action will move.
If you use with other indicators you can create more confirmations.
More confirmations = peace of mind
My favorite indicators are (Detrended Price Oscillator, Momentum, MACD, Chaikin Money Flow, Ultimate Oscillator, and this Volume Oscillator)
Here is just one example of MACD strategy indicator that can be used with this Vol Oscillator