GSO + RSI + MACD + MFI + Bollinger BandsThis script uses a Gann Swing Oscillator , RSI , MACD , MFI and Bollinger Bands to generate long and short signals for cryptocurrencies on the 5 minute chart.
The Gann Swing Oscillator was inspired by HPotter's GSO.
This script is for educational purposes only. This script is NOT to be used as financial advice. I will not accept liability for any losses which may occur as a result of using this script.
Cari dalam skrip untuk "macd缩量上涨"

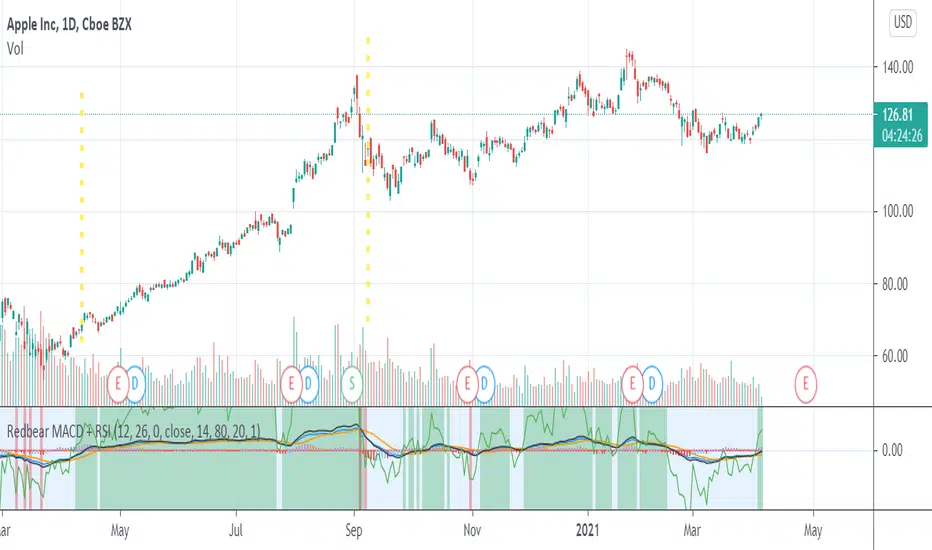
Redbear MACD + RSIHello . I make script that combine MACD and RSI
Green area is BUY SELL signal when rsi >45
you can custom parameter .
Log MACDThis is just a MACD indicator using the log of the closing price rather than the normal closing price. Useful for exponentially growing stocks and cryptocurrency.

ADX Momentum cross + MacD + HH LL + Buy/Sell Signals and alerts Hello, This is the first indicator I have made and would like to contribute to the community.
This strategy came from trying to replicate a previous ADX Cross Indicator that I loved on MT4 which I used successfully on EUR/USD on high and low time frames. Through the process of trying to replicate it I failed, I decided to take what I had written so far and create my own ADX cross strategy using the combination of 3 ADX's, their lag. Then also using Higher highs and lower lows with the MacD to further filter the signals.
There are two buy and two sell conditions , the difference between these are just the order in which the ADX crossing determines the entry. The MacD and higher highs and lower lows are the same for filtering the signal.
You can change the look back for HH and LL look back range, along with the DI Length & ADX Smoothing for all ADX's. The lag used for either the buy or sell strategy with the Lag_Buy/Lag_Sell inputs. Lag_mid setting will affect all 4 conditions.
From testing and based on the ADX cross logic you should follow this structure when changing the inputs for:
DI Length: Lowest DI value (I.E. 1)
DI Lengtha: Middle DI value (I.E. 2)
DI Lengthb: Highest DI value (I.E. 3)
ADX Smoothing: Lowest Smoothing value (I.E. 1)
ADX Smoothinga: Middle Smoothing value (I.E. 2)
ADX Smoothingb: Highest Smoothing value (I.E. 3)
I tested this on the EUR/USD, but mainly I have been using it on BTC/USDT(binance) and BTC/USDT Perpetual futures(binance) with the 5 minute chart. I suggest playing around with the settings depending on the Symbol and timeframe you use because the default settings are what I last found to be optimal for my self on the 5min BTC/USDT Perpetual futures(binance) chart.
A good starting point I found when using the indicator on other charts is to use the below values:
DI Length: 7
DI Lengtha: 14
DI Lengthb: 21
ADX Smoothing: 7
ADX Smoothinga: 14
ADX Smoothingb: 21
If you have any questions, suggestions, or requests for this indicator feel free contact me. You can either comment on here or Message me
If you like this indicator please like and comment where you found it useful.

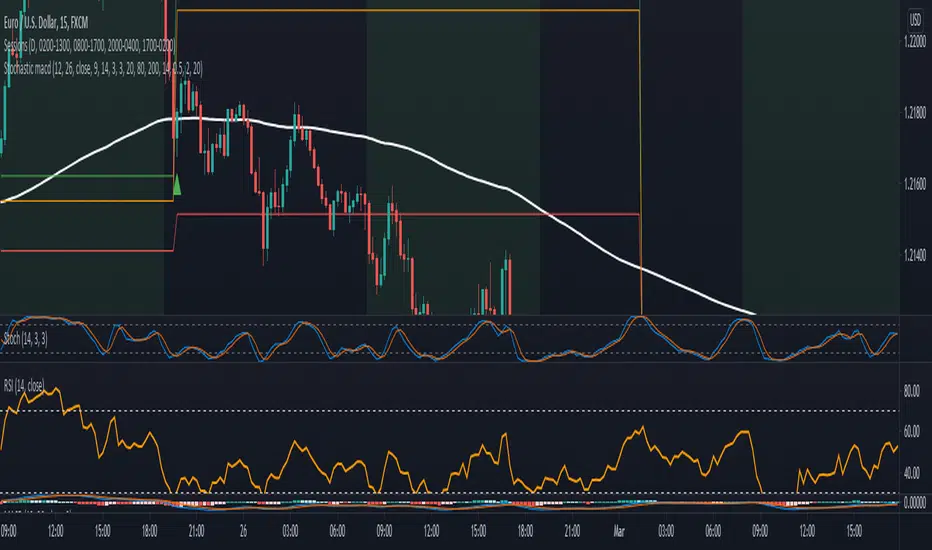
Stochastic with MACD filter + SL/TP + AlertsLong Arrow : close of the candle is above ema + Stochastic is oversold + MACD is below 0 + Stochastic cross up
Short Arrow : close of candle is below ema + Stochastic is overbought + MACD is above 0 + Stochastic cross down
Also added SL, 1:1 and TP where SL can be varied by ATR value and TP is set to 2:1 RR but it can be varied too.
It is not meant to take every single trade even though that might already be profitable.
For higher winrate look for the higher timeframe trend for example when trading the 15min look if the Daily 8ema is going up or down.
Also only take trades when there is either a hidden divergence on RSI or a smaller normal divergence.
The I take the normal divergenes alo when there is no higher high like an M or lower low for longs like a W these tend to work out pretty good too.
Alerts are in it too.
Have Fun :)
RSI of MACD Strategy [Long only]This strategy uses the RSI on MACD indicator.
BUY
====
When RSI indicator crossing over 30 or 35 line and price above slow ema
Note: when the position already taken, you may reenter on the purple candle
Partial Exit
==========
Partial profit taking option is available in settings. If this is selected , 1/3 position exited when RSI indicator crossing down 80 line
Close
=====
When RSI indicator crossing below 15
Stop Loss
=========
I havent used hard stop loss in this strategy. Reason is , when price going down , indicator may go up ... so just wanted to ride along with indicator ...
Stop loss mentioned in the settings is used in calculation of how many units can be be purchased based on risk level
Tested with SPY and QQQ ETFs on hourly chart
Warning
=========
For the eductional purposes only ...
This is not a financial advise. please do your own research before taking any trading decission


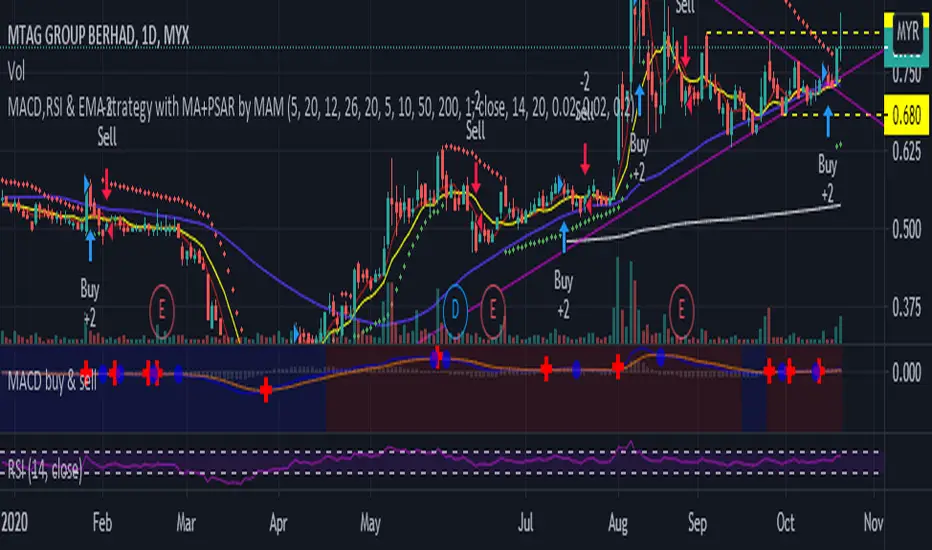
MACD,RSI & EMA strategy with MA+PSAR by MAMMACD,RSI & EMA strategy with MA+PSAR
Buy strategy
- MACD above signal
- RSI above RSI signal
- Close price above EMA
Sell Strategy
- MACD below signal
- RSI below RSI signal
- Close price below EMA
Full strategy AllinOne with risk management MACD RSI PSAR ATR MAHey, I am glad to present you one of the strategies where I put a lot of time in it.
This strategy can be adapted to all type of timecharts like scalping, daytrading or swing.
The context is the next one :
First we have the ATR to calculate our TP/SL points. At the same time we have another rule once we enter(we enter based on % risk from total equity, in this example 1%, at the same time, lowest ammount for this example is 0.1 lots, but can be modified to 0.01), so we can exit both by tp/sl points, or by losing 1% of our equity or winning 1% of our total equity. It's dinamic.
The strategy is made from
Trend direction :
PSAR
First confirmation point :
Crossover between 10EMA and Bollinger bands middle point
Second confirmation
MACD histogram
Third confirmation
RSI overbought/oversold levels
For entries : we check trend with psar, then once ema cross bb middle point, we confirm together with rsi level for overbought/oversold and macd histogram ( > 0 or <0).
We exit, when we have opposite sign, like from buy to sell or sell to buy, or when we reach tp/sl points, or when we reach % basaed equity points.
It can be changed to be fixed lots, or fixed tp/sl , you just have to uncomment the size from entries, and tp/sl lines.
At the same time, it has the possibility if one desires, to trade only concrete forex session like european, asian and so on for intraday trading.
Hope you enjoy it.
Let me know how it goes.

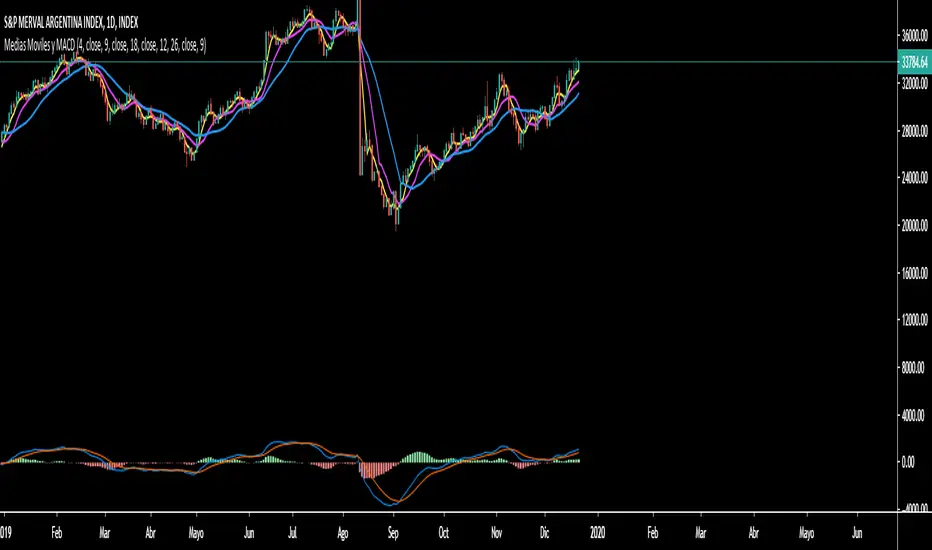
Simple Mobile Averages y MACDScript designed for users who need more than 3 indicators. It has 3 programmable "Simple Mobile Averages". MACD integrated in the main panel, also programmable.
Mirror TSI-MACD by Trader JayI was playing around with the TSI-MACD and surprisingly it works quite well as a mirror.
There are 2 ways this can be used
1. Enter long when Blue line crosses up the Red
2. Exit long when Green line crosses the blue
or
1. Enter long when Blue line crosses up the Red
2. Exit long when Blue line crosses back down below the Red

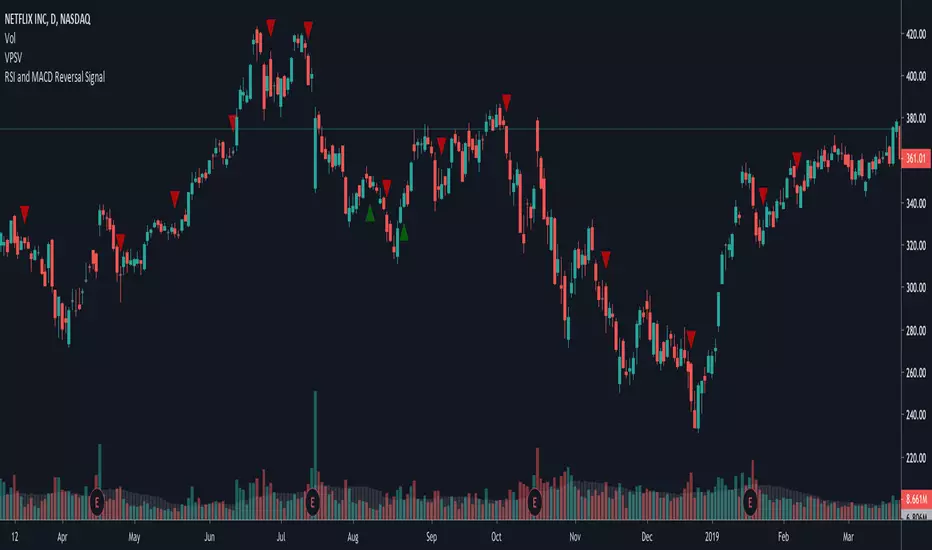
~RMCF~ RSI and MACD Reversal SignalFor AkibaDeep. Checks if RSI < 30 recently and if MACD diverges, placing a buy signal. Then, places a sell signal when MACD converges back.
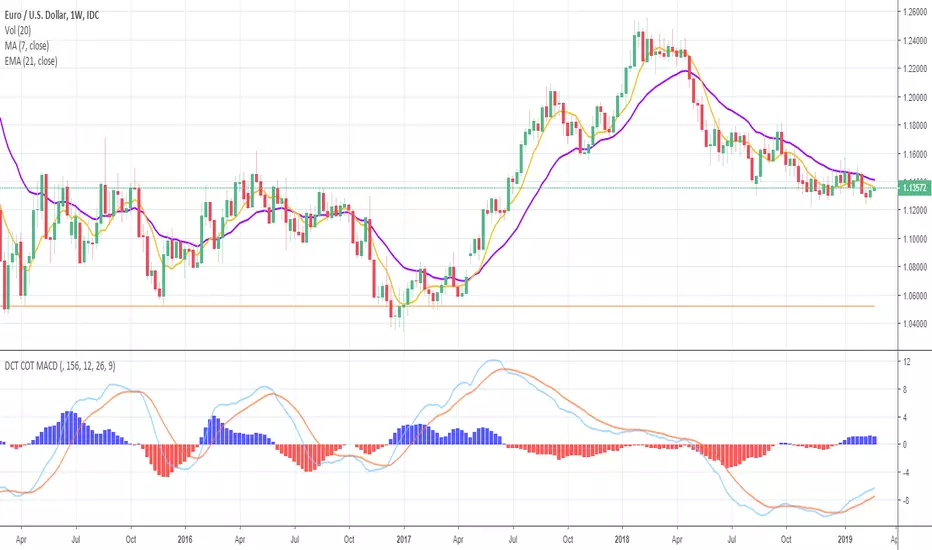
Deckchair Trader COT MACDPlots the COT MACD from the legacy report data from Quandl. Plots the commercial, non commercial and non reportables. Each plot can be hidden as needed.
I've tried to capture the basic dollar based currencies and the futures such as corn , wheat , rice, oil , hogs etc. The symbols required a little translation to match what Quandl is expecting but I think I got most of them. Please let me know of any issues with these.
Part of a suite of COT related indicators based on the excellent book "the commitment of traders bible" by Stephen Briese.
Feb 26, 2018
Release Notes: Quandl have changed their codes :( now they seem to be using the CFTC Id's where are numeric (and can be found in the dump you get from them)
So whereas before for example, GBPUSD was mapped to BP it is now mapped to 096742.
I have gone through the various dumps and tried to map all the symbols I was using, the currency were the easy ones, the wheat, corn etc a little harder to trade down due to variations.
Please let me know if different
Thanks
Tim Titchmarsh
DeckchairTrader
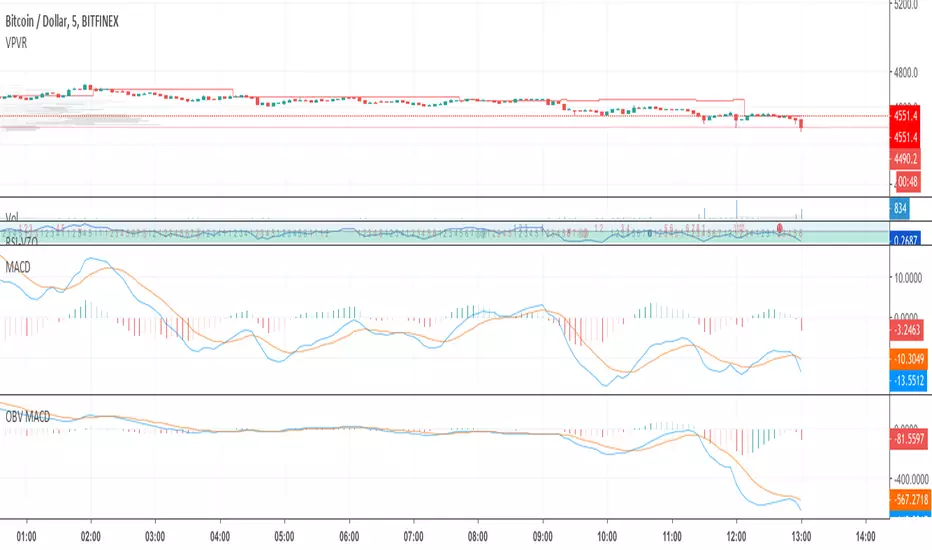
OBV MACDOBV MACD paints a different picture from traditional MACD on low and high (not intermediate) timeframes.
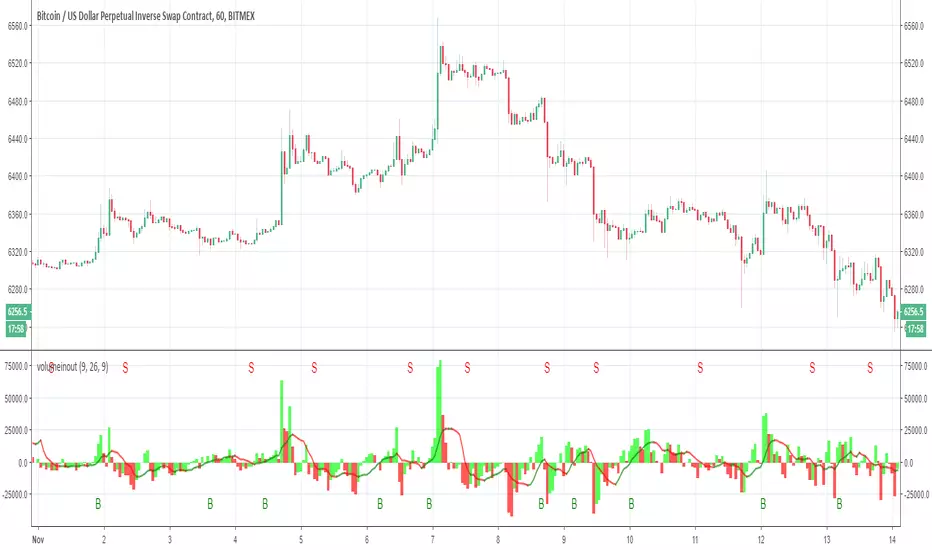
Volume in out as MACD with alerts Lets make the Volume in out as MACD
with alerts (B =buy) S=sell
have fun
BNG MACD / Blue and Green MACDJust publish it again so it's easier to search this indicator.
Just inspired from macd 4c.
I changed it to blue and green color so it's looks better.
Ergotic MACD Strategy [forked from HPotter]Ergotic MACD Strategy forked from HPotter
In addition to this fine script you will find some additional features:
- Backtester
- Alerts
- Filters: RSI, MFI, Price trend
- Trailing Stop Loss
- Other minor adjustments

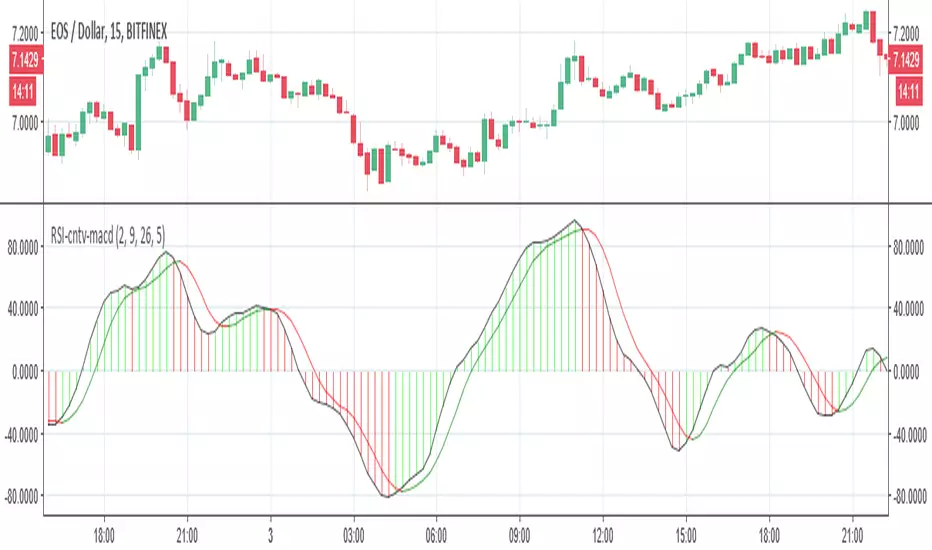
RSI-cumulative net volume as MACDSo here in this model I take the RSI-cumulative net volume and convert it to MACD
I think it look nicer then original but it just idea:)
for different time frame just change setting:)
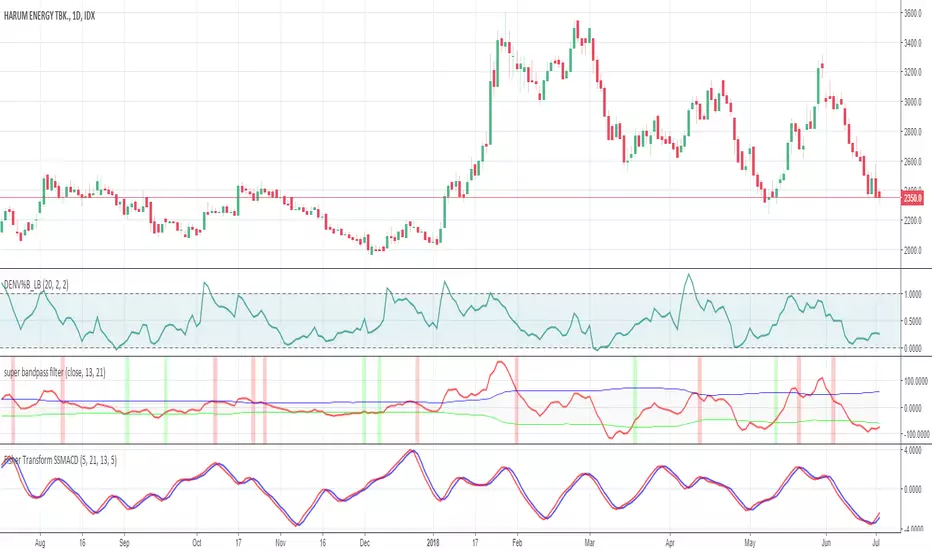
Fisher Transform SuperSmoothed MACD // This is a modification of Supersmoothed MACD (created by KIVANC using EHLERS' SUPER SMOOTHER FILTER) and sharpenned with Ehler fisher transform
//all lengths and parameters are completely configurable, tune the length according to your instrument
//give me what you think
MACD [Moving Average Convergence/Divergence]MACD rendered as candles to make it easier on the eyes. Candles are hollow when the MACD line moves opposite direction of the trend, which can signal a weakening trend.

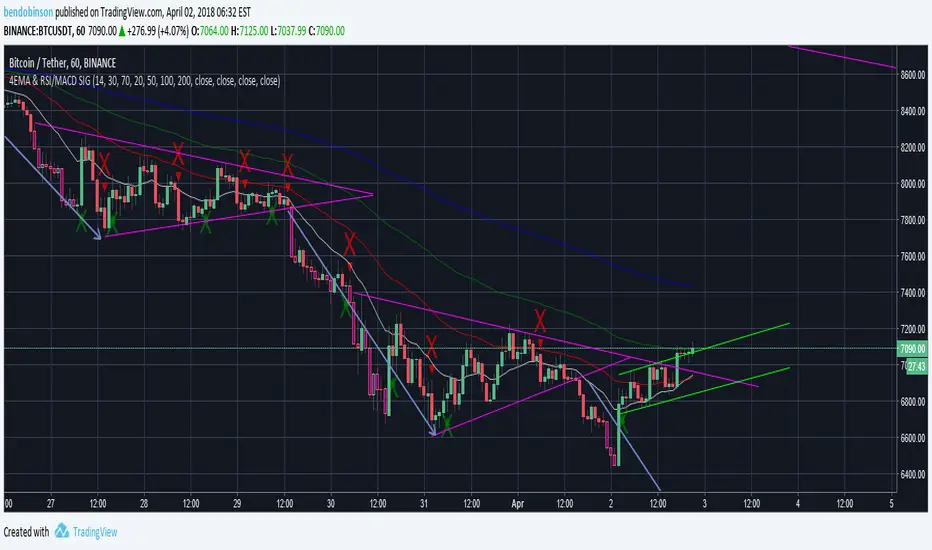
BD 4EMA RSI/MACD SIGNAL V1this chart allows 4 moving averages and gives a signal for macd cross over up and down as well as RSI oversold - purple - and overbought -yellow - all in 1 indicator.

Ultra MACD [DW]This is a variation of Gerald Appel's MACD with seven moving average source types to choose from.
The MA types I've included in this script are:
- Kaufman's Adaptive Moving Average
- Geometric Moving Average
- Hull Moving Average
- Volume Weighted Moving Average
- Least Squares Moving Average
- Arnaud Legoux Moving Average
- Exponential Moving Average
Custom bar color scheme is included with two different colorization methods - one based on the MACD, and the other based on the histogram.
