Anchored Momentum [LazyBear]Anchored Momentum (AMOM), by Rudy Stefenel, is a modified momentum indicator to capture the relative momentum. AMOM uses SMA as the reference for deriving momentum, thereby anchoring it to that MA rather than "value of close n bars back".
Mr.Stefenel suggests using this like other oscillators -- crossing signal line, crossing zero, divergences.
For alerts, use "Momentum", "Signal" and "ZeroLine" plots.
Configurable options:
- Momentum Period: Default is 10.
- Signal Period: Default is 8.
- Smooth Momentum: Default is FALSE. If TRUE, enables EMA(close) to be used rather than "close".
- Smoothing Period: Default is 7. If momentum smoothing is enabled, this period is used.
- Show Histogram: Default is FALSE. This is not histogram per se (indicator - signal), but is used for highlighting the crosses. Check out the histogram pane below to see an example.
- Enable Barcolors: Default is FALSE. If enabled, colors the price data (bars/candles) using histogram color.
More info:
Anchored Momentum, Stocks & Commodities V16:2 (89-98)
Complete list of all my indicators:
docs.google.com
Cari dalam skrip untuk "momentum"

Momentum TrackerMomentum Tracker - Advanced Multi-Timeframe Momentum Oscillator
Overview
The Momentum Tracker is a sophisticated momentum oscillator that employs a proprietary triple-layer exponential smoothing algorithm to measure market momentum with exceptional precision. This indicator transforms complex price movements into clear, actionable signals through an intuitive color-coded display system.
Key Features
• Advanced Calculation Engine
Triple-layer exponential smoothing for noise reduction
Proprietary momentum normalization algorithm
Oscillates smoothly between 0-100
• Multi-Timeframe Analysis (NEW!)
Analyze momentum from any timeframe on your current chart
Perfect for confirming higher timeframe trends on lower timeframe entries
Timeframe display badge for easy reference
• Dynamic Visual System
Blue: Rising momentum (bullish pressure)
Red: Falling momentum (bearish pressure)
Yellow: Neutral/consolidating (no clear direction)
• Reference Levels
90: Overbought zone
50: Equilibrium line
10: Oversold zone
• Professional Features
No repainting - uses only confirmed data
Works on all markets (Forex, Crypto, Stocks, Indices)
Compatible with all timeframes (1m to Monthly)
Clean, uncluttered display
How It Works
The Momentum Tracker uses a sophisticated multi-stage process:
Price Input: Calculates using typical price (HLC/3) for balanced market representation
Triple Smoothing: Applies three layers of adaptive exponential smoothing to filter market noise while preserving trend integrity
Momentum Normalization: Converts raw momentum into a bounded 0-100 oscillator
Dynamic Coloring: Instantly visualizes momentum direction through color changes
Trading Applications
1. Trend Identification
Blue line = Uptrend momentum
Red line = Downtrend momentum
Yellow line = Consolidation/indecision
2. Overbought/Oversold Conditions
Readings above 90 suggest overbought conditions
Readings below 10 suggest oversold conditions
Best used in conjunction with price action
3. Momentum Divergences
Spot regular and hidden divergences
Early warning of potential trend reversals
Confirmation tool for other signals
4. Multi-Timeframe Confirmation
View daily momentum on hourly charts
Confirm entry signals with higher timeframe momentum
Avoid trades against higher timeframe momentum
5. Entry/Exit Timing
Color changes can signal momentum shifts
Midline (50) crosses indicate trend bias changes
Extreme readings suggest potential reversal zones
Settings
• Timeframe: Select any timeframe for momentum calculation (leave empty for chart timeframe)
Best Practices
DO combine with price action and support/resistance levels
DO use multiple timeframe analysis for confirmation
DO wait for clear color changes before making decisions
DON'T use as a standalone trading system
DON'T trade solely based on overbought/oversold levels
DON'T ignore overall market context
Pro Tips
Divergence Trading: Look for momentum making lower highs while price makes higher highs (bearish divergence) or vice versa
Trend Following: Trade in the direction of the momentum color on higher timeframes
Range Trading: Use extreme readings (>90 or <10) for mean reversion trades in ranging markets
Confluence: Best signals occur when momentum aligns across multiple timeframes
Technical Details
Version: 6.0 (Pine Script v6)
Overlay: False (displays in separate pane)
Repainting: No
Calculation: Based on typical price (HLC/3)
Update Frequency: Real-time with each price tick
Risk Disclaimer
Trading financial instruments involves substantial risk and may result in loss of capital. This indicator is provided for informational and educational purposes only and should not be construed as investment advice. Always:
Use proper risk management
Updates
Latest Update: Added multi-timeframe functionality allowing momentum analysis from any timeframe on your current chart view.
Tags: #momentum #oscillator #trend #multitimeframe #norepaint #exponentialsmoothing #momentumindicator #technicalanalysis #trading #forex #crypto #stocks

ASI Momentum CloudASI Momentum Cloud (AMC) — a scaled Accumulative Swing Index (ASI) momentum indicator with an EMA cloud for visual trend context, signal smoothing, and configurable scaling for any instrument.
---
## Overview
The ASI Momentum Cloud visualizes ASI-based momentum while providing a three-EMA cloud that highlights trend bias and momentum strength. The indicator scales ASI values for better visibility across different instruments and adds an SMA signal line for entry/exit clarity. Designed for traders who want a momentum oscillator with trend context and simple alertable signals.
## Key features
* Scaled ASI value (`ASI Multiplier`) for improved chart readability.
* Configurable `Daily Limit` to adapt the ASI calculation to different asset volatilities.
* SMA signal line to smooth ASI and provide clear cross signals.
* Three-EMA cloud (Fast / Mid / Slow) to show bullish/bearish bias and momentum shifts.
* Lightweight, low-latency computation — suitable for multiple timeframes.
* Built-in cloud coloring: green tint when Fast EMA > Slow EMA, red tint otherwise.
## How it works (brief)
1. ASI is calculated each bar using price movement components (high/low/close relationships) and normalized by the `Daily Limit`.
2. `ASI Multiplier` scales the values for visual clarity.
3. A short SMA (`Period Length`) acts as the indicator’s signal/smoother.
4. Three EMAs (Fast / Mid / Slow) form a cloud — their relative positions determine the cloud color and trend bias.
## Inputs (as shown in settings)
* **Daily Limit** — numeric; adjusts ASI normalization (default: `10000`). Tune to instrument volatility.
* **ASI Multiplier** — numeric; scales the ASI for visibility (default: `100`).
* **Period Length** — SMA length for the signal line (default: `14`).
* **EMA Cloud Fast Length** — fast EMA (default: `7`).
* **EMA Cloud Mid Length** — middle EMA (default: `14`).
* **EMA Cloud Slow Length** — slow EMA (default: `28`).
## How to interpret signals
* **Bullish bias:** EMA Fast > EMA Slow → cloud green (favour long bias).
* **Bearish bias:** EMA Fast < EMA Slow → cloud red (favour short bias).
* **Momentum entry:** ASI line crossing **above** the Signal SMA — momentum turning positive.
* **Momentum exit / short entry:** ASI line crossing **below** the Signal SMA — momentum turning negative.
* **Confirmation:** Prefer entries that align with cloud bias (e.g., take long crossovers when cloud is green).
* **Divergence:** Watch for price making new highs/lows while ASI fails to confirm — possible momentum exhaustion.
## Suggested alert messages (copy/paste)
* `ASI Momentum Cloud — ASI crossed above Signal (potential buy)`
* `ASI Momentum Cloud — ASI crossed below Signal (potential sell)`
* `ASI Momentum Cloud — Cloud turned bullish (EMA Fast > EMA Slow)`
* `ASI Momentum Cloud — Cloud turned bearish (EMA Fast < EMA Slow)`
Use these messages in TradingView alert conditions tied to the corresponding cross or condition.
## Recommended usage & timeframes
* Works on any timeframe; commonly useful on 1H, 4H, Daily for trend-following, and lower timeframes for intra-day momentum signals.
* Adjust **Daily Limit** and **ASI Multiplier** for low-volatility instruments (smaller limit, higher multiplier) or high-volatility instruments (larger limit, lower multiplier).
* Combine with price action, support/resistance, or higher-timeframe trend for better signal quality.
## Notes & credits
* Version: 1.0 — initial release.
* If you adapt or redistribute, please credit the original script.
* Built for clarity and practical trading signals — tweak the input values to match your instrument and trading style.
## Risk disclaimer
This indicator is a technical tool and not investment advice. Backtest and paper-trade any strategy before using real capital. Use proper risk management.

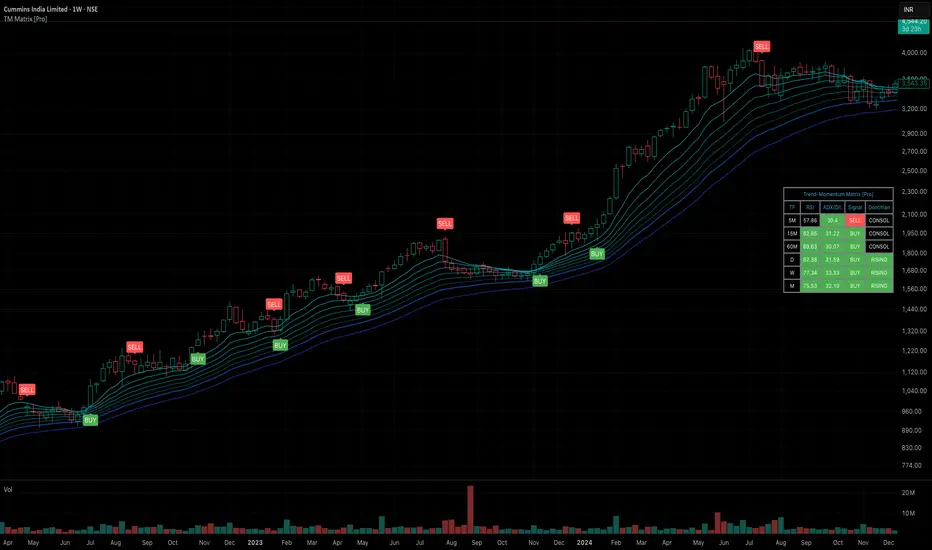
Trend-Momentum Matrix [Pro]The Problem: Analysis Paralysis Traders often struggle to align multiple timeframe signals. You might see momentum on the 5-minute chart but fail to notice a major resistance on the 1-hour, or enter a trend just as it loses strength. Juggling multiple indicators (RSI, Moving Averages, ADX, Clouds) on a single chart creates clutter and confusion.
The Solution: Trend-Momentum Matrix The Trend-Momentum Matrix is a professional-grade dashboard that condenses complex market data into a single, high-contrast heatmap. It allows you to monitor the health of a trend across 7 distinct timeframes simultaneously—from scalping charts to long-term views—without cluttering your screen.
This tool is built on a "Strict Compliance" engine. It does not issue signals based on loose guesses; it waits for a high-probability confluence of three market forces: Price Structure, Momentum Velocity, and Trend Strength.
Core Capabilities
1. Dual-Engine Logic The system runs two independent strategies in parallel to catch both sides of the market:
Compounder Engine (Longs) : Identifies high-growth setups where momentum has entered a "Bullish Power Zone," supported by institutional trend strength.
Breakdown Engine (Shorts): Detects structural failures where momentum is accelerating downward and trend support has been breached.
2. The "Squint Test" Visualization Markets move fast. You shouldn't have to read numbers to know the trend. The Matrix utilizes a Heatmap Architecture:
Solid Green Row: Confirmed Bullish Confluence (Safe to Buy).
Solid Red Row: Confirmed Bearish Breakdown (Safe to Short).
Black/Mixed: Noise or Consolidation (Stay Out).
3. Advanced Noise Filtering: Most indicators fail in choppy markets. This tool uses a multi-layered filter:
Trend Strength (ADX) Filter: Signals are ignored if the prevailing trend is too weak or sideways.
Structure Lock: Signals are strictly gated by key moving averages. If the price structure isn't sound, the signal is suppressed.
4. Donchian Breakout Detection The matrix automatically tracks volatility breakouts. It monitors whether the current price action is expanding beyond historical volatility bands (Upper/Lower Donchian channels) to confirm true breakouts versus fake-outs.
Key Features
Multi-Timeframe Matrix: Monitor 7 timeframes (fully customizable with On/Off toggles) in one corner of your screen.
Auto-Adaptive Interface: The table uses a high-contrast Black background that remains clearly visible on both Light and Dark TradingView themes.
Smart Ribbon: Includes an optional, non-intrusive 8-line Moving Average Ribbon to visualize trend flow directly on the chart.
Strict Exit System: The system is designed to protect capital. The moment the specific conditions for Momentum or Structure are lost, the signal immediately converts to an EXIT or COVER command.
Risk Disclaimer: Trading involves substantial risk and is not suitable for every investor. This tool is an analysis aid and does not constitute financial advice. Past performance is not indicative of future results.
Access: This is an Invite-Only premium indicator. Please contact the author to request access.
Squeeze Go Momentum Pro [KingThies] █ OVERVIEW
The Squeeze Momentum Pro indicator identifies volatility compression phases and breakout opportunities by comparing Bollinger Bands to Keltner Channels. When price consolidates (squeeze), the bands contract inside the channels, signaling an imminent breakout. The momentum histogram shows directional bias, helping traders anticipate which way price will move when the squeeze releases.
This indicator displays in a separate panel below the price chart, providing clear visual signals without cluttering price action.
█ KEY FEATURES
Momentum Histogram
The histogram is the primary visual element, displaying momentum strength and direction with four distinct color states:
• Dark Green (#00C853) — Strong bullish momentum that is increasing. This signals strengthening upward pressure and potential continuation.
• Light Green (#26A69A) — Bullish momentum that is decreasing. Price remains in bullish territory but upward force is weakening.
• Dark Red (#D32F2F) — Strong bearish momentum that is increasing. This signals strengthening downward pressure and potential continuation.
• Light Red (#EF5350) — Bearish momentum that is decreasing. Price remains in bearish territory but downward force is weakening.
The color intensity provides immediate feedback on momentum strength and trend health.
Squeeze State Indicator
Colored dots on the zero line communicate the current volatility state:
• Orange Dots — Squeeze is ON. Bollinger Bands have contracted inside Keltner Channels, indicating consolidation and low volatility.
A breakout is building and traders should prepare for directional movement.
• Green Dots — Squeeze is OFF. Bollinger Bands have expanded outside Keltner Channels, indicating active momentum and higher volatility.
Price is moving with conviction in the current direction.
• Gray Dots — Neutral state. The bands are transitioning between squeeze states.
Release Triangles
Triangle shapes mark the exact bar when a squeeze releases, providing precise entry timing:
• Green Triangle Up — Bullish squeeze release. The squeeze has ended with positive momentum, suggesting a long setup opportunity.
• Red Triangle Down — Bearish squeeze release. The squeeze has ended with negative momentum, suggesting a short setup opportunity.
Information Panel
A compact dashboard in the top-right corner displays real-time trading intelligence:
• Squeeze Status — Current state: ON, OFF, or NEUTRAL with color coding
• Momentum Direction — Current bias: BULL or BEAR
• Momentum Value — Precise numerical reading of momentum strength
• Trading Signal — Actionable status: LONG SETUP, SHORT SETUP, WAIT, or MONITOR
Configurable Parameters
All calculation inputs are adjustable to match your trading style and timeframe:
• BB Length — Bollinger Bands period (default: 20)
• BB StdDev — Bollinger Bands standard deviation multiplier (default: 2.0)
• KC Length — Keltner Channels period (default: 20)
• KC ATR Multiplier — Keltner Channels range multiplier (default: 1.5)
• Momentum Length — Linear regression period for momentum calculation (default: 20)
Alert System
Four alert conditions notify you of critical trading opportunities:
• Bullish Squeeze Release — Squeeze has released with bullish momentum, indicating a potential long entry
• Bearish Squeeze Release — Squeeze has released with bearish momentum, indicating a potential short entry
• Squeeze Started — Volatility compression detected, prepare for upcoming breakout
• Squeeze Ended — Volatility expansion confirmed, breakout is active
█ TRADING METHODOLOGY
The indicator follows a clear four-step process for identifying and trading squeeze breakouts:
1 - Wait for Orange Dots . When orange dots appear on the zero line, a squeeze is building. This indicates price consolidation and declining volatility.
Do not enter trades during this phase. Instead, prepare by identifying key support and resistance levels and potential breakout directions.
2 - Watch for Release Triangle . When a triangle appears, the squeeze has released and a breakout is beginning. This is your entry signal.
The triangle color (green up or red down) combined with the histogram direction indicates the breakout direction.
3 - Confirm with Histogram Direction . Check the momentum histogram for directional confirmation:
• Green histogram + green triangle up = Go long. Bullish momentum supports upward breakout.
• Red histogram + red triangle down = Go short. Bearish momentum supports downward breakout.
4 - Monitor Momentum Intensity . Stay in the trade while histogram bars maintain their dark, intense color.
When colors lighten (dark green to light green, or dark red to light red), momentum is weakening and you should consider taking profits or tightening stops.
█ INTERPRETATION GUIDE
Squeeze Detection Logic
A squeeze occurs when Bollinger Bands contract inside Keltner Channels. This happens when:
• Standard deviation of price decreases (BB narrows)
• Price consolidates within a tight range
• Volatility compresses to unsustainable levels
The orange dots signal this condition, warning traders that explosive movement is imminent.
Squeeze Release Logic
A squeeze releases when Bollinger Bands expand outside Keltner Channels. This happens when:
• Price volatility increases sharply
• Price breaks out of consolidation
• Volume typically expands (check volume separately)
The green dots and release triangles signal this condition, indicating the direction and timing of the breakout.
Momentum Reading
The histogram uses linear regression to calculate momentum relative to the midpoint of the recent range:
• Above Zero : Price is trading above the range midpoint with bullish pressure
• Below Zero : Price is trading below the range midpoint with bearish pressure
• Increasing Bars : Momentum is strengthening in the current direction (darker color)
• Decreasing Bars : Momentum is weakening in the current direction (lighter color)
█ BEST PRACTICES
• Timeframe Selection — The indicator works on all timeframes but performs best on 15-minute to daily charts.
Lower timeframes may produce more false signals due to noise.
• Confluence Trading — Combine squeeze releases with support/resistance levels, trend lines, or other indicators for higher probability setups.
• Volume Confirmation — Check that squeeze releases occur with increasing volume. Low volume breakouts are more likely to fail.
• Multiple Timeframe Analysis — Check higher timeframes for overall trend direction. Trade squeeze releases that align with the larger trend.
• Parameter Adjustment — Increase BB and KC lengths for smoother signals on higher timeframes. Decrease for more sensitive signals on lower timeframes.
█ LIMITATIONS
• The indicator does not predict breakout direction before the squeeze releases. The momentum histogram provides bias but is not definitive until the breakout occurs.
• False breakouts can occur, particularly in choppy or low-volume market conditions. Always use proper risk management and stop losses.
• The indicator works best in trending markets. In deeply ranging markets with no clear direction, squeeze signals may be less reliable.
• Momentum calculations use linear regression which can lag during extremely fast price movements. Confirm signals with price action.
█ NOTES
This implementation uses linear regression for momentum calculation rather than simple moving averages, providing more responsive and accurate directional signals. The four-color histogram system gives traders nuanced feedback on momentum strength that binary color schemes cannot provide.
The indicator automatically adjusts to any symbol and timeframe without modification, making it suitable for stocks, forex, crypto, and futures markets.
█ CREDITS
Squeeze methodology inspired by John Carter's TTM Squeeze indicator. Momentum calculation and visual design optimized for modern trading workflows.

Option Chain-Based Call & Put Momentum VisualizerOption Chain-Based Call & Put Momentum Visualizer
invite-only by @JjpTradingAcademy
Overview
The Option Chain-Based CE/PE Momentum Visualizer is a powerful analytical tool designed to track real-time momentum and sentiment shifts between Call (CE) and Put (PE) options directly on the chart. It offers deep insight into option buyers’ and sellers’ behavior by analyzing multiple strikes, dynamically calculating cumulative CE/PE strength, and correlating it with underlying index price movements.
How to Use
The bottom pane of the indicator displays the decay data for both Call and Put options at every candle, green shows positive, red shows negative, and orange shows neutral. At the centre, it shows difference between Call and Put decay data, if the difference is less than 35 then it indicates with lime color otherwise it appears with purple color, When the trend changes between from lime and purple, the indicator plots a purple bar representing strong candles that often precede high momentum moves.
High/Low ranges are automatically plotted once the middle value drops below 10.
A breakout/breakdown of purple candle at the range indicates a strong directional movement on either side.
Reference images for visual guidance:
Inputs
To ensure proper functionality, fill in all fields correctly - Index/Stock Symbol Name, Pre-Market 's ATM Level, Options Type (OTM, ITM, OTM+ITM), Options Expiry Date, Options Symbol Prefix, Strike Interval If these are not set correctly, runtime errors may occur.
CE/PE Candle Strength – Displays CE/PE strength % for each candle
Highlight Prior Range – Marks previous High/Low zones for visual confirmation
Show Historical Entry Zone – Displays earlier High/Low ranges with color fills to highlight zone strength
Alerts
Purple Bar Signal
(Setup: Add Alert → Condition: "Option Chain-Based Call & Put Momentum Visualizer" → "Purple Bar Signal")
Security Call
All signals are calculated on bar close.
The script uses security () calls to fetch individual option OHLC data for accurate CE/PE momentum analysis.
Access
Invite-Only.
Request access via TradingView PM to @JjpTradingAcademy
Redistribution, reselling, or code extraction is strictly prohibited.
Disclaimer
This indicator is for educational purposes only.
It does not constitute financial advice or a guaranteed system of profitability.
Trading options involves significant risk - always conduct your own research and apply sound risk management.

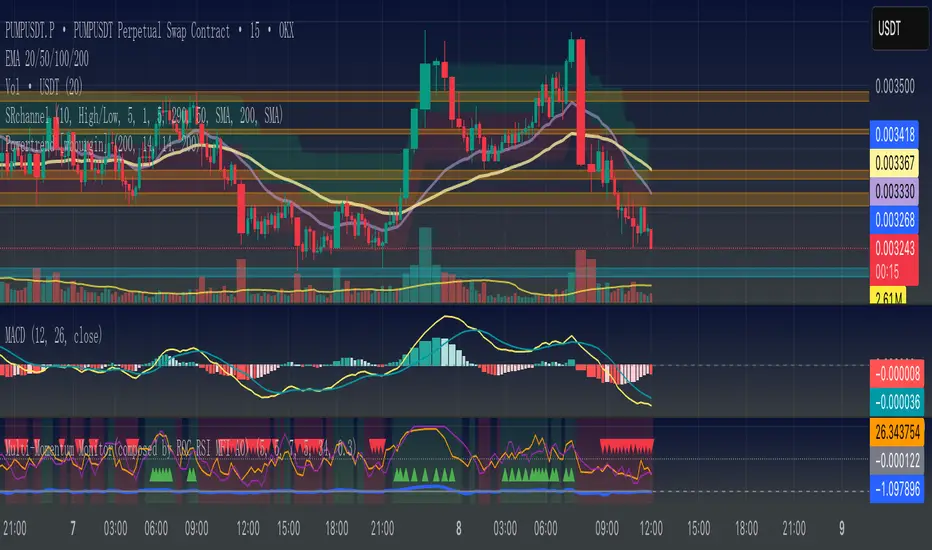
Multi-Momentum Monitor(composed by ROC RSI MFI AO)Multi-Momentum Monitor (Multi-Momentum Monitor) instructions for use
Version: v6 revised version
Applicable objects: currency circle, stock market, futures short-term/swing trader
effect:
Integrate ROC (momentum rate of change), RSI (relative strength), MFI (capital flow), and AO (oscillator) together
Judge the direction and intensity of the current market momentum through “multi-index resonance”
Low latency, easy to configure, suitable for market tracking to assist in judging “pullback vs reversal”
1、Overview of indicator functions
Legend description:
Background color: Green = Strong kinetic energy of multiple parties (≥3/4 of the indicators are in the same direction), red = strong kinetic energy of the empty party (≤1/4 of the indicators are in the same direction)
Triangle mark: The green triangle at the bottom = all long signals of the 4/4 indicator; the red triangle at the top = all short signals of the 4/4 indicator
Four curves:
Blue = ROC (%)
Orange = RSI
Purple = MFI
Gray = AO
2、Explanation of the four core indicators (simple and easy-to-understand version)
Key points of interpretation of the role of indicators
The ROC price momentum rate of change reflects the speed of price rise/fall. ROC is greater than the threshold = long acceleration, less than the-threshold = short acceleration
RSI relative strength index RSI > 50 is too much, RSI <50 is empty
The MFI capital flow indicator combines transaction volume and price. MFI>50 indicates the net inflow of funds, and <50 indicates the net outflow of funds.
AO Super Oscillator fast line average price-slow line average price, greater than 0 is too much, less than 0 is too short
3、Parameter configuration guide
Explanation of common parameters:
ROC cycle /threshold: ROC calculation cycle and kinetic energy sensitivity. Short cycle + low threshold = sensitive (but noisy)
RSI cycle: the shorter the more sensitive, the longer the more stable
MFI cycle: it is recommended to be close to the RSI cycle
AO fast/slow cycle: commonly used 5/34, 5/21 is also available
Background color resonance judgment: ≥3 indicators in the same direction, time scale background
4、How to read the signal
Background color signal (distinguish between trend strength and weakness)
Green background: at least 3 indicators, long positions → multi-party dominance
Red background: At least 3 indicators, bears → bears dominate
No background: the kinetic energy is chaotic, and the probability of shock is large
Triangle mark (extremely strong signal)
Green triangle at the bottom: 4/4 multi-head → super multi-party kinetic energy
Red triangle at the top: 4/4 bears → Super empty kinetic energy
5、Actual usage cases
Short-term breakthrough trading
Observe the picture for 15 minutes, when the background turns green + a green triangle mark appears
There is no obvious empty signal at the upper level (1H)
Follow up at the breaking point and put the stop loss at the lowest
Distinction between callback and reversal
Pullback: The price has fallen but the background is still green, and many indicators have not all turned over.
Reversal: The price drops and the background turns red, and a red triangle appears at the same time
6、Precautions
The signal is not 100% accurate, it must be combined with multiple factors such as price structure, support and resistance.
⏳ Stronger resonance at different cycle levels (such as 15min warning + 1H confirmation)
⚠ The misjudgment rate of the volatile market is high, it is recommended to filter it in combination with the trend direction
Indicators are only an aid, not a substitute, please cooperate with your personal strategy and risk control
📊 多动能监控器(Multi-Momentum Monitor)使用说明
版本:v6 修正版
适用对象:币圈、股市、期货短线/波段交易者
作用:
把 ROC(动量变化率)、RSI(相对强弱)、MFI(资金流量)、AO(震荡指标)整合在一起
通过“多指标共振”判断当前市场动能的方向和强度
低延迟、易配置,适合盯盘辅助判断“回调 vs 反转”
0️⃣ 指标核心组成
ROC 动能速度 衡量价格变化速度,反应趋势衰竭最直接 周期(默认 5)
RSI 短周期 衡量上涨动能比例 周期(默认 5)+ 阈值(50)
MFI 短周期 加入成交量权重的 RSI 周期(默认 7)+ 阈值(50)
AO 方向强弱 快速可视化趋势动能方向 快线周期(默认 5)、慢线周期(默认 34)
1️⃣ 指标功能概览
图例说明:
背景色:绿色 = 多方动能强(≥3/4指标同向),红色 = 空方动能强(≤1/4指标同向)
三角标记:底部绿色三角 = 4/4指标全部多头信号;顶部红色三角 = 4/4指标全部空头信号
四条曲线:
蓝色 = ROC (%)
橙色 = RSI
紫色 = MFI
灰色 = AO
2️⃣ 四大核心指标解释(简单易懂版)
指标 作用 解读关键点
ROC 价格动量变化率 反映价格上涨/下跌的速度,ROC大于阈值=多头加速,小于-阈值=空头加速
RSI 相对强弱指标 RSI > 50 偏多,RSI < 50 偏空
MFI 资金流量指标 结合成交量和价格,MFI > 50 表示资金净流入,< 50 表示资金净流出
AO 超级震荡指标 快线均价 - 慢线均价,大于0偏多,小于0偏空
3️⃣ 参数配置指南
常用参数解释:
ROC 周期 / 阈值:ROC计算周期和动能敏感度。短周期 + 低阈值 = 灵敏(但噪音多)
RSI 周期:越短越敏感,越长越稳
MFI 周期:建议与RSI周期接近
AO快/慢周期:常用5/34,也可5/21
背景色共振判断:≥3个指标同方向时标背景
4️⃣ 如何读信号
📌 背景色信号(趋势强弱区分)
绿色背景:至少3个指标多头 → 多方主导
红色背景:至少3个指标空头 → 空方主导
无背景:动能混乱,震荡概率大
📌 三角标记(极强信号)
底部绿色三角:4/4 多头 → 超强多方动能
顶部红色三角:4/4 空头 → 超强空方动能
5️⃣ 实战用法案例
短线突破交易
观察15分钟图,当背景转绿 + 出现绿色三角标记
上级别(1H)无明显空方信号
在突破点跟进,止损放在前低
回调与反转区分
回调:价格回落但背景仍为绿色,多指标未全部翻空
反转:价格回落并背景翻红,同时出现红色三角
6️⃣ 注意事项
📉 信号不是100%准确,要结合价格结构、支撑阻力等多因素
⏳ 不同周期级别共振更强(如15min预警 + 1H确认)
⚠ 震荡市误判率高,建议结合趋势方向过滤
💡 指标只是辅助,不是替代品,请配合个人策略与风险控制
Mean Reversion & Momentum Hybrid | D_QUANT 📌 Mean Reversion & Momentum Hybrid | D_QUANT
📖 Description:
This indicator combines mean reversion logic, volatility filtering, and percentile-based momentum to deliver clear, context-aware buy/sell signals designed for trend-following and contrarian setups.
At its core, it merges:
A Bollinger Band % Positioning Model (BB%)
A 75th/25th Percentile Momentum System
A Volatility-Adjusted Trend Filter using RMA + ATR
All tied together with a dynamic gradient-style oscillator that visualizes signal strength and persistence over time — making it easy to track high-conviction setups.
Signals only trigger when all three core components align, filtering out noise and emphasizing high-probability turning points or trend continuations.
⚙️ Methodology Overview:
Bollinger Bands % (BB%):
Price is measured as a percentage between upper and lower Bollinger Bands (based on OHLC4). Entries are only considered when price exceeds custom BB% thresholds — emphasizing market extremes.
Volatility-Based Trend Filter (RMA + ATR):
A smoothed RMA baseline is paired with ATR to define trend bias. This ensures signals only occur when price deviates meaningfully beyond recent volatility.
Percentile Momentum Model (75th/25th Rank):
Price is compared against its rolling 75th and 25th percentile. If price breaks these statistical boundaries (adjusted by ATR), it triggers a directional momentum condition.
Signal Consensus Engine:
All three layers must agree — BB% condition, trend filter, and percentile momentum — before a buy or sell signal is plotted.
Gradient Oscillator Visualization:
Signals appear as a fading oscillator line with a gradient-filled area beneath it. The color intensity represents how “fresh” or “strong” the signal is, fading over time if not reconfirmed, offering both clarity and signal aging at a glance.
🔧 User Inputs:
🧠 Core Settings:
Source: Select the price input (default: close)
Bollinger Bands Length: Period for BB basis and deviation
Bollinger Bands Multiplier: Width of the bands
Minimum BB Width (% of Price): Prevents signals during low-volatility chop
📊 BB% Thresholds:
BB% Long Threshold (L): Minimum %B to consider a long
BB% Short Threshold (S): Maximum %B to consider a short
🔍 Trend Filter Parameters:
RMA Length: Period for the smoothed trend baseline
ATR Length: Lookback for ATR in trend deviation filter
⚡️ Momentum Parameters:
Momentum Length: Period for percentile momentum calculation
Mult_75 / Mult_25: ATR-adjusted thresholds for breakout above/below percentile levels
🎨 Visualization:
Bar Coloring: Highlights candles during active signals
Background Coloring: Optional background shading for signals
Show Oscillator Plot: Toggle the gradient-style oscillator
🧪 Use Case:
This indicator works well across all assets for trend identification. It is particularly effective when used on higher timeframes (e.g. 12H, 1D,2D) to capture mean reversion bounces or confirm breakouts backed by percentile momentum and volatility expansion.
⚠️ Notes:
This is not financial advice. Use in combination with proper risk management and confluence from other tools.

Adaptive Squeeze Momentum +Adaptive Squeeze Momentum+ (Auto-Timeframe Version)
Overview
Adaptive Squeeze Momentum+ is an enhanced volatility and momentum indicator designed to identify compression and expansion phases in price action. It is inspired by the classic Squeeze Momentum Indicator by LazyBear but introduces automatic parameter adaptation to any timeframe, making it simpler to use across different markets without manual configuration.
Concepts and Methodology
The script combines Bollinger Bands (BB) and Keltner Channels (KC) to detect periods when volatility contracts (squeeze) or expands (release).
A squeeze occurs when BB are inside KC, suggesting low volatility and potential breakout scenarios.
A squeeze release is detected when BB expand outside KC.
Momentum is derived using a linear regression applied to the difference between price and a midrange reference level.
Original Improvements
Compared to the original Squeeze Momentum Indicator, this version offers several enhancements:
Automatic Adaptation: BB and KC lengths and multipliers are dynamically adjusted based on the chart’s timeframe (from 1 minute up to 1 month), removing the need for manual tuning.
Simplified Visualization: A clean, minimalist histogram and clear squeeze state cross markers allow for faster interpretation.
Flexible Application: Designed to work consistently on intraday, daily, and higher timeframes across crypto, forex, stocks, and indices.
Features
Dynamic Squeeze Detection:
Gray Cross: Neutral (no squeeze detected)
Blue Cross: Active squeeze
Yellow Cross: Squeeze released
Momentum Histogram:
Positive/negative momentum shown with slope-based coloring.
Timeframe-Aware Parameters:
Automatically sets optimal BB/KC configurations.
Usage
Watch for blue crosses indicating an active squeeze phase that may precede a directional move.
Use the histogram color and slope to gauge momentum strength and direction.
Combine squeeze release signals with momentum confirmation for potential entries or exits.
Credits and Licensing
This script was inspired by LazyBear’s OLD “Squeeze Momentum Indicator” (). The implementation here significantly expands upon the original by introducing auto-adaptive parameters, restructured logic, and a new visualization approach. Published under the Mozilla Public License 2.0.
Disclaimer
This indicator is for educational purposes only and does not constitute financial advice. Use at your own risk.

True Momentum IndexTrue Momentum Index (TMI) — Precision Trading by Trading_Tomm
The True Momentum Index (TMI) is a cutting-edge technical indicator developed for traders who demand accuracy, clarity, and consistency across all market conditions. Designed by Trading_Tomm , this indicator provides a reliable method to identify high-probability entry and exit points by analyzing real-time momentum shifts and volatility levels.
Key Benefits:
1. Multi-Timeframe Versatility: Whether you're scalping on a 1-minute chart or investing on the weekly, TMI adapts seamlessly to your strategy.
2. Enhanced Risk Management: By highlighting optimal trade zones, TMI helps improve your reward-to-risk ratio and reduce exposure to false signals.
3. Clear Trend Detection: Instantly distinguish between trending, ranging, or consolidating markets.
4. Breakout Confirmation: Spot true breakout opportunities with confidence, supported by Bollinger Band overlays.
5. Universal Applicability: Works effectively with stocks, forex, cryptocurrency, commodities, and indices.
TMI’s intuitive visual presentation and precision signals make it an essential tool for both new and experienced traders. Whether you're trading volatile crypto markets or steady equities, the True Momentum Index gives you the edge to trade with discipline, clarity, and confidence.
Start using the True Momentum Index and take your trading strategy to the next level -maximize potential, minimize uncertainty.

Dynamic Momentum GaugeOverview
The Dynamic Momentum Gauge is an indicator designed to provide information and insights into the trend and momentum of a financial asset. While this indicator is not directional , it helps you know when there will be a trend, big move, or when momentum will have a run, and when you should take profits.
How It Works
This indicator calculates momentum and then removes the negative values to focus instead on when the big trend could likely happen and when it could end, or when you should enter a trade based on momentum or exit. Traders can basically use this indicator to time their market entries or exits, and align their strategies with momentum dynamics.
How To Use
As previously mentioned, this is not a directional indicator but more like a timing indicator. This indicator helps you find when the trend moves, and big moves in the markets will occur and its possibly best to exit the trades. For example, if you decide to enter a long trade if the Dynamic Momentum Gauge value is at an extreme low and another momentum indicator that you use has conditions that you would consider to long with, then this indicator is basically telling you that there isn't more space for the momentum to squeeze any longer, can only really expand from that point or stay where it currently is, but this is also a mean reverting process so it does tend to go back up from the low point.
Settings:
Length: This is the length of the momentum, by default its at 100.
Normalization Length: Length of the Normalization which ensures the the values fall within a consistent range.

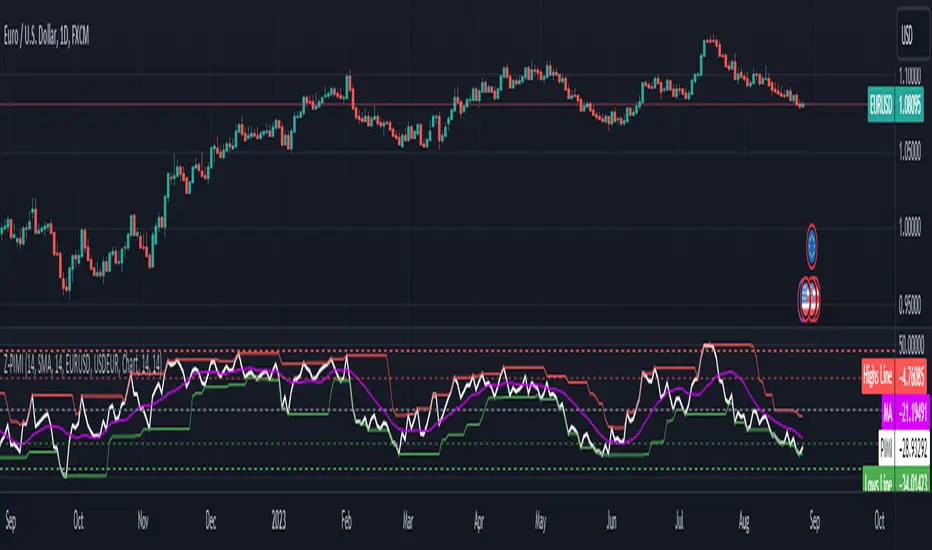
Zaree - Predictive Imparity Momentum IndicatorThe "Zaree - Predictive Imparity Momentum Indicator" (Z-PIMI) is a custom indicator designed to measure the momentum difference between two currency pairs. Let's break down its components and functionality:
Inputs:
pimiLength: Defines the period for the RSI calculation.
selectedMAType: Allows the user to choose the type of moving average (SMA, EMA, WMA, VWMA) they want to apply to the PIMI.
maLength: Defines the period for the chosen moving average.
baseCurrency & quoteCurrency: These are the two currency pairs that the user wants to compare.
Timeframe Selection:
The user can select a specific timeframe for the analysis, or they can use the chart's current timeframe.
Calculation of Currency Indices:
The closing prices of the Base Currency and Quote Currency are fetched for the selected timeframe.
The RSI (Relative Strength Index) is calculated for both currencies using the pimiLength.
The PIMI is then calculated by subtracting the RSI of the Quote Currency from the RSI of the Base Currency.
Moving Average Calculation:
A moving average of the PIMI is calculated based on the user's selected type (selectedMAType) and period (maLength).
Style Settings:
These are hardcoded values that define the levels for the upper and lower bands. These bands can help identify overbought or oversold conditions.
Highs and Lows Calculation:
The highest and lowest values of the PIMI over specified periods (highsLength and lowsLength) are calculated. These can help identify extreme values or turning points.
Plotting:
The PIMI is plotted as a white line.
The moving average of the PIMI is plotted as a purple line.
The upper and lower bands are plotted as horizontal lines at specified levels.
The highest and lowest values of the PIMI are plotted as red and green lines, respectively.
Interpretation:
The PIMI provides a measure of the momentum difference between two currency pairs. When the PIMI is rising, it indicates that the Base Currency is gaining momentum relative to the Quote Currency, and vice versa.
The moving average can be used as a signal line. For instance, when the PIMI crosses above its moving average, it might be considered a bullish signal, and when it crosses below, it might be considered bearish.
The upper and lower bands, as well as the highs and lows lines, can help identify overbought or oversold conditions. For example, if the PIMI reaches or exceeds the upper band, it might indicate overbought conditions, suggesting a potential reversal or pullback.
Overall, the Z-PIMI offers a tool to compare the momentum of two currency pairs and identify potential trading opportunities based on their relative strength and established thresholds.
True Momentum OscillatorThe True Momentum Oscillator (TMO) calculates the delta of the price using the open and close. We have taken the true momentum oscillator a step further and have added the momentum of the main signal (TMO) and the smooth signal line. We believe this helps give a clearer picture of price momentum and helps verify crossovers of the TMO and the smooth signal line. The momentum lines can also help confirm a divergence of the TMO. We have also added multiple moving average options so the user can customize the TMO to suit their needs.
TMO- Green when above Smooth Signal Line, red when below Smooth Signal Line
Smooth Signal- Gray Line
Histogram- TMO-Smooth Signal
TMO Momentum- Orange line
Smooth Signal Momentum- Yellow line
Overbought/Oversold regions- Gray highlighted boundaries
The TMO has defined overbought and oversold regions where either a crossover signal or divergence in the oscillator itself can be taken as a signal. Similar to the MACD, a crossover of the zero line by the TMO can also be utilized as a signal.

TradeChartist Mean Momentum Drift Bands (MMDB)™TradeChartist Mean Momentum Drift Bands (MMDB) is a Momentum indicator that plots a Mean Momentum line (calculated automatically from sample means of many lookback periods decided by the script logic) and Upper/Lower Drift Bands (calculated using standard deviation). The script helps spot price volatility, Oversold/Overbought zones and also generates high probability breakout signals without any user input.
===================================================================================================================
Features of ™TradeChartist MMDB
==============================
Momentum Mean and 4 upper/lower Drift bands.
No User input required.
3 Visual colour schemes - Chilli, Flame and Custom.
MMDB table that shows asset's price, RSI and values of Mean & Upper/Lower Drift bands
Breakout Signals (Bull and Bear arrows) based on price closing above or below the 1st Drift Band.
Overbought and Oversold zones.
Colour Bars based on Momentum strength.
Alerts for Bull and Bear Breakouts ( Once per bar close to be used).
===================================================================================================================
Example Charts
1. MMDB used along with ™TradeChartist MMDO (Mean Momentum Drift Oscillator) on 4hr chart of BINANCE:BTCUSDT
2. MMDB on 4hr chart of OANDA:XAUUSD
3. MMDB on 1hr chat of OANDA:SPX500USD
4. MMDB connected to ™TradeChartist Plug and Trade on BINANCE:LINKUSDTPERP
===================================================================================================================
Note: The script doesn't repaint, so the alerts can be used with confidence. To check this, users can do bar replay to confirm if the plots and markers stay in the same place.
===================================================================================================================
Best Practice: Test with different settings first using Paper Trades before trading with real money
===================================================================================================================
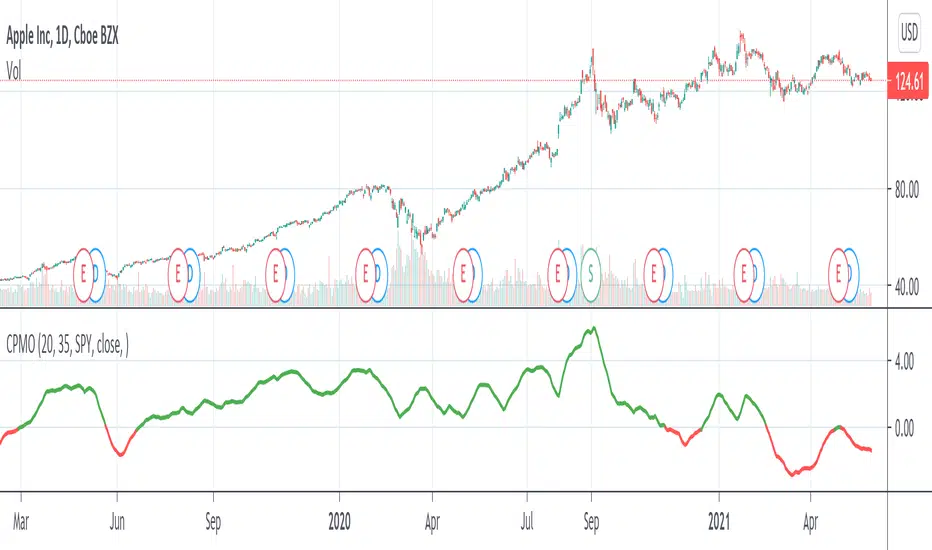
Compare Price Momentum Oscillator [CC]The Compare Price Momentum Oscillator was created by Vitali Apirine (Stocks and Commodities Aug 2020 pg 16) and this is a handy indicator to compare the momentum of the current symbol you are looking at to the s&p to determine the relative strength of the underlying security. Buy when the line turns green and sell when it turns red.
Let me know if there are any other scripts you would like to see me publish!
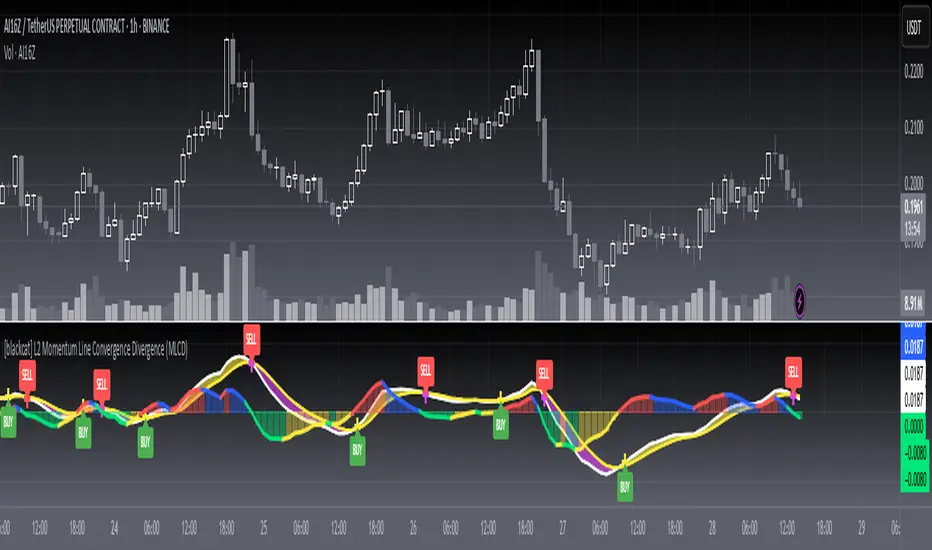
[blackcat] L2 Momentum Line Convergence Divergence (MLCD)Level: 2
Background
Momentum indicators are technical analysis tools that can be used to determine the strength or weakness of the stock price. Momentum measures the speed at which stock prices rise or fall. Common momentum indicators are the relative strength index (RSI) and the moving average of convergence divergence (MACD).
Function
L2 Momentum Line Convergence Divergence (MLCD) is one of my innovative indicator which is to differeniate with average of convergence divergence (MACD). So, I named it as Momentum Line Convergence Divergence (MLCD). In order for everyone to be more familiar with its useage, I inherited the traditional MACD expression method, and added golden cross (yellow cross) and dead cross (fuchsia cross) prompts, as well as bottom divergence (lime cross) and top divergence (red cross) prompts.
Key Signal
mtm --> momentum fast line
mtmaux --> momentum slow line
mtmgx --> momentum gold cross in yellow
mtmdx --> momentum dead cross in fuchsia
mtmbotdiverg --> momentum bottom divergence alert in lime cross
mtmtopdiverg --> momentum top divergence alert in red cross
Pros and Cons
Pros:
1. very stable for market price change and trend following
2. visual bottom and top divergence alerts are provided
Cons:
To be found yet
Remarks
Blackcat1402 brand MLCD indicator
Readme
In real life, I am a prolific inventor. I have successfully applied for more than 60 international and regional patents in the past 12 years. But in the past two years or so, I have tried to transfer my creativity to the development of trading strategies. Tradingview is the ideal platform for me. I am selecting and contributing some of the hundreds of scripts to publish in Tradingview community. Welcome everyone to interact with me to discuss these interesting pine scripts.
The scripts posted are categorized into 5 levels according to my efforts or manhours put into these works.
Level 1 : interesting script snippets or distinctive improvement from classic indicators or strategy. Level 1 scripts can usually appear in more complex indicators as a function module or element.
Level 2 : composite indicator/strategy. By selecting or combining several independent or dependent functions or sub indicators in proper way, the composite script exhibits a resonance phenomenon which can filter out noise or fake trading signal to enhance trading confidence level.
Level 3 : comprehensive indicator/strategy. They are simple trading systems based on my strategies. They are commonly containing several or all of entry signal, close signal, stop loss, take profit, re-entry, risk management, and position sizing techniques. Even some interesting fundamental and mass psychological aspects are incorporated.
Level 4 : script snippets or functions that do not disclose source code. Interesting element that can reveal market laws and work as raw material for indicators and strategies. If you find Level 1~2 scripts are helpful, Level 4 is a private version that took me far more efforts to develop.
Level 5 : indicator/strategy that do not disclose source code. private version of Level 3 script with my accumulated script processing skills or a large number of custom functions. I had a private function library built in past two years. Level 5 scripts use many of them to achieve private trading strategy.
ZynIQ Momentum Master v2 - (Lite Pack)Overview
ZynIQ Momentum Master v2 (Lite) is a streamlined momentum tool built to highlight shifts in directional strength using volatility-adjusted inputs. It offers clean signal structure for intraday and swing traders without overwhelming visual noise.
Key Features
• Multi-profile modes (Scalping / Intraday / Swing) with tailored settings
• Momentum state detection using volatility-aware logic
• Directional bias highlighting to complement trend analysis
• Lightweight visuals for fast chart interpretation
• Optional ZynIQ HUD panel for quick momentum overview
• Clean, non-intrusive labels marking momentum transitions
Use Cases
• Identifying strengthening or weakening market momentum
• Aligning entries with directional bias
• Filtering breakout or mean-reversion signals
• Enhancing multi-indicator frameworks with momentum confirmation
Notes
Momentum Master v2 (Lite) provides structural assistance for reading momentum shifts. It is not a standalone trading system. Combine it with your own analysis and risk management.

Momentum Fusion v1Momentum Fusion v1
Overview
Momentum Fusion v1 (MFusion) is a multi-oscillator indicator that combines several components to analyze market momentum and trend strength. It incorporates modified versions of classic indicators such as PVI (Positive Volume Index), NVI (Negative Volume Index), MFI (Money Flow Index), RSI, Stochastic, and Bollinger Bands Oscillator. The indicator displays a histogram that changes color based on momentum strength and includes "FUSION🔥" signal labels when extreme values are reached.
Indicator Settings
Parameters:
EMA Length – Smoothing period for the moving average (default: 255).
Smoothing Period – Internal calculation smoothing parameter (default: 15).
BB Multiplier – Standard deviation multiplier for Bollinger Bands (default: 2.0).
Show verde / marron / media lines – Toggles the display of auxiliary lines.
Show FUSION🔥 label – Enables/disables signal labels.
Indicator Components
1. PVI (Positive Volume Index)
Formula:
pvi := volume > volume ? nz(pvi ) + (close - close ) / close * sval : nz(pvi )
Description:
PVI increases when volume rises compared to the previous bar and accounts for price percentage change. The stronger the price movement with increasing volume, the higher the PVI value.
2. NVI (Negative Volume Index)
Formula:
nvi := volume < volume ? nz(nvi ) + (close - close ) / close * sval : nz(nvi )
Description:
NVI tracks price movements during declining volume. If the price rises on low volume, it may indicate a "stealth" trend.
3. Money Flow Index (MFI)
Formula:
100 - 100 / (1 + up / dn)
Description:
An oscillator measuring money flow strength. Values above 80 suggest overbought conditions, while values below 20 indicate oversold conditions.
4. Stochastic Oscillator
Formula:
k = 100 * (close - lowest(low, length)) / (highest(high, length) - lowest(low, length))
Description:
A classic stochastic oscillator showing price position relative to the selected period's range.
5. Bollinger Bands Oscillator
Formula:
(tprice - BB midline) / (upper BB - lower BB) * 100
Description:
Indicates the price position relative to Bollinger Bands in percentage terms.
Key Lines & Histogram
1. Verde (Green Line)
Calculation:
verde = marron + oscp (normalized PVI)
Interpretation:
Higher values indicate stronger bullish momentum. A FUSION🔥 signal appears when the value reaches 750+.
2. Marron (Brown Line)
Calculation:
marron = (RSI + MFI + Bollinger Osc + Stochastic / 3) / 2
Interpretation:
A composite oscillator combining multiple indicators. Higher values suggest overbought conditions.
3. Media (Red Line)
Calculation:
media = EMA of marron with smoothing period
Interpretation:
Acts as a signal line for trend confirmation.
4. Histogram
Calculation:
histo = verde - marron
Colors:
Bright green (>100) – Strong bullish momentum.
Light green (>0) – Moderate bullish momentum.
Orange (<0) – Bearish momentum.
Red (<-100) – Strong bearish momentum.
Signals & Alerts
1. FUSION🔥 (Strong Momentum)
Condition:
verde >= 750
Visualization:
A "FUSION🔥" label appears below the chart.
Alert:
Can be set to trigger notifications when the condition is met.
2. Background Aura
Condition:
verde > 850
Visualization:
The chart background turns teal, indicating extreme momentum.
Usage Recommendations
FUSION🔥 Signal – Can be used as a long entry point when confirmed by other indicators.
Histogram:
1. Green bars – Potential long entry.
2. Red/orange bars – Potential short entry.
3. Media & Marron Crossover – Can serve as an additional trend filter.
4. Suitable for a 5-15 minute time frame
Conclusion
Momentum Fusion v1 is a powerful tool for momentum analysis, combining multiple indicators into a unified system. It is suitable for:
Trend traders (catching strong movements).
Scalpers (identifying short-term impulses).
Swing traders (filtering entry points).
The indicator features customizable settings and visual signals, making it adaptable to various trading styles.

Kalman MomentumKalman Filter
The Kalman Filter is an algorithm used for recursive estimation and filtering of time-series data. It was developed by Rudolf E. Kálmán in the 1960s and has found widespread applications in various fields, including control systems, navigation, signal processing, and finance.
The primary purpose of the Kalman filter is to estimate the state of a dynamic system based on a series of noisy measurements over time. It operates recursively, meaning it processes each new measurement and updates its estimate of the system state as new data becomes available.
Kalman Momentum Indicator
This indicator implements the Kalman Filter to provide a smoothed momentum indicator using returns. The momentum in this indicator is calculated by getting the logarithmic returns and then getting the expected value.
The Kalman calculation in this indicator is used to filter and predict the next value based on the logarithmic returns expected value.
Here's a simplified explanation of the steps and how they are applied in the Script:
State Prediction: Predict the current state based on the previous state estimate.
Error Covariance Prediction: Predict the covariance of the prediction error.
Correction Step:
Kalman Gain Calculation: Calculate the Kalman gain, which determines the weight given to the measurement.
State Correction: Update the state estimate based on the measurement.
Error Covariance Correction: Update the error covariance.
In this Script, the Kalman Filter is applied to estimate the state of the system, with two state variables.
When the Kalman Momentum is above 0, there is positive momentum or positive smoothed expected value.
When the Kalman Momentum is below 0, there is negative momentum or negative smoothed expected value.
How to Use:
Trend Identification:
Positive values of the Kalman Momentum Indicator indicates positive expected value, while negative values suggest negative expected value.
You can look for changes in the sign of the indicator to identify potential shifts in market direction.
Volatility Analysis:
Observe the behavior of the indicator during periods of high and low volatility. Changes in the volatility of the Kalman Momentum Indicator may precede changes in market conditions.
Filtering Noise:
The Kalman Filter is known for its ability to filter out noise in time series data. Use the Kalman Momentum Indicator to filter out the noise in momentum to catch the trend more clearly.
Squeezes:
At time there may be squeezes, and these are zones with low volatility. What could follow after these zones are expansions and huge trending moves.
Indicator Settings:
You can change the source of the calculations.
There is also a lookback for the log returns.
Understanding Expected Value in Trading:
The Expected Value is a fundamental concept that shows the potential outcomes of a trading strategy or individual trade over a series of occurrences. It is a measure that represents the average outcome when a particular action is repeated multiple times.
Images of the indicator:

Z-Score Based Momentum Zones with Advanced Volatility ChannelsThe indicator "Z-Score Based Momentum Zones with Advanced Volatility Channels" combines various technical analysis components, including volatility, price changes, and volume correction, to calculate Z-Scores and determine momentum zones and provide a visual representation of price movements and volatility based on multi timeframe highest high and lowest low values.
Note: THIS IS A IMPROVEMNT OF "Multi Time Frame Composite Bands" INDICATOR OF MINE WITH MORE EMPHASIS ON MOMENTUM ZONES CALULATED BASED ON Z-SCORES
Input Options
look_back_length: This input specifies the look-back period for calculating intraday volatility. correction It is set to a default value of 5.
lookback_period: This input sets the look-back period for calculating relative price change. The default value is 5.
zscore_period: This input determines the look-back period for calculating the Z-Score. The default value is 500.
avgZscore_length: This input defines the length of the momentum block used in calculations, with a default value of 14.
include_vc: This is a boolean input that, if set to true, enables volume correction in the calculations. By default, it is set to false.
1. Volatility Bands (Composite High and Low):
Composite High and Low: These are calculated by combining different moving averages of the high prices (high) and low prices (low). Specifically:
a_high and a_low are calculated as the average of the highest (ta.highest) and lowest (ta.lowest) high and low prices over various look-back periods (5, 8, 13, 21, 34) to capture short and long-term trends.
b_high and b_low are calculated as the simple moving average (SMA) of the high and low prices over different look-back periods (5, 8, 13) to smooth out the trends.
high_c and low_c are obtained by averaging a_high with b_high and a_low with b_low respectively.
IDV Correction Calulation : In this script the Intraday Volatility (IDV) is calculated as the simple moving average (SMA) of the daily high-low price range divided by the closing price. This measures how much the price fluctuates in a given period.
Composite High and Low with Volatility: The final c_high and c_low values are obtained by adjusting high_c and low_c with the calculated intraday volatility (IDV). These values are used to create the "Composite High" and "Composite Low" plots.
Composite High and Low with Volatility Correction: The final c_high and c_low values are obtained by adjusting high_c and low_c with the calculated intraday volatility (IDV). These values are used to create the "Composite High" and "Composite Low" plots.
2. Momentum Blocks Based on Z-Score:
Relative Price Change (RPC):
The Relative Price Change (rpdev) is calculated as the difference between the current high-low-close average (hlc3) and the previous simple moving average (psma_hlc3) of the same quantity. This measures the change in price over time.
Additionally, std_hlc3 is calculated as the standard deviation of the hlc3 values over a specified look-back period. The standard deviation quantifies the dispersion or volatility in the price data.
The rpdev is then divided by the std_hlc3 to normalize the price change by the volatility. This normalization ensures that the price change is expressed in terms of standard deviations, which is a common practice in quantitative analysis.
Essentially, the rpdev represents how many standard deviations the current price is away from the previous moving average.
Volume Correction (VC): If the include_vc input is set to true, volume correction is applied by dividing the trading volume by the previous simple moving average of the volume (psma_volume). This accounts for changes in trading activity.
Volume Corrected Relative Price Change (VCRPD): The vcrpd is calculated by multiplying the rpdev by the volume correction factor (vc). This incorporates both price changes and volume data.
Z-Scores: The Z-scores are calculated by taking the difference between the vcrpd and the mean (mean_vcrpd) and then dividing it by the standard deviation (stddev_vcrpd). Z-scores measure how many standard deviations a value is away from the mean. They help identify whether a value is unusually high or low compared to its historical distribution.
Momentum Blocks: The "Momentum Blocks" are essentially derived from the Z-scores (avgZScore). The script assigns different colors to the "Fill Area" based on predefined Z-score ranges. These colored areas represent different momentum zones:
Positive Z-scores indicate bullish momentum, and different shades of green are used to fill the area.
Negative Z-scores indicate bearish momentum, and different shades of red are used.
Z-scores near zero (between -0.25 and 0.25) suggest neutrality, and a yellow color is used.

Banded Chikou Breakout — Quantifying Ichimoku MomentumTitle: Banded Chikou Breakout — Quantifying Ichimoku Momentum
Overview:
Banded Chikou Breakout (BCB) is a unique, algorithmic script designed to augment the capabilities of traders seeking substantial breakout opportunities. Constructed on the robust principles of the Ichimoku trading strategy, BCB is designed to quantify and filter the Chikou Span's significant breakouts above or below the price action. This script does not aim to replace the Ichimoku system; instead, it enhances it, providing an optimized tool for momentum trading.
Rationale:
Ichimoku traders often scrutinize the Chikou Span's position relative to price action to identify market trends. However, determining whether the Chikou Span is above or below due to a genuine trend or mere market noise can be challenging in choppy markets. BCB resolves this predicament by offering a unique way to interpret the Chikou Span's movement. It does so by quantifying the Chikou Span's momentum and utilizing Bollinger Bands to determine its significance. By effectively differentiating substantial movements from the insignificant, BCB can help traders better navigate the market and increase their potential for profitable trades.
How it Works:
BCB combines three key elements: a Momentum Script (simulating Chikou Span), a Bollinger Band Script, and a Timeframe Switcher, all working together to provide a refined trading perspective.
Momentum Script: Calculates the price difference between the current price and the price 'n' periods ago, transforming the Chikou Span into a quantifiable momentum value that signifies the strength and speed of a market move.
Bollinger Band Script: Computes a Simple Moving Average (SMA) around the momentum, plotting two 'bands' at a specified standard deviation from this SMA. This functionality allows traders to discern when the Chikou Span's momentum is abnormally high or low, signifying a potential significant breakout.
Timeframe Switcher: This feature lets traders apply the BCB script to a different timeframe from the one they are currently viewing. This capability can help traders identify higher timeframe breakouts and trade them with precision on the lower timeframe.
How to Use:
BCB is designed to complement the Ichimoku strategy for effective breakout identification.
Add the BCB script to your trading chart. It plots the momentum (yellow line) and Bollinger Bands (green lines) with the area between the bands shaded blue.
Utilize the Ichimoku strategy to identify larger and smaller timeframe trends.
Optional: Leverage the timeframe switcher to synchronize your trades with higher timeframe trends while operating on lower timeframes.
If the BCB momentum line crosses the upper Bollinger Band while the Ichimoku indicates a bullish trend, it signifies a potential significant upward breakout. Similarly, a cross below the lower band during a bearish trend could denote a significant downward breakout.
Remember, without the context provided by the Ichimoku system's trend analysis, BCB can yield false breakouts. It is, therefore, crucial to use these tools in tandem. I like to check for an Ichimoku trend on the 4H and 1H charts, and then use BCB on charts <60 minutes to capture trends with precision.

Adaptive Momentum Channel - [Volume Filter]The Adaptive Momentum Channel with Volume Filter (Adaptive MCVF) is an indicator that utilizes an adaptive RSI to adjust its sensitivity based on the market conditions. The RSI component of the indicator calculates the standard deviation and mean deviation of RSI values and uses these to calculate the adaptive RSI. The volume filter component of the indicator filters the adaptive RSI based on the volume average, allowing the indicator to identify trend changes and filter out market noise.
The indicator plots the upper and lower bands of the Adaptive MCVF, which are calculated by taking the moving average of the filtered RSI and applying an offset based on the standard deviation. A fast moving average is also plotted, which can be used to identify short-term changes in the trend.
The Adaptive MCVF also includes a divergence identification feature, which can be used to identify potential trend changes. The indicator plots regular bullish and bearish divergences, as well as hidden bullish and bearish divergences.
This is a variant of my previous MCVF indicator, this one simply allows you to take the standard deviation of the momentum and use it to make the indicator a bit more adaptive!
I made it protected to hide the standard deviation math and the auto divergence code.
You can always use this indicator by pressing "favorite";)

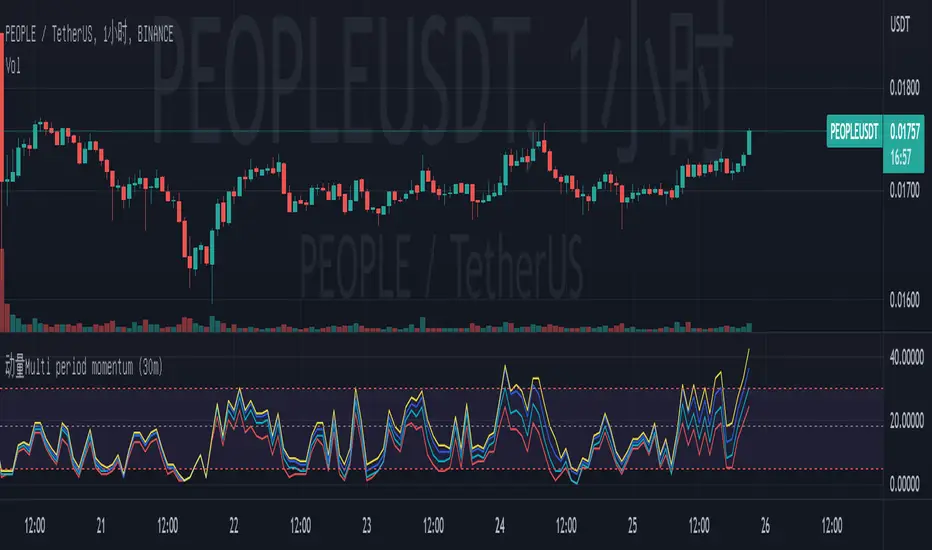
Multi period momentum (30m)I found that when there is oversold or overbought, there is always a good point to buy. Buyers can enter the market after oversold drops or overbought turns. It is recommended not to intervene when overbought or oversold is started, because this may be a deviation.
The basic logic of the strategy is to detect multi period and multi empty conditions. When the multiple or short forces reach an extreme value, we think there will be a good reversal. Based on this, we believe that the best use here is 30m cycle.
I will release the version of multiple cycles in the future. My favorite friends can pay attention to it.
1. Based on multi period resonance;
2. The total score of momentum coefficient is 36, and the lowest score is 0; If the coefficient score is greater than 18, it is a long trend; if the coefficient score is less than 18, it is a short trend. It is recommended to look long if the coefficient score is greater than 18 and short if the coefficient score is less than 10;
3. The closer the momentum coefficient is to the extreme value, the greater the possibility of inversion. Therefore, it can be considered that when it is greater than 30, empty orders can be placed, and when it is less than 5, multiple orders can be placed;
4. This index calculates the resonance coefficient in combination with multiple periods of 5m, 15m, 30m, 1h, 2h and 4h. The most suitable period is 30m, because this period is the middle value;
5. You can use the 30m cycle to look at the overall direction and the 5m cycle to find the exact trading opportunities.