MFI + RSI + MOM With Bull & Bear Trend LabelMOMENTUM + MONEY FLOW INDEX + RELATIVE STRENGTH INDEX WITH BULL & BEAR LABELS
This is a combination of 3 popular indicators. Momentum(MOM), Money Flow Index(MFI) and Relative Strength Index(RSI) along with color changing labels that tell you each indicator's current trend.
The middle white line shows the level that each indicator needs to stay above to be bullish and below for bearish. Watch for all three indicators to cross and hold above or below the mid line for big moves.
It is important to note that these indicators do not need to be going up to be bullish or down to be bearish. They just need to hold above or below the mid line to understand the overall trend.
The momentum indicator is the most relevant in my opinion. If it is holding above the mid line steadily, usually the overall trend will continue upwards so look to buy the dips if the momentum cloud is staying above the white line and vice versa.
It is also important to note that the default settings for this indicator are the 100 period as I find it to be super relevant across most charts but these numbers can be changed in the indicator settings.
Since momentum swings wildly past the normal 0-100 range, it is important to note that the momentum line has been “normalized” to stay within this same range as the rsi and mfi. So if you look at a normal momentum indicator side by side with this indicator it will not look the same however, I find it to be a very good indicator of overall direction so I know the current market sentiment even when price is diverging from the indicator directions.
All of the colors, sources and lengths can be easily customized in the indicator settings input tab.
***HOW TO USE***
When Momentum is above the mid line, it is bullish. When Momentum is below the mid line, it is bearish.
A label on the right side will update in real time to tell you if momentum is Bullish or Bearish for faster recognition of the trend.
When RSI is above the mid line, it is bullish. When Momentum is below the mid line it is bearish.
A label on the right side will update in real time to tell you if RSI is Bullish or Bearish for faster recognition of the trend.
When MFI is above the mid line, it is bullish. When MFI is below the mid line it is bearish.
A label on the right side will update in real time to tell you if MFI is Bullish or Bearish for faster recognition of the trend.
This indicator was built to help you quickly identify the Bullish or Bearish nature of the current trend with a live color changing label so you can glance at the label and understand it's direction without analyzing the indicator data.
***MARKETS***
This indicator can be used as a signal on all markets, including stocks, crypto, futures and forex.
***TIMEFRAMES***
This mom + mfi + rsi indicator can be used on all timeframes.
***TIPS***
Try using numerous indicators of ours on your chart so you can instantly see the bullish or bearish trend of multiple indicators in real time without having to analyze the data. Some of our favorites are our Auto Fibonacci, Directional Movement Index, Volume Profile, Auto Support And Resistance and Money Flow Index in combination with this indicator. They all have real time Bullish and Bearish labels as well so you can immediately understand each indicator's trend.
Cari dalam skrip untuk "momentum"

Volume ⨃ αMomentum 🦝🦾First attempt playing around with mixing volume and momentum... I find it to be nonsense, but putting it up for the moment.


Ehlers Smoothed Adaptive Momentum [LazyBear]Bored of Ehlers yet? :) I still have plenty of Ehlers in my collection, was thinking of publishing one of his Fishers or Adaptive RVI next, but @ChartArt requested Smoothed Adaptive Momentum (SAM), so here we go...
This is my 200th script (not including the variations and other custom scripts I shared over PM). My complete list of indicators here - bit.ly
Now, about the indicator :)
This smoothed adaptive momentum is straightforward to use (per Ehlers original rules). If it crosses above zero buy the next open, if it crosses below zero sell the next open. Of course, I strongly suggest filtering the signals.
Finally, here's an Ehlers-only chart to help determine where BTC is heading :P
More info:
- Ehlers CG Oscillator:
- Cybernetic Analysis for Stocks and Futures (Ehlers)
List of my public indicators: bit.ly
List of my app-store indicators: blog.tradingview.com
--Updated chart--
Here's the chart with barcolors ON (forgot to turn it on in the published one)

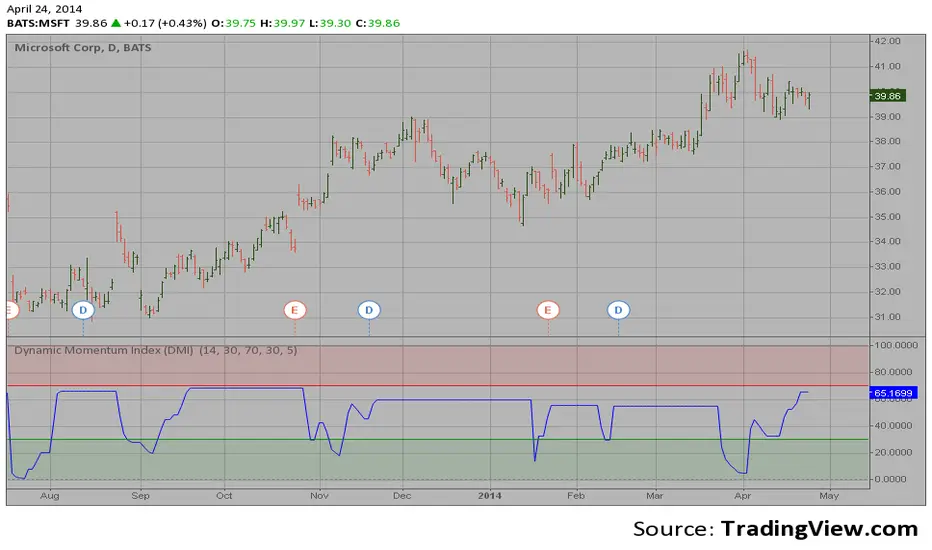
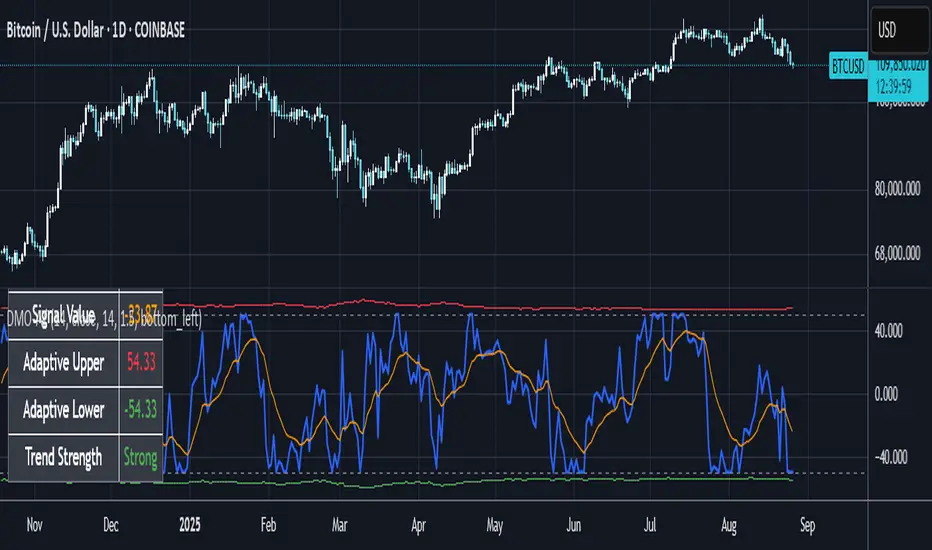
Dynamic Momentum Index (DMI) This indicator plots Dynamic Momentum Index indicator. The Dynamic Momentum
Index (DMI) was developed by Tushar Chande and Stanley Kroll. The indicator
is covered in detail in their book The New Technical Trader.
The DMI is identical to Welles Wilder`s Relative Strength Index except the
number of periods is variable rather than fixed. The variability of the time
periods used in the DMI is controlled by the recent volatility of prices.
The more volatile the prices, the more sensitive the DMI is to price changes.
In other words, the DMI will use more time periods during quiet markets, and
less during active markets. The maximum time periods the DMI can reach is 30
and the minimum is 3. This calculation method is similar to the Variable
Moving Average, also developed by Tushar Chande.
The advantage of using a variable length time period when calculating the RSI
is that it overcomes the negative effects of smoothing, which often obscure short-term moves.
The volatility index used in controlling the time periods in the DMI is based
on a calculation using a five period standard deviation and a ten period average
of the standard deviation.
Market State Momentum OscillatorMarket State Momentum Oscillator (MSMO)
Overview
The MSMO combines three elements in one panel:
Momentum oscillator (gray/blue area with aqua signal line)
Market State filter (green/red background area)
Money Flow Index (orange line)
Works on all markets and all timeframes. Non-repainting at bar close.
Colors and meaning
Gray area: Momentum above 0 (bullish bias)
Blue area: Momentum below 0 (bearish bias)
Aqua line: Signal line smoothing the oscillator
Green background: Market state bullish (price above moving average)
Red background: Market state bearish (price below moving average)
Orange line: Money Flow Index (volume-weighted momentum)
How to use
Always wait for confirmation of the green or red market state before acting.
Trend alignment: Watch the slope of the Weekly and Daily 200 MA and Weekly and Daily 50 MA to understand higher-timeframe trend direction. Trade only in alignment with the broader trend.
Entries:
Long: Green state + gray histogram rising + MFI trending up
Short: Red state + blue histogram falling + MFI trending down
Exits: Histogram crossing back through 0, or state background flips against the position.
Users can add chart alerts on plot crossings if needed.
Inputs
Lengths for oscillator pivot, signal smoothing, state moving average, trend weight, return %, and Money Flow Index. Defaults work for most charts.
Note
Educational use only. Not financial advice.
Tags
trend, oscillator, market state, momentum, money flow, crypto, forex, stocks, indices, futures

Momentum Trend Strength (MTS) *Julian_Acunja*Momentum Trend Strength (MTS)
The Momentum Trend Strength (MTS) indicator visually represents market momentum directly on your chart. By clearly highlighting momentum direction and intensity, traders can easily recognize shifts in market sentiment and anticipate potential turning points.
Traders can easily adjust the sensitivity and smoothing parameters, making it adaptable to diverse market conditions and trading strategies.
🔹 USAGE
The Momentum Trend Strength indicator helps traders intuitively detect market momentum, enhancing their ability to anticipate and respond dynamically to changing market conditions. Traders typically interpret three main scenarios using this indicator:
🚀 Momentum Acceleration:
An expanding green line above recent price action signals increasing bullish momentum, suggesting buyers are gaining strength. Conversely, a downward-expanding red line below price action indicates stronger bearish momentum, signifying increasing selling pressure.
🔄 Momentum Reversal:
A clear shift from red to green (or vice versa) often signals potential momentum reversals, providing traders with timely indications of possible market turns or shifts in sentiment.
⚖️ Momentum Consolidation:
When the indicator remains near the price line, it suggests weak momentum and potential market consolidation. Traders might interpret this as a range-bound market environment, adjusting their strategies accordingly.
By carefully monitoring these momentum shifts, traders can gain deeper insights into the underlying market dynamics and better prepare for future price movements.
🔹 DETAILS
The indicator’s momentum visualization is presented directly over the current price action, enhancing traders' ability to rapidly interpret momentum without additional chart clutter:
✅ Green Line: Positive momentum (bullish bias).
❌ Red Line: Negative momentum (bearish bias).
The vertical distance between the Momentum Trend Strength line and price visually indicates momentum intensity:
Larger distance: Signifies stronger market momentum.
Smaller distance: Suggests weakening momentum or neutral conditions.
🔹 Interpretation
Key interpretations include:
Bullish Confirmation: Sustained green lines indicate robust buying activity and confirm bullish trends.
Bearish Confirmation: Persistent red lines suggest strong selling pressure and validate bearish market sentiment.
Early Reversal Signals: Color transitions alert traders to potential market reversals, providing early opportunities to reassess trades.
🔹 Practical Application
Traders commonly integrate Momentum Trend Strength (MTS) into their broader trading strategies by:
Confirming directional trends alongside price action analysis.
Identifying optimal trade entry and exit points during momentum shifts.
Reducing market noise through customizable smoothing, enhancing clarity of momentum signals.
🔹 SETTINGS
📌 Momentum Parameters
Length: Adjusts sensitivity for momentum detection, influencing how quickly momentum shifts are identified.
EMA Smoothing: Determines the level of noise filtering, balancing signal responsiveness and smoothness.
📌 Visualization
Automatic color adaptation clearly signals bullish or bearish momentum.
Simple default visualization settings optimize usability for traders across various markets and timeframes.
🔹 ADDITIONAL NOTES
The Momentum Trend Strength (MTS) indicator provides traders with a straightforward yet powerful visualization of momentum directly on the price chart. Its intuitive nature and adaptive settings make it a valuable addition to various trading approaches and analytical methods, helping traders confidently interpret market movements and momentum dynamics in real-time.

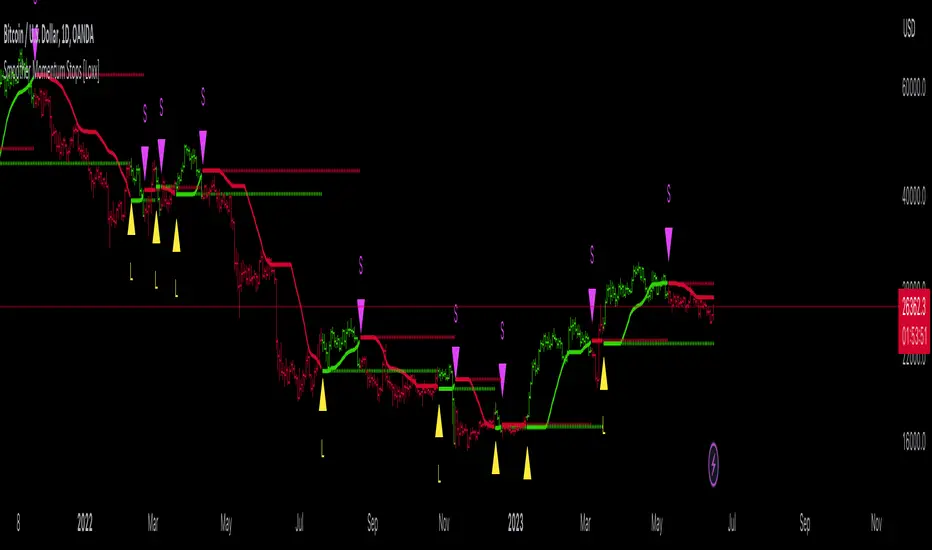
Smoother Momentum Stops [Loxx]Smoother Momentum Stops (SMS) is a dynamic tool that combines the logic of momentum and moving averages to create an overlay of the market price and generate potential trade signals. The original idea for this indicator comes from the beloved and esteemed trading indicator guru Mladen Rakic.
Understanding the Framework
The SMS incorporates various aspects of technical analysis, including momentum calculation, several types of moving averages, and an intelligent stop-and-reverse system that determines when to enter and exit trades.
The indicator initiates by defining the color scheme for visualization, specifically green for bullish trends and red for bearish trends. It further utilizes the 'smmom' and 'fema' functions to calculate smoothed momentum and fast exponential moving averages, respectively. The values computed by these functions are central to the signal generation process.
Momentum Calculation
The 'smmom' function serves to calculate a smoother momentum by taking a source (such as the closing price) and a period as inputs. This function employs a complex algorithm involving exponential moving averages (EMA), wherein two EMAs are calculated with different smoothing factors, and the difference between the two results is returned as the output. This smooth momentum calculation assists in eliminating unnecessary noise from the market and delivers more reliable momentum readings.
Moving Averages Computation
One key feature of the SMS is the ability to select from five different moving average types: Exponential Moving Average (EMA), Fast Exponential Moving Average (FEMA), Linear Weighted Moving Average (LWMA), Simple Moving Average (SMA), and Smoothed Moving Average (SMMA). The 'variant' function assigns the chosen method to the '_avg' variable, which is then used in the trade signal logic.
Trade Signal Generation
SMS employs a complex yet robust mechanism for generating trade signals. A stop-and-reverse system is established, which works on the principle of momentum. If the smoothed momentum is positive, an upper stop is determined and if the momentum is negative, a lower stop is defined.
The process continues by defining long and short entry conditions. The indicator goes long when an upper stop exists, and the previous bar had a lower stop, signifying a shift in momentum. The short entry condition is the opposite: the indicator goes short when a lower stop exists, and the previous bar had an upper stop. Alerts are generated for each of these conditions, helping traders to take timely action.
Visual Representation and UI Options
In terms of visual representation, the indicator plots upper and lower stops, employing green color for upper and red for lower stops. If the option to color bars is chosen, the entire bar is colored green or red, based on whether an upper or lower stop exists. This feature allows traders to visually comprehend market conditions better. Support and reisstance levels are also provided for visual context.
Conclusion
The Smoother Momentum Stops indicator is a potent tool for traders seeking to optimize their trading strategies. It blends the fundamentals of momentum and moving averages, resulting in a robust system that provides clear, reliable, and timely trading signals. By adjusting the smoothing type and period parameters, traders can customize the indicator to fit various market conditions and asset types, thereby adding a layer of flexibility to their trading strategies.
The use of a stop-and-reverse system adds a layer of risk management by offering precise entry and exit points based on momentum shifts. These stops are not just mere levels of entries or exits, but they reflect the undercurrent of the market's momentum, thus providing a dynamic framework to make informed trading decisions.
Additionally, the SMS indicator offers visual simplicity. The color-coded bars and distinct symbols for long and short positions make it easier for traders to interpret the signals and market direction quickly. Combined with the alert system, it ensures that traders never miss an important trading opportunity.
Finally, the power of the SMS indicator lies in its adaptability and comprehensive approach. By providing a selection of moving averages and an intelligent momentum-based system, it encapsulates various aspects of market behavior. As such, it is a useful tool not just for momentum traders, but for any trader who understands the significance of moving averages and momentum in predicting market movements.
In conclusion, the Smoother Momentum Stops indicator stands as an innovative, adaptable, and powerful tool for the modern trader. Its blend of flexibility, dynamic risk management, and straightforward visualization offer a comprehensive solution for traders looking to navigate the complex world of financial markets. With a detailed understanding of its workings as presented in this essay, traders can harness its full potential to optimize their strategies, manage risk, and achieve their trading objectives.
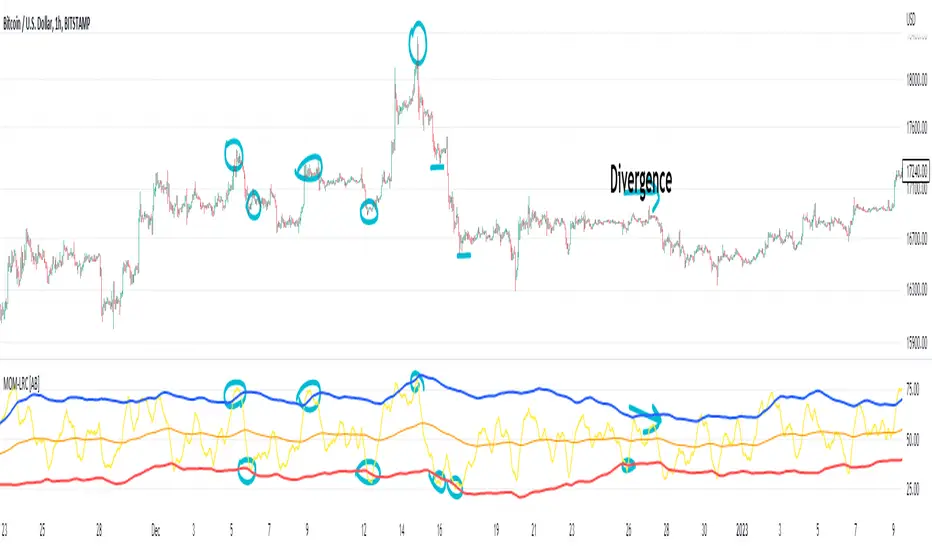
(Very promising) [Abdullah Ahmed] Momentum indicator V.1Description: MOM-LRC is a powerful technical analysis indicator designed to provide traders with signals based on the momentum of an asset's price and its deviation from its mean value. The indicator calculates the exponential RSI and uses a custom function to determine the percentage change from the mean. The upper and lower bands of the momentum channel are then calculated using linear regression of the rate of change from the mean. The channel multiplier can be adjusted to increase or decrease the sensitivity of the indicator.
How to use :
1 - Using MOM-LRC , look for buy signals when the price of the asset is below the lower border of the channel and retracing up. The opposite is true in the case of sell signals.
2 - It is also used in the case of negative and positive divergences, just as you use RSI
The indicator can be used on any time frame and any asset, making it a versatile tool for traders of all levels.
features:
Calculates exponential RSI and percentage change from the mean
Uses linear regression to calculate upper and lower bands of momentum channel
Adjustable channel multiplier for increased sensitivity
Suitable for any time frame and any asset
Happy trading!
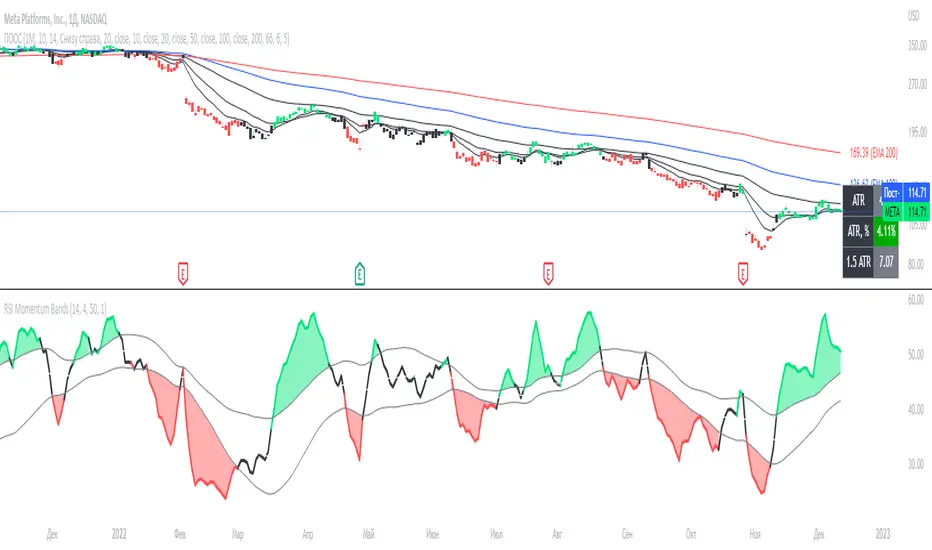
[EDU] RSI Momentum BandsRSI Momentum Bands serve a purpose to find best RSI momentum for entering a trade.
Indicator is built simply:
1st RSI MA is smoothed RSI by little period, 2nd RSI MA is smoothed RSI by a bigger period.
Then we calculate standard deviation from the 2nd MA and make upper and lower band.
The rules for trades are simple:
When RSI is above higher band - Buy ;
When RSI is below lower band - Sell .
The indicator is for educational purposes only to present trades a momentum bands concepts, widely used across professionals.
Hope you will find it helpful.
Take your profits!
- Tarasenko Fyodor
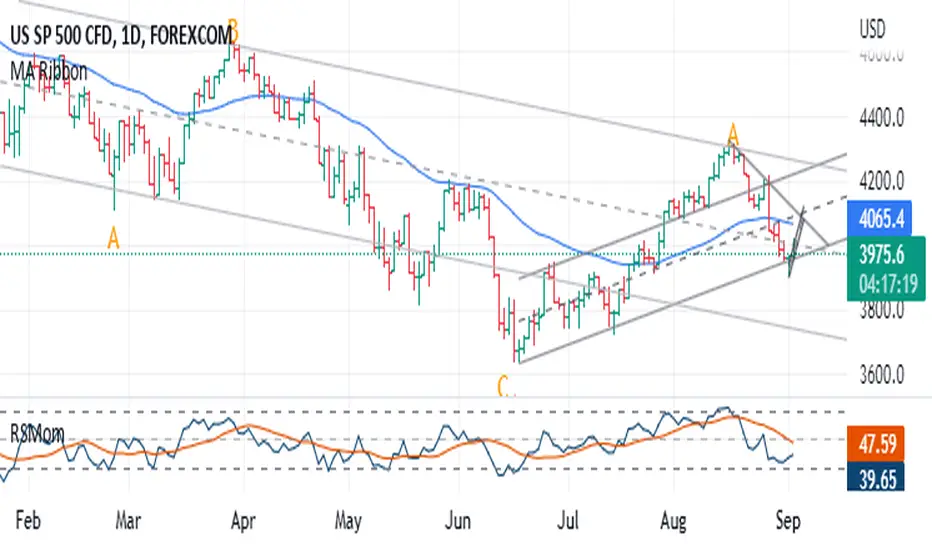
Relative Strength MomentumThe RSI is a traders friend - it can provide insight that other indicators simply cannot. The RSI achilles heel is that it can often fail to highlight divergence. Constance Brown attempted to resolve this problem with the 'Composite index' - a powerful tool. However.. for me, looking at two indicators can get a bit much - especially if viewing multiple time-frames. I want one tool which provides the RSI, it's ranging/reversal behaviour (as documented by Andrew Cardwell) and a better grasp of momentum swings (via divergence and reversal signals). So this is my best effort, and I hope it can prove useful to some of you. At first the differences may be hard to spot - but they are there!
My default settings are optimised - as with the 'normal' RSI you can expect a bullish trend to result in few (if any) moves below 30. In a bearish trend, you can expect few (if any) incursions above 70. Cardwell's observations apply. I recommend using this with a 50 period EMA to provide some additional context.
OBV with Volume/Momentum DivergenceCredits go to vyperphi696 and LazyBear for the original OBV with Divergence script.
This indicator has the new option to check for momentum divergence, which I have done by adding RSI and MACD data.
Hence the indicator allows combined testing of volume and momentum divergence. This feature aims to improve trend reversal detection by reducing false positives.
In summary, 3 divergence categories are shown by default as lines:
Volume + RSI + MACD (dark green/red)
Volume + RSI / Volume + MACD (light green/red)
Volume (gray)
Line colors can be adjusted via plot settings. Therefore it is also possible to distinguish Volume + RSI and Volume + MACD divergence if necessary.
Lastly, I edited the indicator scaling mechanism when changing from one timeframe to another; the transitions are smoother now. This only applies when auto-scaling is off.

Renko - RSI MomentumIn essence this Renko trading system is the following:
1. Momentum based entries
2. Trend trading system (small losses, big wins)
3. As well as a trend continuation system
------------------------------
!IMPORTANT!
------------------------------
- You MUST have a Pro+ account. Why? Cause Renko NEEDS to run on 1min or 5min chart, nothing larger.
If you don't, the chart will repaint .
------------------------------
CHART SETUP
------------------------------
1. Set chart to Renko
2. Set period of chart to 1 min (or 5 min)
3. Set Renko box size method to "Traditional"
4. Set Renko box size to:
- JPY Pairs: 0.2 to 0.4
- Other Major/Minors: 0.002 - 0.004
- Exotic pairs: NO IDEA... (I haven't tested them yet)
5. Load the indicator
------------------------------
RULES
------------------------------
Trend Entry
An arrow will appear the following conditions are met:
LONG: RSI(7) goes above 55 AND price is above the 50 SMA
SHORT: RSI(7) goes below 45 AND price is below the 50 SMA
Enter immediately after the bar is printed.
Counter Trend Entry
An orange dot appears when the following conditions are met:
LONG: RSI(7) goes above 55 AND price is below the 50 SMA and above the 10 EMA
SHORT: RSI(7) goes below 45 AND price is above the 50 SMA and below the 10 EMA
I would not suggest entering immediately but rather finding a trendline or support/resistance that is being broken.
Exit
- Exit when a white bar is printed
- OR use your own discretion. Like 2 bars in opposite direction or on EMA cross or hit of support/resistance.
------------------------------
CHART
------------------------------
- Green bars are when the RSI(7) is above 55.
- Red bars are when the RSI(7) is below 45.
- White bars are when the RSI(7) is between 45and 55.
------------------------------

Edge of MomentumThe script was designed for the purpose of catching the rocket portion of a move (the edge of momentum).
Long
--When RSI closes over 60, take long order 1 tick above that bar. The closed bar above RSI 60 will be colored "green" or whatever color the user chooses. (RSI > 60)
--On a long position, exit will be a closed bar below the ema (low, 10) . The closed bar below the ema will be colored "yellow." (Price < ema)
--Note: On a long position there is no need to exit when a closed bar is colored "purple." RSI is just below 60 but above 40. Pullback or chop
Short
--When RSI closes below 40, take a short order 1 tick below that bar. The closed bar below RSI 40 will be colored "red." RSI<40)
--On a short position, exit will be a closed bar above the ema (low, 10). The closed bar above the ema will be colored "purple." (Price > ema)
--Note: On a short position there is no need to exit when a closed bar is colored "yellow."
Note: You may see a series of purple and yellow bars, that is simply chop. I define chop as RSI moving between 60 and 40.
Trade should only be taken above green colored candle(long) and below red colored candle (short). No position should be taken off yellow or purple candle (chop)
Again this is designed to catch the momentum part of a move, and to help reduce some entries during chop. It is a simple systems that beginning traders can use and profit from.
Note: I don't no shit about coding scripts I just learn from reading others.
Enjoy. If you decide to use please drop me a line...suggestions/comments, etc.
Best of luck in all you do.

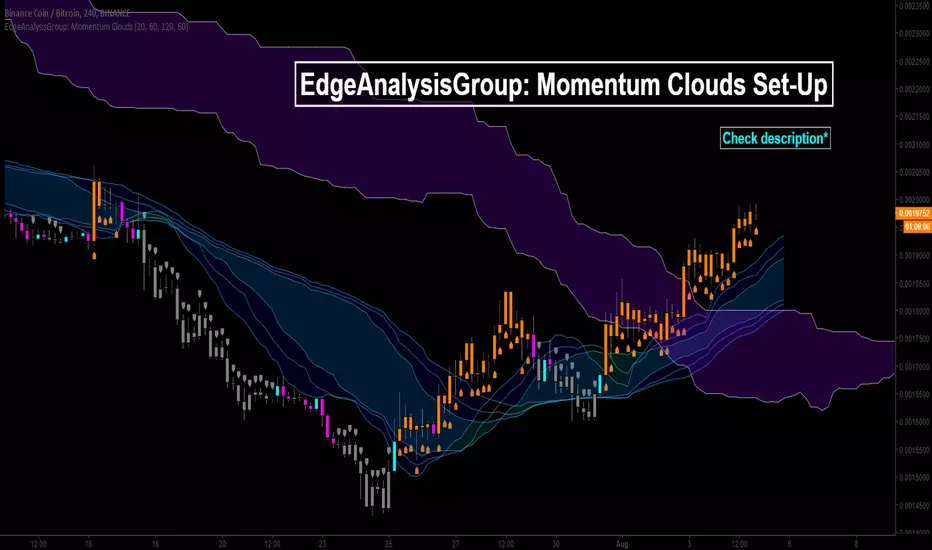
EdgeAnalysisGroup: Momentum Clouds Set-UpWhat do you need turned off and on in the settings to have this exact setup?
Bar colours transparency = 100%
Lagging Span off
Baseline off
Conversion line off
What is it?
This trading strategy is an all in one. This means any additional parameters could make the set-up very noisy. I spent hours developing and back-testing the core of the whole method- volume clouds. The volume cloud is the wavey/much more fluid centralised cloud. These have in essence been left the same with new additions crafted around the volume clouds, the ichi and the momentum indicator. It Uses-
Volume
MA's
Ichimoku Clouds
Displacement
RSI
MACD
Even though your fundamental price action will come into play when using this indicator- it does abstract resistance/support zones and trade zones very nicely to make the overall difficulty of the indicator and trading experience much lesser.
How to trade on it?
Trade edge to edge on the clouds.
Mid-section is safe trade area on volume cloud.
Trade re-tests / rejections. Watching for 3rd retest + for break back into cloud.
Bullish mom + break above vol cloud = Bullish trend.
Bearish mom + break below vol cloud = Bearish trend.
Stoploss is situational.
Example board:
BTC/USD 1 Day.
ETH/BTC 1 Day.
NEO/BTC 4 Hour.
Hopefully from these examples, when observing them you are understanding how the clouds work, and how the momentum ties into the whole model, any questions don't hesistant to comment- and feel free to drop me a follow for my hard work too.
Thank you for reading, I hope this indicator can aid you, as it is doing with a few of my friends and myself.
All information found here, including any ideas, opinions, scripts, views, predictions, forecasts, commentaries, suggestions, or stock/cryptocurrency picks, expressed or implied herein, are for informational, entertainment or educational purposes only and should not be construed as personal investment advice. These are not facts but my personal views and opinions.
I will not and cannot be held liable for any actions you take as a result of anything you read here.
DecisionPoint Price Momentum Oscillator [LazyBear]The DecisionPoint Price Momentum Oscillator (PMO) is an oscillator based on a Rate of Change calculation that is smoothed twice with custom exponential moving averages. Because the PMO is normalized, it can also be used as a relative strength tool.
PMO can be used in many ways:
- PMO can be used to determine the OB/OS state. While the +2.5 to -2.5 is the usual range for broad stock market indexes, each price index will have its own “signature” range. You may have to tune this for your instrument.
- PMO triggers buy/sell on signal crossovers and ZERO crossovers.
- Common patterns like BullKiss, BearKiss are useful to track. See the link below for more info.
- Divergences.
- Histo-only mode that can be used similar to MACD-Histo.
I have exposed all params as configurable. Have fun tuning :) Don't forget to share what you found for your instrument.
More Info:
stockcharts.com
List of my public indicators: bit.ly
List of my app-store indicators: blog.tradingview.com
Some Sample Charts:
TWTR:
MSFT:
GOOGL:

Composite Momentum Index [LazyBear]This is a composite oscillator derived from modified 5/10/20 Chande's Dynamic Momentum Index values.
Volatility is factored in, by design. Look for OB/OS extremes and divergences.
I added the green/red ribbon look to make it easy to read :)
More info:
www.investopedia.com
List of my public indicators: bit.ly
List of my app-store indicators: blog.tradingview.com

Luxy Momentum, Trend, Bias and Breakout Indicators V7
TABLE OF CONTENTS
This is Version 7 (V7) - the latest and most optimized release. If you are using any older versions (V6, V5, V4, V3, etc.), it is highly recommended to replace them with V7.
Why This Indicator is Different
Who Should Use This
Core Components Overview
The UT Bot Trading System
Understanding the Market Bias Table
Candlestick Pattern Recognition
Visual Tools and Features
How to Use the Indicator
Performance and Optimization
FAQ
---
### CREDITS & ATTRIBUTION
This indicator implements proven trading concepts using entirely original code developed specifically for this project.
### CONCEPTUAL FOUNDATIONS
• UT Bot ATR Trailing System
- Original concept by @QuantNomad: (search "UT-Bot-Strategy"
- Our version is a complete reimplementation with significant enhancements:
- Volume-weighted momentum adjustment
- Composite stop loss from multiple S/R layers
- Multi-filter confirmation system (swing, %, 2-bar, ZLSMA)
- Full integration with multi-timeframe bias table
- Visual audit trail with freeze-on-touch
- NOTE: No code was copied - this is a complete reimplementation with enhancements.
• Standard Technical Indicators (Public Domain Formulas):
- Supertrend: ATR-based trend calculation with custom gradient fills
- MACD: Gerald Appel's formula with separation filters
- RSI: J. Welles Wilder's formula with pullback zone logic
- ADX/DMI: Custom trend strength formula inspired by Wilder's directional movement concept, reimplemented with volume weighting and efficiency metrics
- ZLSMA: Zero-lag formula enhanced with Hull MA and momentum prediction
### Custom Implementations
- Trend Strength: Inspired by Wilder's ADX concept but using volume-weighted pressure calculation and efficiency metrics (not traditional +DI/-DI smoothing)
- All code implementations are original
### ORIGINAL FEATURES (70%+ of codebase)
- Multi-Timeframe Bias Table with live updates
- Risk Management System (R-multiple TPs, freeze-on-touch)
- Opening Range Breakout tracker with session management
- Composite Stop Loss calculator using 6+ S/R layers
- Performance optimization system (caching, conditional calcs)
- VIX Fear Index integration
- Previous Day High/Low auto-detection
- Candlestick pattern recognition with interactive tooltips
- Smart label and visual management
- All UI/UX design and table architecture
### DEVELOPMENT PROCESS
**AI Assistance:** This indicator was developed over 2+ months with AI assistance (ChatGPT/Claude) used for:
- Writing Pine Script code based on design specifications
- Optimizing performance and fixing bugs
- Ensuring Pine Script v6 compliance
- Generating documentation
**Author's Role:** All trading concepts, system design, feature selection, integration logic, and strategic decisions are original work by the author. The AI was a coding tool, not the system designer.
**Transparency:** We believe in full disclosure - this project demonstrates how AI can be used as a powerful development tool while maintaining creative and strategic ownership.
---
1. WHY THIS INDICATOR IS DIFFERENT
Most traders use multiple separate indicators on their charts, leading to cluttered screens, conflicting signals, and analysis paralysis. The Suite solves this by integrating proven technical tools into a single, cohesive system.
Key Advantages:
All-in-One Design: Instead of loading 5-10 separate indicators, you get everything in one optimized script. This reduces chart clutter and improves TradingView performance.
Multi-Timeframe Bias Table: Unlike standard indicators that only show the current timeframe, the Bias Table aggregates trend signals across multiple timeframes simultaneously. See at a glance whether 1m, 5m, 15m, 1h are aligned bullish or bearish - no more switching between charts.
Smart Confirmations: The indicator doesn't just give signals - it shows you WHY. Every entry has multiple layers of confirmation (MA cross, MACD momentum, ADX strength, RSI pullback, volume, etc.) that you can toggle on/off.
Dynamic Stop Loss System: Instead of static ATR stops, the SL is calculated from multiple support/resistance layers: UT trailing line, Supertrend, VWAP, swing structure, and MA levels. This creates more intelligent, price-action-aware stops.
R-Multiple Take Profits: Built-in TP system calculates targets based on your initial risk (1R, 1.5R, 2R, 3R). Lines freeze when touched with visual checkmarks, giving you a clean audit trail of partial exits.
Educational Tooltips Everywhere: Every single input has detailed tooltips explaining what it does, typical values, and how it impacts trading. You're not guessing - you're learning as you configure.
Performance Optimized: Smart caching, conditional calculations, and modular design mean the indicator runs fast despite having 15+ features. Turn off what you don't use for even better performance.
No Repainting: All signals respect bar close. Alerts fire correctly. What you see in history is what you would have gotten in real-time.
What Makes It Unique:
Integrated UT Bot + Bias Table: No other indicator combines UT Bot's ATR trailing system with a live multi-timeframe dashboard. You get precision entries with macro trend context.
Candlestick Pattern Recognition with Interactive Tooltips: Patterns aren't just marked - hover over any emoji for a full explanation of what the pattern means and how to trade it.
Opening Range Breakout Tracker: Built-in ORB system for intraday traders with customizable session times and real-time status updates in the Bias Table.
Previous Day High/Low Auto-Detection: Automatically plots PDH/PDL on intraday charts with theme-aware colors. Updates daily without manual input.
Dynamic Row Labels in Bias Table: The table shows your actual settings (e.g., "EMA 10 > SMA 20") not generic labels. You know exactly what's being evaluated.
Modular Filter System: Instead of forcing a fixed methodology, the indicator lets you build your own strategy. Start with just UT Bot, add filters one at a time, test what works for your style.
---
2. WHO WHOULD USE THIS
Designed For:
Intermediate to Advanced Traders: You understand basic technical analysis (MAs, RSI, MACD) and want to combine multiple confirmations efficiently. This isn't a "one-click profit" system - it's a professional toolkit.
Multi-Timeframe Traders: If you trade one asset but check multiple timeframes for confirmation (e.g., enter on 5m after checking 15m and 1h alignment), the Bias Table will save you hours every week.
Trend Followers: The indicator excels at identifying and following trends using UT Bot, Supertrend, and MA systems. If you trade breakouts and pullbacks in trending markets, this is built for you.
Intraday and Swing Traders: Works equally well on 5m-1h charts (day trading) and 4h-D charts (swing trading). Scalpers can use it too with appropriate settings adjustments.
Discretionary Traders: This isn't a black-box system. You see all the components, understand the logic, and make final decisions. Perfect for traders who want tools, not automation.
Works Across All Markets:
Stocks (US, international)
Cryptocurrency (24/7 markets supported)
Forex pairs
Indices (SPY, QQQ, etc.)
Commodities
NOT Ideal For :
Complete Beginners: If you don't know what a moving average or RSI is, start with basics first. This indicator assumes foundational knowledge.
Algo Traders Seeking Black Box: This is discretionary. Signals require context and confirmation. Not suitable for blind automated execution.
Mean-Reversion Only Traders: The indicator is trend-following at its core. While VWAP bands support mean-reversion, the primary methodology is trend continuation.
---
3. CORE COMPONENTS OVERVIEW
The indicator combines these proven systems:
Trend Analysis:
Moving Averages: Four customizable MAs (Fast, Medium, Medium-Long, Long) with six types to choose from (EMA, SMA, WMA, VWMA, RMA, HMA). Mix and match for your style.
Supertrend: ATR-based trend indicator with unique gradient fill showing trend strength. One-sided ribbon visualization makes it easier to see momentum building or fading.
ZLSMA : Zero-lag linear-regression smoothed moving average. Reduces lag compared to traditional MAs while maintaining smooth curves.
Momentum & Filters:
MACD: Standard MACD with separation filter to avoid weak crossovers.
RSI: Pullback zone detection - only enter longs when RSI is in your defined "buy zone" and shorts in "sell zone".
ADX/DMI: Trend strength measurement with directional filter. Ensures you only trade when there's actual momentum.
Volume Filter: Relative volume confirmation - require above-average volume for entries.
Donchian Breakout: Optional channel breakout requirement.
Signal Systems:
UT Bot: The primary signal generator. ATR trailing stop that adapts to volatility and gives clear entry/exit points.
Base Signals: MA cross system with all the above filters applied. More conservative than UT Bot alone.
Market Bias Table: Multi-timeframe dashboard showing trend alignment across 7 timeframes plus macro bias (3-day, weekly, monthly, quarterly, VIX).
Candlestick Patterns: Six major reversal patterns auto-detected with interactive tooltips.
ORB Tracker: Opening range high/low with breakout status (intraday only).
PDH/PDL: Previous day levels plotted automatically on intraday charts.
VWAP + Bands : Session-anchored VWAP with up to three standard deviation band pairs.
---
4. THE UT BOT TRADING SYSTEM
The UT Bot is the heart of the indicator's signal generation. It's an advanced ATR trailing stop that adapts to market volatility.
Why UT Bot is Superior to Fixed Stops:
Traditional ATR stops use a fixed multiplier (e.g., "stop = entry - 2×ATR"). UT Bot is smarter:
It TRAILS the stop as price moves in your favor
It WIDENS during high volatility to avoid premature stops
It TIGHTENS during consolidation to lock in profits
It FLIPS when price breaks the trailing line, signaling reversals
Visual Elements You'll See:
Orange Trailing Line: The actual UT stop level that adapts bar-by-bar
Buy/Sell Labels: Aqua triangle (long) or orange triangle (short) when the line flips
ENTRY Line: Horizontal line at your entry price (optional, can be turned off)
Suggested Stop Loss: A composite SL calculated from multiple support/resistance layers:
- UT trailing line
- Supertrend level
- VWAP
- Swing structure (recent lows/highs)
- Long-term MA (200)
- ATR-based floor
Take Profit Lines: TP1, TP1.5, TP2, TP3 based on R-multiples. When price touches a TP, it's marked with a checkmark and the line freezes for audit trail purposes.
Status Messages: "SL Touched ❌" or "SL Frozen" when the trade leg completes.
How UT Bot Differs from Other ATR Systems:
Multiple Filters Available: You can require 2-bar confirmation, minimum % price change, swing structure alignment, or ZLSMA directional filter. Most UT implementations have none of these.
Smart SL Calculation: Instead of just using the UT line as your stop, the indicator suggests a better SL based on actual support/resistance. This prevents getting stopped out by wicks while keeping risk controlled.
Visual Audit Trail: All SL/TP lines freeze when touched with clear markers. You can review your trades weeks later and see exactly where entries, stops, and targets were.
Performance Options: "Draw UT visuals only on bar close" lets you reduce rendering load without affecting logic or alerts - critical for slower machines or 1m charts.
Trading Logic:
UT Bot flips direction (Buy or Sell signal appears)
Check Bias Table for multi-timeframe confirmation
Optional: Wait for Base signal or candlestick pattern
Enter at signal bar close or next bar open
Place stop at "Suggested Stop Loss" line
Scale out at TP levels (TP1, TP2, TP3)
Exit remaining position on opposite UT signal or stop hit
---
5. UNDERSTANDING THE MARKET BIAS TABLE
This is the indicator's unique multi-timeframe intelligence layer. Instead of looking at one chart at a time, the table aggregates signals across seven timeframes plus macro trend bias.
Why Multi-Timeframe Analysis Matters:
Professional traders check higher and lower timeframes for context:
Is the 1h uptrend aligning with my 5m entry?
Are all short-term timeframes bullish or just one?
Is the daily trend supportive or fighting me?
Doing this manually means opening multiple charts, checking each indicator, and making mental notes. The Bias Table does it automatically in one glance.
Table Structure:
Header Row:
On intraday charts: 1m, 5m, 15m, 30m, 1h, 2h, 4h (toggle which ones you want)
On daily+ charts: D, W, M (automatic)
Green dot next to title = live updating
Headline Rows - Macro Bias:
These show broad market direction over longer periods:
3 Day Bias: Trend over last 3 trading sessions (uses 1h data)
Weekly Bias: Trend over last 5 trading sessions (uses 4h data)
Monthly Bias: Trend over last 30 daily bars
Quarterly Bias: Trend over last 13 weekly bars
VIX Fear Index: Market regime based on VIX level - bullish when low, bearish when high
Opening Range Breakout: Status of price vs. session open range (intraday only)
These rows show text: "BULLISH", "BEARISH", or "NEUTRAL"
Indicator Rows - Technical Signals:
These evaluate your configured indicators across all active timeframes:
Fast MA > Medium MA (shows your actual MA settings, e.g., "EMA 10 > SMA 20")
Price > Long MA (e.g., "Price > SMA 200")
Price > VWAP
MACD > Signal
Supertrend (up/down/neutral)
ZLSMA Rising
RSI In Zone
ADX ≥ Minimum
These rows show emojis: GREEB (bullish), RED (bearish), GRAY/YELLOW (neutral/NA)
AVG Column:
Shows percentage of active timeframes that are bullish for that row. This is the KEY metric:
AVG > 70% = strong multi-timeframe bullish alignment
AVG 40-60% = mixed/choppy, no clear trend
AVG < 30% = strong multi-timeframe bearish alignment
How to Use the Table:
For a long trade:
Check AVG column - want to see > 60% ideally
Check headline bias rows - want to see BULLISH, not BEARISH
Check VIX row - bullish market regime preferred
Check ORB row (intraday) - want ABOVE for longs
Scan indicator rows - more green = better confirmation
For a short trade:
Check AVG column - want to see < 40% ideally
Check headline bias rows - want to see BEARISH, not BULLISH
Check VIX row - bearish market regime preferred
Check ORB row (intraday) - want BELOW for shorts
Scan indicator rows - more red = better confirmation
When AVG is 40-60%:
Market is choppy, mixed signals. Either stay out or reduce position size significantly. These are low-probability environments.
Unique Features:
Dynamic Labels: Row names show your actual settings (e.g., "EMA 10 > SMA 20" not generic "Fast > Slow"). You know exactly what's being evaluated.
Customizable Rows: Turn off rows you don't care about. Only show what matters to your strategy.
Customizable Timeframes: On intraday charts, disable 1m or 4h if you don't trade them. Reduces calculation load by 20-40%.
Automatic HTF Handling: On Daily/Weekly/Monthly charts, the table automatically switches to D/W/M columns. No configuration needed.
Performance Smart: "Hide BIAS table on 1D or above" option completely skips all table calculations on higher timeframes if you only trade intraday.
---
6. CANDLESTICK PATTERN RECOGNITION
The indicator automatically detects six major reversal patterns and marks them with emojis at the relevant bars.
Why These Six Patterns:
These are the most statistically significant reversal patterns according to trading literature:
High win rate when appearing at support/resistance
Clear visual structure (not subjective)
Work across all timeframes and assets
Studied extensively by institutions
The Patterns:
Bullish Patterns (appear at bottoms):
Bullish Engulfing: Green candle completely engulfs prior red candle's body. Strong reversal signal.
Hammer: Small body with long lower wick (at least 2× body size). Shows rejection of lower prices by buyers.
Morning Star: Three-candle pattern (large red → small indecision → large green). Very strong bottom reversal.
Bearish Patterns (appear at tops):
Bearish Engulfing: Red candle completely engulfs prior green candle's body. Strong reversal signal.
Shooting Star: Small body with long upper wick (at least 2× body size). Shows rejection of higher prices by sellers.
Evening Star: Three-candle pattern (large green → small indecision → large red). Very strong top reversal.
Interactive Tooltips:
Unlike most pattern indicators that just draw shapes, this one is educational:
Hover your mouse over any pattern emoji
A tooltip appears explaining: what the pattern is, what it means, when it's most reliable, and how to trade it
No need to memorize - learn as you trade
Noise Filter:
"Min candle body % to filter noise" setting prevents false signals:
Patterns require minimum body size relative to price
Filters out tiny candles that don't represent real buying/selling pressure
Adjust based on asset volatility (higher % for crypto, lower for low-volatility stocks)
How to Trade Patterns:
Patterns are NOT standalone entry signals. Use them as:
Confirmation: UT Bot gives signal + pattern appears = stronger entry
Reversal Warning: In a trade, opposite pattern appears = consider tightening stop or taking profit
Support/Resistance Validation: Pattern at key level (PDH, VWAP, MA 200) = level is being respected
Best combined with:
UT Bot or Base signal in same direction
Bias Table alignment (AVG > 60% or < 40%)
Appearance at obvious support/resistance
---
7. VISUAL TOOLS AND FEATURES
VWAP (Volume Weighted Average Price):
Session-anchored VWAP with standard deviation bands. Shows institutional "fair value" for the trading session.
Anchor Options: Session, Day, Week, Month, Quarter, Year. Choose based on your trading timeframe.
Bands: Up to three pairs (X1, X2, X3) showing statistical deviation. Price at outer bands often reverses.
Auto-Hide on HTF: VWAP hides on Daily/Weekly/Monthly charts automatically unless you enable anchored mode.
Use VWAP as:
Directional bias (above = bullish, below = bearish)
Mean reversion levels (outer bands)
Support/resistance (the VWAP line itself)
Previous Day High/Low:
Automatically plots yesterday's high and low on intraday charts:
Updates at start of each new trading day
Theme-aware colors (dark text for light charts, light text for dark charts)
Hidden automatically on Daily/Weekly/Monthly charts
These levels are critical for intraday traders - institutions watch them closely as support/resistance.
Opening Range Breakout (ORB):
Tracks the high/low of the first 5, 15, 30, or 60 minutes of the trading session:
Customizable session times (preset for NYSE, LSE, TSE, or custom)
Shows current breakout status in Bias Table row (ABOVE, BELOW, INSIDE, BUILDING)
Intraday only - auto-disabled on Daily+ charts
ORB is a classic day trading strategy - breakout above opening range often leads to continuation.
Extra Labels:
Change from Open %: Shows how far price has moved from session open (intraday) or daily open (HTF). Green if positive, red if negative.
ADX Badge: Small label at bottom of last bar showing current ADX value. Green when above your minimum threshold, red when below.
RSI Badge: Small label at top of last bar showing current RSI value with zone status (buy zone, sell zone, or neutral).
These labels provide quick at-a-glance confirmation without needing separate indicator windows.
---
8. HOW TO USE THE INDICATOR
Step 1: Add to Chart
Load the indicator on your chosen asset and timeframe
First time: Everything is enabled by default - the chart will look busy
Don't panic - you'll turn off what you don't need
Step 2: Start Simple
Turn OFF everything except:
UT Bot labels (keep these ON)
Bias Table (keep this ON)
Moving Averages (Fast and Medium only)
Suggested Stop Loss and Take Profits
Hide everything else initially. Get comfortable with the basic UT Bot + Bias Table workflow first.
Step 3: Learn the Core Workflow
UT Bot gives a Buy or Sell signal
Check Bias Table AVG column - do you have multi-timeframe alignment?
If yes, enter the trade
Place stop at Suggested Stop Loss line
Scale out at TP levels
Exit on opposite UT signal
Trade this simple system for a week. Get a feel for signal frequency and win rate with your settings.
Step 4: Add Filters Gradually
If you're getting too many losing signals (whipsaws in choppy markets), add filters one at a time:
Try: "Require 2-Bar Trend Confirmation" - wait for 2 bars to confirm direction
Try: ADX filter with minimum threshold - only trade when trend strength is sufficient
Try: RSI pullback filter - only enter on pullbacks, not chasing
Try: Volume filter - require above-average volume
Add one filter, test for a week, evaluate. Repeat.
Step 5: Enable Advanced Features (Optional)
Once you're profitable with the core system, add:
Supertrend for additional trend confirmation
Candlestick patterns for reversal warnings
VWAP for institutional anchor reference
ORB for intraday breakout context
ZLSMA for low-lag trend following
Step 6: Optimize Settings
Every setting has a detailed tooltip explaining what it does and typical values. Hover over any input to read:
What the parameter controls
How it impacts trading
Suggested ranges for scalping, day trading, and swing trading
Start with defaults, then adjust based on your results and style.
Step 7: Set Up Alerts
Right-click chart → Add Alert → Condition: "Luxy Momentum v6" → Choose:
"UT Bot — Buy" for long entries
"UT Bot — Sell" for short entries
"Base Long/Short" for filtered MA cross signals
Optionally enable "Send real-time alert() on UT flip" in settings for immediate notifications.
Common Workflow Variations:
Conservative Trader:
UT signal + Base signal + Candlestick pattern + Bias AVG > 70%
Enter only at major support/resistance
Wider UT sensitivity, multiple filters
Aggressive Trader:
UT signal + Bias AVG > 60%
Enter immediately, no waiting
Tighter UT sensitivity, minimal filters
Swing Trader:
Focus on Daily/Weekly Bias alignment
Ignore intraday noise
Use ORB and PDH/PDL less (or not at all)
Wider stops, patient approach
---
9. PERFORMANCE AND OPTIMIZATION
The indicator is optimized for speed, but with 15+ features running simultaneously, chart load time can add up. Here's how to keep it fast:
Biggest Performance Gains:
Disable Unused Timeframes: In "Time Frames" settings, turn OFF any timeframe you don't actively trade. Each disabled TF saves 10-15% calculation time. If you only day trade 5m, 15m, 1h, disable 1m, 2h, 4h.
Hide Bias Table on Daily+: If you only trade intraday, enable "Hide BIAS table on 1D or above". This skips ALL table calculations on higher timeframes.
Draw UT Visuals Only on Bar Close: Reduces intrabar rendering of SL/TP/Entry lines. Has ZERO impact on logic or alerts - purely visual optimization.
Additional Optimizations:
Turn off VWAP bands if you don't use them
Disable candlestick patterns if you don't trade them
Turn off Supertrend fill if you find it distracting (keep the line)
Reduce "Limit to 10 bars" for SL/TP lines to minimize line objects
Performance Features Built-In:
Smart Caching: Higher timeframe data (3-day bias, weekly bias, etc.) updates once per day, not every bar
Conditional Calculations: Volume filter only calculates when enabled. Swing filter only runs when enabled. Nothing computes if turned off.
Modular Design: Every component is independent. Turn off what you don't need without breaking other features.
Typical Load Times:
5m chart, all features ON, 7 timeframes: ~2-3 seconds
5m chart, core features only, 3 timeframes: ~1 second
1m chart, all features: ~4-5 seconds (many bars to calculate)
If loading takes longer, you likely have too many indicators on the chart total (not just this one).
---
10. FAQ
Q: How is this different from standard UT Bot indicators?
A: Standard UT Bot (originally by @QuantNomad) is just the ATR trailing line and flip signals. This implementation adds:
- Volume weighting and momentum adjustment to the trailing calculation
- Multiple confirmation filters (swing, %, 2-bar, ZLSMA)
- Smart composite stop loss system from multiple S/R layers
- R-multiple take profit system with freeze-on-touch
- Integration with multi-timeframe Bias Table
- Visual audit trail with checkmarks
Q: Can I use this for automated trading?
A: The indicator is designed for discretionary trading. While it has clear signals and alerts, it's not a mechanical system. Context and judgment are required.
Q: Does it repaint?
A: No. All signals respect bar close. UT Bot logic runs intrabar but signals only trigger on confirmed bars. Alerts fire correctly with no lookahead.
Q: Do I need to use all the features?
A: Absolutely not. The indicator is modular. Many profitable traders use just UT Bot + Bias Table + Moving Averages. Start simple, add complexity only if needed.
Q: How do I know which settings to use?
A: Every single input has a detailed tooltip. Hover over any setting to see:
What it does
How it affects trading
Typical values for scalping, day trading, swing trading
Start with defaults, adjust gradually based on results.
Q: Can I use this on crypto 24/7 markets?
A: Yes. ORB will not work (no defined session), but everything else functions normally. Use "Day" anchor for VWAP instead of "Session".
Q: The Bias Table is blank or not showing.
A: Check:
"Show Table" is ON
Table position isn't overlapping another indicator's table (change position)
At least one row is enabled
"Hide BIAS table on 1D or above" is OFF (if on Daily+ chart)
Q: Why are candlestick patterns not appearing?
A: Patterns are relatively rare by design - they only appear at genuine reversal points. Check:
Pattern toggles are ON
"Min candle body %" isn't too high (try 0.05-0.10)
You're looking at a chart with actual reversals (not strong trending market)
Q: UT Bot is too sensitive/not sensitive enough.
A: Adjust "Sensitivity (Key×ATR)". Lower number = tighter stop, more signals. Higher number = wider stop, fewer signals. Read the tooltip for guidance.
Q: Can I get alerts for the Bias Table?
A: The Bias Table is a dashboard for visual analysis, not a signal generator. Set alerts on UT Bot or Base signals, then manually check Bias Table for confirmation.
Q: Does this work on stocks with low volume?
A: Yes, but turn OFF the volume filter. Low volume stocks will never meet relative volume requirements.
Q: How often should I check the Bias Table?
A: Before every entry. It takes 2 seconds to glance at the AVG column and headline rows. This one check can save you from fighting the trend.
Q: What if UT signal and Base signal disagree?
A: UT Bot is more aggressive (ATR trailing). Base signals are more conservative (MA cross + filters). If they disagree, either:
Wait for both to align (safest)
Take the UT signal but with smaller size (aggressive)
Skip the trade (conservative)
There's no "right" answer - depends on your risk tolerance.
---
FINAL NOTES
The indicator gives you an edge. How you use that edge determines results.
For questions, feedback, or support, comment on the indicator page or message the author.
Happy Trading!

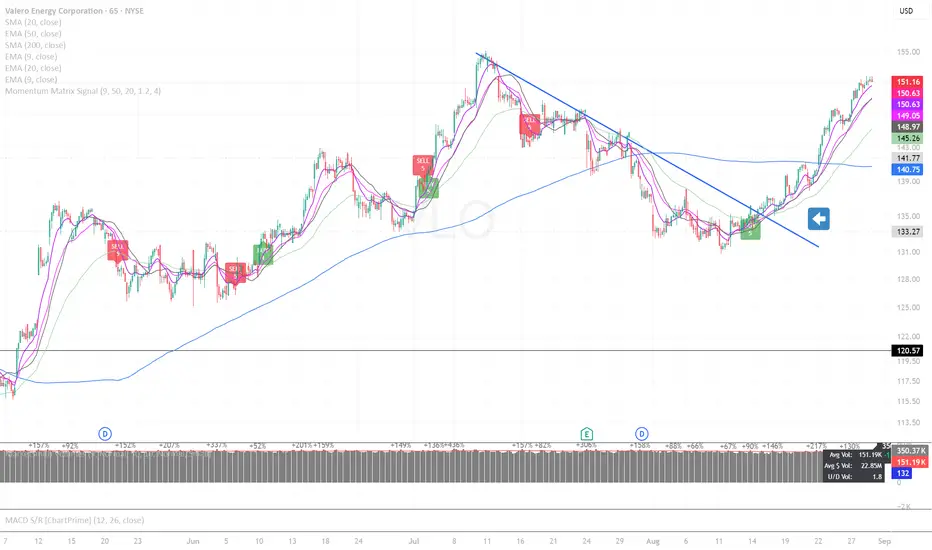
Momentum Matrix SignalMomentum Matrix Signals is a real-time indicator that finds BUY/SELL signals using a VWMA trend, closing momentum, and a strength score. It allows for re-entries & exits. ⚠️ WARNING: This version repaints; signals can disappear before a bar closes.
Signal Scoring
A signal is only considered if it first meets two mandatory conditions: a momentum trend and VWMA trend alignment.
If these are met, the signal is then scored from 0 to 5 based on a checklist of five factors:
2-Bar Trend: Confirms initial momentum.
3-Bar Trend: Confirms sustained momentum.
VWMA Trend: Confirms main trend alignment.
Volume Pressure (OBV): Confirms money flow.
Volume Spike (RVOL): Confirms market interest.
A higher score indicates a stronger, higher-conviction signal.
Dynamic Momentum Oscillator with Adaptive ThresholdsDynamic Momentum Oscillator with Adaptive Thresholds (DMO-AT)
This advanced indicator is designed to provide traders with a robust tool for identifying momentum shifts, overbought/oversold conditions, and potential reversals in any market. Unlike traditional oscillators with fixed thresholds, DMO-AT uses adaptive levels that adjust based on current volatility (via ATR) and incorporates volume weighting for more accurate signals in high-volume environments.
#### Key Features:
- **Momentum Calculation**: A normalized momentum value derived from price changes, optionally weighted by volume for enhanced sensitivity.
- **Adaptive Thresholds**: Overbought and oversold levels dynamically adjust using ATR, making the indicator adaptable to volatile or ranging markets.
- **Signal Line**: An EMA of the momentum for crossover signals, helping confirm trend directions.
- **Divergence Detection**: Built-in alerts for bullish and bearish divergences between price and momentum.
- **Visual Enhancements**: Background coloring for quick zone identification, dashed static lines for reference, and a customizable stats table displaying real-time values.
- **Alerts**: Multiple alert conditions for crossovers, zone entries, and divergences to keep you notified without constant chart watching.
#### How to Use:
1. Add the indicator to your chart via TradingView's indicator search.
2. Customize inputs: Adjust the momentum length, source, ATR length, and threshold multiplier to fit your trading style (e.g., shorter lengths for scalping, longer for swing trading).
3. Interpret Signals:
- **Crossover**: Momentum crossing above the signal line suggests bullish momentum; below indicates bearish.
- **Zones**: Entering the overbought (red) zone may signal a potential sell; oversold (green) for buys.
- **Divergences**: Use alerts to spot hidden opportunities where price and momentum disagree.
4. Combine with other tools like moving averages or support/resistance for confluence.
5. Enable the stats table for at-a-glance insights on the chart.
This indicator is versatile across timeframes and assets, from stocks to crypto. It's optimized for clarity and performance, with no repainting.
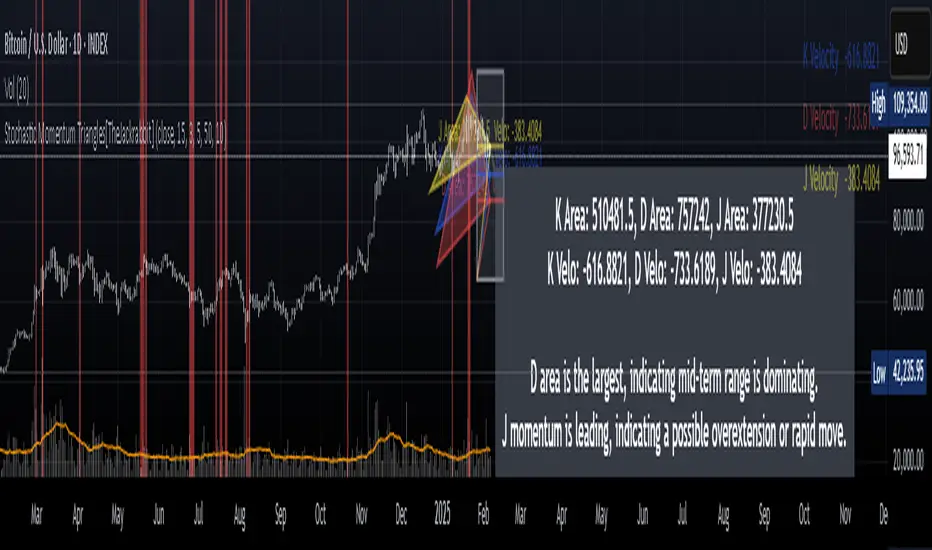
Stochastic Momentum Triangles[TheJackrabbit]This code is invite-only and in the experimental phase. Please contact the author if you are interested in testing.
**Stochastic Momentum Triangles ** is a custom indicator designed to integrate multiple dimensions of market momentum into a single, visual framework. Rather than relying on generic oscillators, this tool brings together stochastic calculations, price mapping, velocity measurement, and dynamic visual feedback to offer a layered view of market conditions.
#### Key Features and Components
- **Stochastic Calculations Mapped to Price Levels**
The indicator starts by computing the traditional stochastic oscillator values—%K, %D, and %J—over a user-defined period. These values are then mapped to the current price range. This mapping is achieved via a dedicated function that uses an exponential moving average and a rounding option, thereby linking momentum metrics directly with price dynamics.
- **Momentum Velocity and Its RSI**
To quantify the rate of change, the script calculates a “velocity” by measuring the difference in the price-mapped stochastic values over a specified lookback period. The resulting velocity values are then processed through a Relative Strength Index (RSI) calculation. This additional layer helps to provide a clearer picture of how rapidly market momentum is changing.
- **Triangle Area Measurement as a Volatility Proxy**
For each of the K, D, and J series, the indicator identifies the highest and lowest values within a user-specified lookback window and constructs triangles by connecting these extremes with the current value. The area of these triangles is computed, serving as an abstract measure of volatility and the range of price momentum. These areas are displayed alongside the velocity readings in an on-chart table for easy reference.
- **Dynamic Interpretation Label**
The tool also generates a concise reading in English that summarizes the relationships among the areas and velocity values. For example, it notes when one series, such as J, exhibits both the largest triangle area and the highest velocity. In such cases—suggesting an extended move or potential overextension—the label’s text color changes (to red) to visually alert the trader to an increased likelihood of a reversal. This approach allows traders to quickly assimilate the indicator’s data without overwhelming them with subjective language.
- **Additional Visual Elements**
Beyond the core calculations, the indicator includes a “momentum box” that captures the range of the stochastic-derived values over recent bars, as well as radial lines that provide a visual connection from the box’s reference point to current values. These elements together offer a structured, multi-faceted view of market dynamics.
#### Significance and Effects
This indicator takes a measured approach to integrating multiple aspects of market analysis. By combining price-based mapping with traditional stochastic and momentum measurements, it provides traders with:
- **A structured framework** to assess market range and momentum changes.
- **Visual cues** (such as the dynamic label and color changes) that highlight conditions warranting closer attention.
- **Tangible, calculated metrics**—triangle areas and velocity RSIs—that may assist in identifying potential reversal points.
Stochastic Momentum Triangles is intended to serve as a supplementary tool for traders who appreciate a quantitative perspective on market behavior. Its design focuses on clear, measurable outputs rather than relying on broad claims, allowing for a calm and thoughtful evaluation of market conditions.
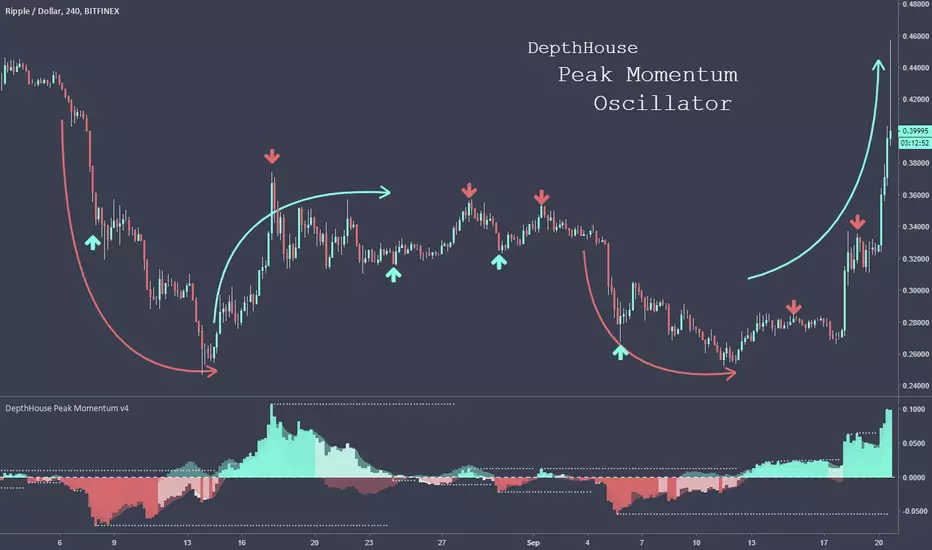
DepthHouse - Peak Momentum OscillatorDepthHouse Peak Momentum Oscillator uses advance calculations of linear regression to help determine price momentum and momentum peaks.
How to read it:
The least opaque columns represent general momentum direction.
When these columns are above the zero line, generally there is more bullish momentum in the market.
When they are below the zero line, generally there is more bearish momentum in the market.
When these columns turn white, it means the price could be losing its bullish or bearish momentum.
The more transparent columns in the background represent the lead band, which reacts faster than the general momentum columns.
This could be used to as a leading indication of where the market could be heading.
Swap Momentum Bands option:
This option removes the white columns from the general momentum histogram and in turn only gives signals when strong momentum is present.
How to use this Indicator:
For 30 days from this release (9/20/18) this indicator will be free to use! Either leave a comment below or feel free to send me a PM
After the 30 days from the release you can still
try this indicator for FREE! Just leave a comment, or feel free to send me a PM