Crypto Intraday Strategy by SAIFOverview
A comprehensive intraday trading strategy designed for cryptocurrency markets, combining multiple technical indicators and risk management principles to identify high-probability trading opportunities.
Key Features
Multi-Timeframe Analysis
Utilizes exponential moving averages for trend identification
Incorporates swing structure analysis for support and resistance levels
Applies momentum and trend strength filters
Risk Management
Configurable risk-reward ratios (default 1.6:1)
Maximum risk per trade capped at 3.1% of equity
Dynamic stop-loss placement based on market structure
Position sizing at 2% of equity per trade
Advanced Filters
Trend strength confirmation using ADX indicator
Momentum validation through multiple oscillators
Market correlation analysis for additional confluence
Optional weekend trading filter to avoid low-liquidity periods
Swing Structure Recognition
Automatically identifies key swing highs and lows
Uses pivot points to determine optimal entry zones
Prevents entries too far from established support/resistance
Trade Execution
The strategy employs a one-way trading approach, entering positions only when multiple technical conditions align. Each trade includes pre-defined stop-loss and take-profit levels calculated at entry.
Customization Options
Adjustable swing detection sensitivity
Configurable EMA distance thresholds
Optional correlation filters
Weekend trading toggle
Risk parameters can be modified to suit individual preferences
Important Disclaimers
⚠️ Educational Purpose Only: This strategy is provided for educational and informational purposes. Past performance does not guarantee future results.
⚠️ Risk Warning: Trading cryptocurrencies carries substantial risk of loss. Only trade with capital you can afford to lose.
⚠️ Not Financial Advice: This tool does not constitute financial, investment, or trading advice. Always conduct your own research and consult with qualified financial professionals.
⚠️ Backtesting Limitations: Historical backtesting results may not reflect actual trading conditions due to slippage, execution delays, and changing market dynamics.
Fees & Slippage
Commission: 0.12% per trade
Slippage: 2 ticks accounted for in backtesting
Recommended Usage
Thoroughly backtest on your preferred trading pairs
Start with small position sizes when live trading
Monitor performance across different market conditions
Adjust parameters based on asset volatility and your risk tolerance
Cari dalam skrip untuk "momentum"

Options Scalper v2 - SPY/QQQHere's a comprehensive description of the Options Scalper v2 strategy:
---
## Options Scalper v2 - SPY/QQQ
### Overview
A multi-indicator confluence-based scalping strategy designed for trading SPY and QQQ options on short timeframes (1-5 minute charts). The strategy uses a scoring system to generate high-probability CALL and PUT signals by requiring alignment across multiple technical indicators before triggering entries.
---
### Core Logic
The strategy operates on a **scoring system (0-9 points)** where both bullish (CALL) and bearish (PUT) conditions are evaluated independently. A signal only fires when:
1. A recent EMA crossover occurred (within the last 3 bars)
2. The direction's score meets the minimum threshold (default: 4 points)
3. The signal's score is higher than the opposite direction
4. Enough bars have passed since the last signal (cooldown period)
5. Price action occurs during valid trading sessions
---
### Indicators Used
| Indicator | Purpose | CALL Condition | PUT Condition |
|-----------|---------|----------------|---------------|
| **9/21 EMA Cross** | Primary trigger | Fast EMA crosses above slow | Fast EMA crosses below slow |
| **200 EMA** | Trend filter | Price above 200 EMA | Price below 200 EMA |
| **RSI (14)** | Momentum filter | RSI between 45-65 | RSI between 35-55 |
| **VWAP** | Institutional level | Price above VWAP | Price below VWAP |
| **MACD (12,26,9)** | Momentum confirmation | MACD line > Signal line | MACD line < Signal line |
| **Stochastic (14,3)** | Overbought/Oversold | Oversold or K > D | Overbought or K < D |
| **Volume** | Participation confirmation | Spike on green candle | Spike on red candle |
| **Price Structure** | Breakout detection | Higher high formed | Lower low formed |
---
### Scoring Breakdown
**CALL Score (Max 9 points):**
- Recent EMA cross up: +2 pts
- EMA alignment (fast > slow): +1 pt
- RSI in bullish range: +1 pt
- Above VWAP: +1 pt
- MACD bullish: +1 pt
- Volume spike on green candle: +1 pt
- Stochastic setup: +1 pt
- Above 200 EMA: +1 pt
- Breaking higher high: +1 pt
**PUT Score (Max 9 points):**
- Recent EMA cross down: +2 pts
- EMA alignment (fast < slow): +1 pt
- RSI in bearish range: +1 pt
- Below VWAP: +1 pt
- MACD bearish: +1 pt
- Volume spike on red candle: +1 pt
- Stochastic setup: +1 pt
- Below 200 EMA: +1 pt
- Breaking lower low: +1 pt
---
### Risk Management
The strategy uses **ATR-based dynamic stops and targets**:
| Parameter | Default | Description |
|-----------|---------|-------------|
| Stop Loss | 1.5x ATR | Distance below entry for longs, above for shorts |
| Take Profit | 2.0x ATR | Creates a 1:1.33 risk-reward ratio |
Positions are also closed on:
- Opposite direction signal (flip trade)
- Take profit or stop loss hit
---
### Session Filtering
Trades are restricted to high-liquidity periods by default:
- **Morning Session:** 9:30 AM - 11:00 AM EST
- **Afternoon Session:** 2:30 PM - 3:55 PM EST
This avoids choppy midday price action and captures the highest volume periods.
---
### Input Parameters
| Parameter | Default | Description |
|-----------|---------|-------------|
| Fast EMA | 9 | Fast moving average period |
| Slow EMA | 21 | Slow moving average period |
| Trend EMA | 200 | Long-term trend filter |
| RSI Length | 14 | RSI calculation period |
| RSI Overbought | 65 | Upper RSI threshold |
| RSI Oversold | 35 | Lower RSI threshold |
| Volume Multiplier | 1.2x | Volume spike detection threshold |
| Min Signal Strength | 4 | Minimum score required to trigger |
| Crossover Lookback | 3 | Bars to consider crossover "recent" |
| Min Bars Between Signals | 5 | Cooldown period between signals |
---
### Visual Elements
**Chart Plots:**
- Green line: 9 EMA (fast)
- Red line: 21 EMA (slow)
- Gray line: 200 EMA (trend)
- Purple dots: VWAP
**Signal Markers:**
- Green triangle up + "CALL" label: Buy call signal
- Red triangle down + "PUT" label: Buy put signal
- Small circles: EMA crossover reference points
**Info Table (Top Right):**
- Real-time CALL and PUT scores
- RSI, MACD, Stochastic values
- VWAP and 200 EMA position
- Recent crossover status
- Current signal state
---
### Alerts
| Alert Name | Trigger |
|------------|---------|
| CALL Entry | Standard call signal fires |
| PUT Entry | Standard put signal fires |
| Strong CALL | Call signal with score ≥ 6 |
| Strong PUT | Put signal with score ≥ 6 |
---
### Recommended Usage
| Setting | 0DTE Scalping | Intraday Swings |
|---------|---------------|-----------------|
| Timeframe | 1-2 min | 5 min |
| Min Signal Strength | 5-6 | 4 |
| ATR Stop Mult | 1.0 | 1.5 |
| ATR TP Mult | 1.5 | 2.0 |
| Option Delta | 0.40-0.50 | 0.30-0.40 |
---
### Key Improvements Over v1
1. **Requires actual crossover** - Eliminates false signals from simple trend continuation
2. **Balanced scoring** - Both directions evaluated equally, highest score wins
3. **Signal cooldown** - Prevents overtrading with minimum bar spacing
4. **Multi-indicator confluence** - 8 factors must align for signal generation
5. **Volume-candle alignment** - Volume spikes only count when matching candle direction
---
### Disclaimer
This strategy is for educational purposes. Backtest thoroughly before live trading. Options trading involves significant risk of loss. Past performance does not guarantee future results.

The Truth Sniper: Breathing Edition**Overview**
This is a highly advanced trend-following strategy designed to filter out market noise ("Fakeouts") and manage risk using a dynamic "Breathing Ratchet" mechanism. It combines traditional trend analysis with institutional money flow logic to identify the true market direction.
**Key Features**
**1. The Conflict Zone (Gray Zone Filter)**
Most strategies fail during low-volume accumulation or distribution phases. This algorithm introduces a "Conflict Zone" logic:
* **True Rally (Green):** Price is above EMA50 AND Money Flow (VFI) is positive.
* **True Drop (Red):** Price is below EMA50 AND Money Flow (VFI) is negative.
* **Conflict (Gray Background):** When Price and Money Flow disagree (e.g., Price rising on negative volume), the background turns Gray. **Trading is disabled** in these zones to avoid bull/bear traps.
**2. Breathing Stop-Loss Mechanism (Volatility Adjusted)**
The Stop Loss isn't static. It "breathes" based on market heat (Volume/RSI):
* **High Heat (High Volatility):** The SL loosens its grip, moving towards the bottom of the Fibonacci zone to allow price fluctuation without premature exits.
* **Low Heat (Low Volatility):** The SL tightens aggressively towards the price to lock in profits during slow momentum.
**3. The Ratchet Lock (Slippage Prevention)**
To ensure maximum profit retention, the "Breathing" mechanism is governed by a **Ratchet Logic**:
* **For Longs:** The Stop Loss can ONLY move UP. If the "Breathing" calculation suggests lowering the stop (due to increased volatility), the Ratchet blocks it, keeping the SL at the highest historical level.
* **For Shorts:** The Stop Loss can ONLY move DOWN.
**4. Fibonacci Exit Zones**
Exits are calculated based on a 60-day dynamic High/Low lookback, creating "Zones" (0-23.6%, 23.6-38.2%, etc.) that the price must conquer. The SL trails these zones mechanically.
**Visual Guide**
* **Lime/Red Background:** Active Trade Zone (Confirmed Trend).
* **Gray Background:** Conflict Zone (Stay Out / Hold).
* **Purple 'X':** The exact price level where the Stop Loss was hit (Fixed marker).
* **Stepline:** The active Stop Loss level (Visible only during open trades).
**Disclaimer**
This script is for educational and research purposes only. Always manage your risk.

W/M Pattern Strategy + MACD/RSI Confirmation V3.0 by ThaungkmitlW/M Pattern Strategy + MACD/RSI Confirmation V3.0
Description Text:
This script is a comprehensive Strategy (backtestable) that combines classical Chart Patterns with momentum indicators to identify high-probability reversal setups. It focuses on detecting "W" Patterns (Double Bottoms/Higher Lows) and "M" Patterns (Double Tops/Lower Highs), filtered by MACD and RSI to reduce false signals.
How It Works
The strategy relies on a "Confluence" of three factors before triggering an entry:
1. Price Action Patterns (W & M)
W Pattern (Bullish): The script detects Pivot Lows. If a new Pivot Low is higher than the previous one (forming a Higher Low structure), it marks a potential "W" pattern.
M Pattern (Bearish): The script detects Pivot Highs. If a new Pivot High is lower than the previous one (forming a Lower High structure), it marks a potential "M" pattern.
2. MACD Confirmation (Zero Line)
Price action alone is not enough. The script waits for the MACD Line to cross the Zero Line:
Buy: MACD crosses UP over 0 (indicating bullish momentum shift).
Sell: MACD crosses DOWN under 0 (indicating bearish momentum shift).
3. RSI Threshold
To ensure the trend has strength, the RSI (Relative Strength Index) acts as a final filter:
Buy Condition: RSI must be above 50.
Sell Condition: RSI must be below 50.
Visual Features
Pivot Labels: Automatically marks Pivot High (Red Triangle) and Pivot Low (Green Triangle).
Pattern Lines: Draws lines connecting the swing points when a potential W or M pattern is detected.
Signals: Displays "BUY" or "SELL" labels with text explaining the setup (e.g., "W+MACD+RSI").
Background: Highlights the chart background (Green/Red) when a valid trade signal occurs.
EMAs: Plots EMA 10 (Blue) and EMA 15 (Red) to help you visualize the immediate trend direction.
Settings
Pivot Left/Right Bars: Adjust the sensitivity of the Swing detection.
MACD Settings: Fast, Slow, and Signal lengths (Standard 12, 26, 9).
RSI Settings: Adjust Length and the Threshold level (Default is 50).
Backtesting
This is a strategy script, meaning you can use the Strategy Tester panel below the chart to see how this logic performs on historical data for your chosen timeframe and asset.
Disclaimer: This tool is for educational purposes. Past performance in backtesting does not guarantee future results.

YCGH Ultimate Stocks Breakout Sniper📈 YCGH Ultimate Stocks Breakout Sniper
Overview
A sophisticated momentum-based breakout strategy designed to capture high-probability directional moves during volatility expansion phases. This system identifies breakout opportunities when price decisively breaks through established ranges, combining multiple technical filters to enhance signal quality and minimize false breakouts.
🎯 Strategy Features
Core Methodology:
Proprietary breakout detection algorithm
Multi-layered confirmation filters for signal validation
Adaptive trailing stops for profit protection
Systematic risk management with daily drawdown controls
Key Components:
✅ Volatility Expansion Filter - Only trades during periods of elevated market volatility to avoid choppy, range-bound conditions
✅ Optional Trend Alignment - Configurable trend filter (EMA/SMA/RMA/WMA) to align entries with broader market direction
✅ ROC Momentum Filter - Daily rate-of-change filter to capture strong momentum days (optional)
✅ Comprehensive Exit Strategy:
Fixed stop-loss (default 2%)
Take-profit targets (default 9%)
Dynamic trailing stops (2% activation, 0.5% offset)
✅ Flexible Direction Trading:
Auto-detect mode: Long+Short for perpetuals, Long-only for spot/equities
Manual override options available
Suitable for both crypto and stock markets
📊 Market Applicability
Optimized for: Cryptocurrency perpetual contracts and equity markets (1H-4H timeframes)
Also effective on: Futures and high-liquidity spot markets
The strategy adapts to different market regimes through configurable volatility and trend filters, making it versatile across various trading instruments and timeframes.
⚙️ Risk Management
Position Sizing: Percentage-based allocation with leverage support
Intraday Loss Limit: Maximum 10% drawdown protection (configurable)
Realistic Cost Modeling: 0.025% commission + 1 tick slippage
No Pyramiding: Single position management for controlled risk exposure
📈 Performance Visualization
Includes a comprehensive monthly returns table displaying:
Year-by-year performance breakdown
Monthly profit/loss percentages
Visual color-coding (green for profits, red for losses)
Clean, modern design with transparent styling
🔐 Access & Pricing
This is a PROTECTED, invite-only strategy.
The source code is not open-source and requires paid access for usage.
How to Get Access:
📧 Email: brijamohanjha@gmail.com
Include in your email:
Your TradingView username
Markets/assets you plan to trade
Preferred timeframe
What You'll Receive:
Full strategy access with invite-only permissions
Complete parameter documentation
Setup and optimization guidance
Implementation support
⚠️ Important Disclosures
Backtesting Parameters:
Commission: 0.025% per trade
Slippage: 1 tick
Results reflect realistic trading conditions
Risk Warning:
Past performance does not guarantee future results. This strategy involves substantial risk and may not be suitable for all investors. Users should thoroughly understand the risks and customize parameters based on their risk tolerance and market conditions.
📞 Contact for Access
Email: brijamohanjha@gmail.com
For questions about functionality, pricing, optimization, or market-specific settings, please reach out via email.
Note: This is a premium, paid strategy. Access is granted manually after consultation and payment confirmation.

YCGH Crypto ultimate Breakout StrategyAdvanced Momentum Breakout Strategy - Optimized for crypto markets, proven effective on equities
Core Features:
Multi-layered signal generation combining volatility expansion and momentum confirmation
Adaptive risk management with dynamic stops, profit targets, and trailing mechanisms
Systematic position sizing with configurable leverage (designed for perpetual/margin trading)
Volatility regime filters to avoid false breakouts during low-momentum periods
Optional trend alignment for directional bias confirmation
Comprehensive backtesting with realistic slippage and commission modeling
Daily drawdown limits for capital preservation
Performance:
Applicable across multiple timeframes (1H, 4H, Daily)
Works on both spot and derivatives markets
Long and short position capability
Interested in using this strategy? This is a paid service. For access to the complete script and implementation support, email: brijamohanjha@gmail.com

Triple EMA + RSI + ATRThis comprehensive trading system combines triple EMA alignment, RSI momentum filtering, and dynamic ATR-based risk management. The strategy enters positions only when fast, medium, and slow EMAs align in proper order (bullish or bearish), confirmed by RSI remaining within defined thresholds (not overbought/oversold) and a volume spike above its moving average. Exits are managed intelligently using a multi-tier approach: a fixed stop-loss based on ATR, a first profit target at a predefined risk-reward ratio, and a trailing stop that activates after reaching a second, higher profit tier. Designed for trend-following with built-in momentum and volume confirmation, it features professional order execution with configurable commission and slippage for realistic backtesting. Visual cues including colored backgrounds and signal shapes enhance chart clarity.

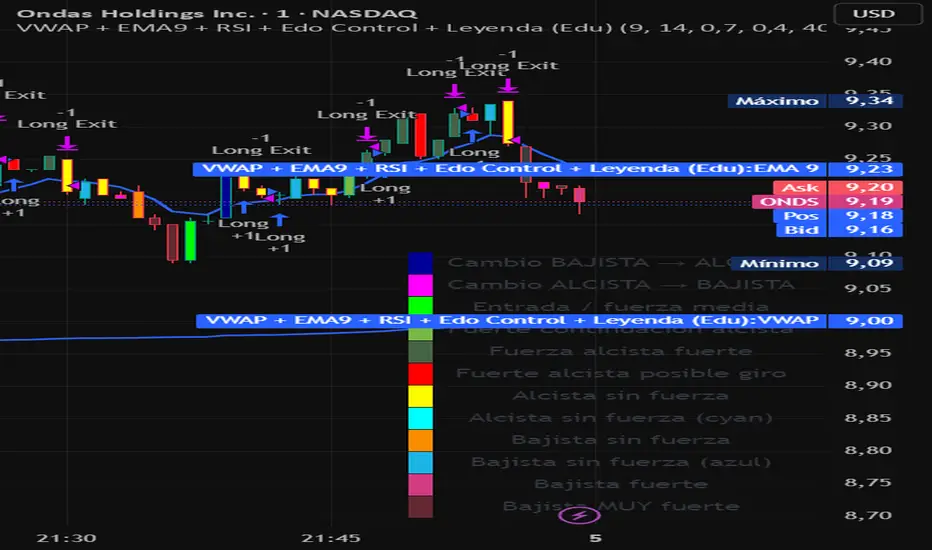
VWAP + EMA9 + RSI + Edo Control (Edu)VWAP + EMA9 + RSI + Edo Control (Edu)
A complete intraday scalping system that combines institutional levels, fast trend signaling and enhanced candle-color analysis for maximum clarity and confirmation.
This indicator includes:
1. VWAP (Volume Weighted Average Price)
The institutional reference line used to determine value zones, liquidity bias and directional pressure.
2. EMA9 (Fast Exponential Moving Average)
A micro-trend guide that reacts quickly to short-term movements and improves timing on pullback entries.
3. RSI (Relative Strength Index)
A clean momentum filter using the classic >50 (bullish) and <50 (bearish) bias.
Edo Control – Advanced Colored Candle System
This version integrates Edo Control, a custom candle-color engine that visualizes market strength shifts based on Williams %R, directional movement and ADX behavior.
Each candle color represents a different market condition, such as:
Trend acceleration
Trend weakening
Possible reversals
Momentum spikes
Bullish or bearish pressure
Transition zones
A built-in movable legend explains the meaning of each color directly on the chart, so traders can identify conditions instantly without guessing.
Why this indicator works
The combination of VWAP + EMA9 + RSI + colored candle strength creates a multi-layer confirmation system that cuts noise and highlights only meaningful setups.
Designed for 1m, 3m, 5m charts, but also effective on higher timeframes.
Suitable for: stocks, indices, futures, forex, crypto.
Long Only EMA Strategy (9/20 with 200 EMA Filter)Details:
This strategy is built around a very simple idea: follow the primary trend and enter only when momentum supports it.
It uses three EMAs on a standard candlestick chart:
1. 9‑period EMA – short‑term momentum
2. 20‑period EMA – medium‑term structure
3. 200‑period EMA – long‑term trend filter
The strategy is ** long‑only ** and is mainly designed for swing trading and positional trading.
It avoids counter‑trend trades by taking entries only when price is trading ** above the 200 EMA **, which is commonly used as a long‑term trend reference.
The rules are deliberately kept simple so that they are easy to understand, modify, and test on different markets and timeframes.
---
Key Features
1. **Trend‑Filtered Entries**
- Fresh long positions are considered only when:
- The 9 EMA crosses above the 20 EMA
- The closing price is **above** the 200 EMA
- This attempts to combine short‑term momentum with a higher‑timeframe trend filter.
2. **Clean Exit Logic**
- The long position is exited when the closing price crosses **below** the 20 EMA.
- This creates an objective, rule‑based way to trail the trade as long as the medium‑term structure remains intact.
3. **Long‑Only, No Short Selling**
- The script intentionally ignores short setups.
- This makes it suitable for markets or accounts where short selling is restricted, or for traders who prefer to participate only on the long side of the market.
4. **Simple Visuals**
- All three EMAs are plotted directly on the chart:
- 9 EMA (fast)
- 20 EMA (medium)
- 200 EMA (trend)
- Trade entries and exits are handled by TradingView’s strategy engine, so users can see results in the Strategy Tester as well as directly on the chart.
5. **Backtest‑Friendly Structure**
- Uses TradingView’s built‑in `strategy()` framework.
- Can be applied to different symbols, timeframes, and markets (equities, indices, crypto, etc.).
- Works on standard candlestick charts, which are supported by TradingView’s backtesting engine.
6. **Configurable in Code**
- The EMA periods are defined in the code and can be easily adjusted.
- Users can tailor the parameters to fit their own style (for example, faster EMAs for intraday trading, slower EMAs for positional trades).
---
How to Use
1. **Add the Strategy to Your Chart**
1. Open any symbol and select a **standard candlestick chart**.
2. Apply the strategy from your “My Scripts” section.
3. Make sure it is enabled so that the trades and results appear.
2. **Select Timeframe**
- The logic can be tested on various timeframes:
- Higher timeframes (1H, 4H, 1D) for swing and positional setups.
- Lower timeframes (5m, 15m) for more active trading, if desired.
- Users should experiment and see where the strategy behaves more consistently for their chosen market.
3. **Read the Signals**
- **Entry:**
- A long trade is opened when the 9 EMA crosses above the 20 EMA while the closing price is above the 200 EMA.
- **Exit:**
- The open long position is closed when the closing price crosses below the 20 EMA.
- All orders are generated automatically once the strategy is attached to the chart.
4. **Use the Strategy Tester**
- Go to the **Strategy Tester** tab in TradingView.
- Check:
- Net profit / drawdown
- Win rate and average trade
- List of trades and the equity curve
- Change the date range and timeframe to see how stable the results are over different periods.
5. **Adjust Parameters if Needed**
- Advanced users can open the code and experiment with:
- EMA lengths (for example 8/21 with 200, or 10/30 with 200)
- Risk sizing and capital settings within the `strategy()` call
- Any changes should be thoroughly re‑tested before considering real‑world application.
---
Practical Applications
1. **Swing Trading on Daily Charts**
- Can be applied to stocks, indices, or ETFs on the daily timeframe.
- The 200 EMA acts as a trend filter to stay aligned with the broad direction, while the 9/20 crossover helps catch medium‑term swings inside that trend.
2. **Positional Trades on Higher Timeframes**
- On 4H or 1D charts, this approach can help in holding trades for several days to weeks.
- The exit rule based on the 20 EMA crossing helps avoid emotional decisions and provides a rules‑based way to trail the trend.
3. **Trend‑Following Filter**
- Even if used purely as a filter, the 200 EMA condition can help traders:
- Avoid taking long trades when the market is in a clear downtrend.
- Focus only on instruments that are trading above their long‑term average.
4. **Educational Use**
- The script is intentionally kept straightforward so that newer users can:
- Learn how a moving average crossover strategy works.
- See how to combine a short‑term signal with a long‑term filter.
- Understand how TradingView’s strategy engine handles entries and exits.
5. **Basis for Further Development**
- This can serve as a starting point for more advanced systems.
- Traders can extend it by adding:
- Additional filters (RSI, volume, volatility filters, time‑of‑day filters, etc.)
- Risk management rules (fixed stop loss, take profit, trailing stops).
- The current version is kept minimal on purpose, so modifications are easy to implement and test.
---
Important Notes & Disclaimer
1. This strategy is provided **for testing, research, and educational purposes only**.
2. It is ** not ** a recommendation to buy or sell any financial instrument.
3. Past performance on historical data does not guarantee similar results in live markets.
4. Markets are risky and trading can lead to financial loss; users should always do their own research, manage risk appropriately, and consult a qualified financial professional if needed.
5. Before using any strategy with real capital, it is strongly advised to:
- Forward test it on a demo / paper trading account.
- Check how it behaves during different market phases (trending, sideways, high‑volatility conditions).
You are free to modify the parameters and logic to better align it with your own trading style and risk tolerance.

RSI Risk | AlgoFy TraderRSI Risk | AlgoFy Trader
Overview
The RSI Risk | AlgoFy Trader is a trading system that combines RSI-based entry signals with automated capital management. This strategy identifies potential momentum shifts while controlling risk through calculated position sizing.
Key Features
Dynamic Risk Management:
Fixed Risk Per Trade: Users set maximum risk percentage per trade.
Automatic Position Sizing: Calculates position size based on stop-loss distance.
Capital Protection: Limits each trade's risk to user-defined percentage.
RSI Entry System:
Momentum Detection: Uses RSI crossovers above/below defined thresholds.
Clear Signals: Provides long/short entries on momentum transitions.
Multiple Exit Layers:
Dynamic Stop Loss: Stop based on recent price structure.
Fixed Safety Stop: Optional percentage-based stop loss.
Partial Take Profit: Optional early profit-taking.
Trailing Stop: Optional dynamic profit protection.
Performance Tracking:
Trade Statistics: Tracks win/loss streaks and performance metrics.
Monthly Dashboard: Shows monthly/yearly P&L with equity views.
Trade Details: Displays risk percentage and position size.
How It Works
Signal Detection: Monitors RSI for crossover events.
Risk Calculation: Determines stop-loss based on recent volatility.
Position Sizing: Calculates exact position to match risk percentage.
Example:
Account: $10,000 | Risk: 2% ($200 max)
Stop loss at 4% distance
Position size: $5,000
Result: 4% loss on $5,000 = $200 (2% of account)
Recommended Settings
Risk: 1-2% per trade
Enable fixed stop at 3-4%
Consider trailing stop activation
This script provides disciplined RSI trading with automated risk control, adjusting exposure while maintaining strict risk limits.

Triple Screen Scalper [Pro] + Dynamic Risk Engine + Smart DCA🚀 Strategy Concept
This algorithm utilizes a Triple Screen methodology to filter market noise and align trades with the path of least resistance. Instead of relying on a single timeframe, it analyzes market structure across three distinct "horizons" to ensure high-probability execution:
The Tide (Long-Term): Analyzes the dominant directional flow and market bias on higher timeframes.
The Wave (Medium-Term): Measures the strength of the current momentum and pauses trading during weak or "choppy" market phases.
The Ripple (Short-Term): Pinpoints precise entry zones by detecting over-extended price action and mean-reversion opportunities within the larger trend.
The system is fortified with a Smart DCA (Dollar Cost Averaging) Engine that adapts to volatility. It does not blindly add to positions; it calculates "Risk Room" and "Trend Stability" before every additional entry, ensuring capital is deployed efficiently rather than recklessly.
⚙️ Configuration Guide (Variable Explanations)
💰 Position & Leverage
Trade Direction: Choose between Long, Short, or Auto. In "Auto," the system trades both directions based on the dominant trend.
Target Entry Leverage (x): The desired leverage for your initial entry.
Base Order Size (% of Equity): How much of your account balance is allocated to the very first trade of a sequence.
DCA Size Multiplier: Controls how much larger each subsequent order is compared to the previous one. A value of 1.0 means flat sizing; values above 1.0 increase the size of recovery orders.
KILL SWITCH: Max Effective Lev: A safety ceiling. If your total position's effective leverage exceeds this value, the strategy will force-close the position to prevent liquidation.
🚀 Profit Settings (Dynamic Exits)
Use Dynamic Profit?: If enabled, the take-profit target acts like a breathing lung—expanding during high volatility (to catch bigger moves) and contracting during quiet periods.
Gain Volatility Length: The lookback period used to measure recent market volatility.
Gain Multiplier: Scales the profit target. Higher numbers require a larger price move to hit profit; lower numbers take profit sooner.
Minimum Profit Floor %: A hard limit ensuring the target never drops below this percentage, even in extremely low-volatility markets.
📉 Trend & Momentum Filters
Trend Strength Threshold: Defines the minimum "velocity" required to trade. This filters out flat, ranging markets where trends are not established.
Momentum Sensitivity (K/D/Smooth): These variables tune the sensitivity of the entry trigger.
Lower numbers = Faster entries (more trades, potentially more noise).
Higher numbers = Slower, more confirmed entries.
Overbought / Oversold Levels: The specific zones (0-100) where price is considered statistically over-extended, triggering a reversal signal.
🛡️ Risk & DCA Settings
Enable Hard Stop Loss: A traditional safety stop based on a fixed percentage.
Max DCA Orders: The maximum number of times the strategy is allowed to "average down" on a position.
Require Trend for DCA?: If TRUE, the strategy will only add to a losing position if the broader market trend is still valid. If the trend breaks, it stops buying.
DCA Volatility Length/Multiplier: Controls the spacing between buy orders.
High Multiplier = Orders are spread far apart (safer for crashes).
Low Multiplier = Orders are closer together (faster recovery in normal dips).
Risk Scaling: A unique feature that pushes DCA orders further away as your leverage increases, protecting you from adding too much risk too quickly.
Base DCA %: The minimum distance required between orders, regardless of volatility.
⏱️ Timers & Cooldowns
Fast / Slow Cooldown: The minimum time (in seconds) the strategy must wait between realizing a profit and opening a new trade. This prevents "revenge trading" or entering twice on the same candle.
Position Cooldown: A specific timer applied after a large position is closed to let the market settle.
🎯 Daily S/R Targets
Enable Daily S/R: If enabled, the strategy will attempt to "snipe" exits at calculated daily support and resistance pivots.
Proximity Threshold: How close the price must get to a daily level to trigger an early exit.
⚠️ Risk Disclaimer
This script is an automated tool for analysis and execution assistance. It employs averaging techniques (DCA) which involve calculated risk. While the "Kill Switch" and "Risk Scaling" features are designed to mitigate exposure, users should thoroughly backtest and understand the "Multiplier" settings before deploying real capital. Past market structure is not a guarantee of future performance.

Ghost Robo Plus [Bit2Billions]Ghost Robo Plus — Rule-Based Trade Management System
*An advanced, rule-based trading strategy for structured entries, exits, and complete trade management using Heikin-Ashi logic.*
Ghost Robo Plus simplifies trade execution by automating entry, stop-loss, and multiple take-profit levels, all visualized cleanly on your chart. It supports position sizing, backtesting, alerts, and real-time trade tracking, making it easy for traders to test strategies, validate ideas, and follow trades without chart clutter.
Key Features
1. Heikin-Ashi Entry System
* Generates clear long/short signals based on Heikin-Ashi candle crossovers.
* Structured entry logic ensures precise timing aligned with trend direction.
2. Multiple Exit Modes (Switch Anytime)
* ATR Mode: TP1/TP2/TP3 and SL based on ATR distance calculations.
* Trailing Mode: Dynamic trailing logic for trend-following continuation.
* Options Mode: Original options-style behavior preserved for flexible testing.
3. Multi–Take-Profit Structure
* Three configurable take-profit levels (TP1, TP2, TP3) with adjustable percentage splits.
* Enables partial profit-taking with structured scaling.
4. ATR-Based Calculations
* All TP and SL levels are derived from ATR length, profit factors, and stop factors.
* Volatility-adjusted trade placement ensures adaptive risk/reward.
5. Visual Trade Manager
* Automatically draws Entry, Stop Loss, and TP lines directly on chart.
* Includes on-chart labels for Entry, SL, TP, and mini entry/exit markers.
* Visuals update automatically per trade, removing clutter or leftover objects.
6. Alerts
* Built-in alerts for:
* Long entry
* Short entry
* TP/SL exits
* Any trade event (unified alert option)
7. Position Sizing & Commission Support
* Percent-of-equity sizing (10% default, fully adjustable).
* Supports TradingView strategy commission settings for realistic backtesting.
What Ghost Robo Plus Solves
* Automates TP/SL drawings and scaling for faster analysis.
* Lets traders test multiple exit styles without rewriting logic.
* Ensures clear, consistent on-chart visualization for every trade.
* Provides a structured workflow for backtesting and strategy validation.
* Eliminates chart clutter with synchronized, auto-updating visual elements.
Inputs & High-Level Settings
* TPS Mode: ATR / Trailing / Options
* Risk Settings: ATR length, profit factor, stop factor
* TP Splits: Adjustable TP1/TP2/TP3 percentages
* Position Sizing: Percent of equity (default 10%)
* Visual Controls: Auto-managed lines & labels
* Alerts: Entry/exit event triggers
Recommended Timeframes & Markets
* Recommended starting timeframes: 15m and higher (15m, 1H, 4H, Daily). Works on intraday but benefits from cleaner HTF structure.
* Suitable for liquid FX pairs, major crypto, indices and liquid equities.
* On illiquid or low-volume instruments, the volume-split and total-volume filters should be tightened, or higher timeframes should be used.
What Ghost Suite Solves
* Helps reduce manual charting work
* Speeds up analysis with automated visual tools
* Cuts through chart noise for improved clarity
* Provides consistent, rule-based visualization for workflows
Inputs & Settings
* Default settings pre-configured
* Simple Show/Hide toggles for modules
* Minimal exposed fields for ease of use
Recommended Timeframes & Markets
* Works best on 15M, 1H, 4H, Daily, and higher
* Suitable across forex, crypto, indices, and liquid equities
* Pivot-based modules may show noise on illiquid assets
Performance & Limitations
* May draw many objects → disable unused modules for speed
* Refresh the chart if historical buffer issues occur
* TradingView platform limitations handled internally
License & Legal
* Proprietary © 2025
* Redistribution, resale, or disclosure prohibited
* Independently developed with proprietary extensions
* Any resemblance to other tools may result from public-domain concepts
Respect & Transparency
* Built on widely recognized public trading concepts.
* Developed with respect for the TradingView community.
* Any overlaps or similarities can be addressed constructively.
Disclaimer
* Educational purposes only
* Not financial advice
* Trading carries risk — always use paper testing and proper risk management
FAQs
* Source code is not public
* Works best on 15m, 1H, 4H, Daily, Weekly charts
* Modules can be hidden/shown with toggles
* Alerts can be set up manually by users
* Supports multiple markets: forex, crypto, indices, and equities
About Ghost Trading Suite
Author: BIT2BILLIONS
Project: Ghost Trading Suite © 2025
Indicators: Ghost Matrix, Ghost Protocol, Ghost Cipher, Ghost Shadow
Strategies: Ghost Robo, Ghost Robo Plus
Pine Version: V6
The Ghost Trading Suite is designed to simplify and automate many aspects of chart analysis. It helps traders identify market structure, divergences, support and resistance levels, and momentum efficiently, reducing manual charting time.
The suite includes several integrated tools — such as Ghost Matrix, Ghost Protocol, Ghost Cipher, Ghost Shadow, Ghost Robo, and Ghost Robo Plus — each combining analytical modules for enhanced clarity in trend direction, volatility, pivot detection, and momentum tracking.
Together, these tools form a cohesive framework that assists in visualizing market behavior, measuring momentum, detecting pivots, and analyzing price structure effectively.
This project focuses on providing adaptable and professional-grade tools that turn complex market data into clear, actionable insights for technical analysis.
Crafted with 💖 by BIT2BILLIONS for Traders. That's All Folks!
Changelog
v1.0 — Initial Release
* Added Heikin-Ashi–based long/short entry system.
* Introduced three exit modes: ATR, Trailing, and Options.
* Added full multi-TP support with configurable TP1/TP2/TP3 quantities.
* Implemented ATR-based TP/SL calculations for ATR mode.
* Added on-chart visuals for Entry, SL, and TP levels with dynamic cleanup.
* Introduced queue-safe line/label manager to avoid object clutter.
* Added alerts for entries, exits, and general signals.
* Enabled position sizing, backtesting, and commission settings.
* Polished internal logic with a clean, auditable structure for reliability.

DOGE Stochastic RSI Pro System📌 Strategy Overview
The DOGE Stochastic RSI Pro System is a high-precision algorithm designed specifically for DOGEUSDT on the 1-hour timeframe.
It combines the power of Stochastic RSI momentum, EMA trend direction, and VWAP price positioning to generate high-probability long and short entries.
This system was optimized through multi-year backtesting and short-term adaptive tuning, showing strong performance during trending and volatility-rich periods.
📌 Technical Logic
✔ 1. Stochastic RSI Core
Entry when %K crosses %D
Detects momentum reversals early
Works effectively on DOGE volatility cycles
✔ 2. EMA Trend Filter
EMA50 above EMA150 → long-bias signals allowed
EMA50 below EMA150 → short-bias signals allowed
Prevents trading against the dominant trend
Improves signal accuracy
✔ 3. VWAP Institutional Filter
Price above VWAP → only long entries
Price below VWAP → only short entries
Avoids low-quality trades in mean-reversion zones
📌 Money Management
✔ Starting Amount: 5 USDT
✔ Take Profit: 3%
✔ Stop Loss: 3%
✔ Both Long & Short
✔ No Martingale — Clean, stable system
The strategy opens one position at a time to avoid overexposure.
📌 Recommended Settings
Pair: DOGEUSDT
Timeframe: 1H
Leverage (Bybit): 5–10× (optional, system does not enforce leverage)
Broker Execution: Bybit derivatives or spot with position sizing
📌 Backtesting Results (User Verified)
1 Year Backtest: ~57–58% win rate
2 Year Backtest: ~56% win rate
Last 3 Months: ~61% win rate
Last 30 Days: ~64% win rate
Profit Factor Range: 1.32 – 1.70
This system performs best in moderate trending + volatility expansion cycles.
📌 Notes for Users
Strategy does not repaint.
Behavior may vary depending on exchange price feeds.
Use proper risk management and test before going live.
Performance may change over time as markets shift.
📌 Access
This is an Invite-Only script.
Access is granted only to approved users.
If you'd like access, send a private request.
📌 Disclaimer
This script is for educational and research purposes only.
Not financial advice. Trading involves risk.
Past performance does not guarantee future results.

SSL ST Strategy – Accuracy Enhanced v2.0 (Parser Safe)This strategy is built to identify high-probability trend breakouts using a combination of SSL Channel, Baseline, Hull / EMA signals, and Candle-based confirmations.
The goal is to filter noise, avoid false breakouts, and enter only when the trend is truly shifting.
This strategy identifies high-probability trend breakouts using SSL Channel, Baseline, Hull/EMA, and candle
confirmations.
1. SSL shows trend shift when price breaks high/low levels.
2. Baseline filters direction (price above = buy bias, below = sell bias).
3. Hull/EMA gives early momentum confirmation.
4. Candle breakout ensures real momentum (breaks previous high/low).
5. Optional filters: ATR, reversal logic, continuation entries.
6. Exits occur on SSL flip, baseline cross, or weakness
Disclaimer
This strategy is provided strictly for educational and informational purposes only. It does not guarantee any profit, nor does it protect against losses of any kind. Financial markets are inherently unpredictable, and any market movement can only be assumed or estimated with a probability that is never guaranteed and can often be no better than a 50/50 chance.
By using this strategy, you acknowledge that all trading decisions are made solely at your own risk. I am not liable for any profits, losses, or financial consequences incurred by anyone using or relying on this strategy. Always perform your own research, manage your risk responsibly, and consult with a qualified financial advisor before trading.

Dynamic SMA Trend System [Multi-Stage Risk Engine]Description:
This script implements a robust Trend Following strategy based on a multiple Simple Moving Average (SMA) crossover logic (25, 50, 100, 200). What sets this strategy apart is its advanced "4-Stage Risk Engine" and a smart "High-Water Mark" Re-Entry system, designed to protect profits during parabolic moves while filtering out chop during sideways markets.
How it works:
The strategy operates on three core pillars: Trend Identification, Dynamic Risk Management, and Momentum Re-Entry.
1. Entry Logic (Trend Identification) The script looks for crossovers at different trend stages to capture early reversals as well as established trends:
Short-Term: SMA 25 crosses over SMA 50.
Mid-Term: SMA 50 crosses over SMA 100.
Macro-Trend: SMA 100 crosses over SMA 200.
2. The 4-Stage Risk Engine (Dynamic Stop Loss) Instead of a static Stop Loss, this strategy uses a progressive system that adapts as the price increases:
Stage 1 (Protection): Starts with a fixed Stop Loss (default -10%) to give the trade room to breathe.
Stage 2 (Break-Even): Once the price rises by 12%, the Stop is moved to trailing mode (10% distance), effectively securing a near break-even state.
Stage 3 (Profit Locking): At 25% profit, the trailing stop tightens to 8% to lock in gains.
Stage 4 (Parabolic Mode): At 40% profit, the trailing stop tightens further to 5% to capture the peak of parabolic moves.
3. Dual Exit Mechanism The strategy exits a position if EITHER of the following happens:
Stop Loss Hit: Price falls below the dynamic red line (Risk Engine).
Dead Cross: The trend structure breaks (e.g., SMA 25 crosses under SMA 50), signaling a momentum loss even if the Stop Loss wasn't hit.
4. "High-Water Mark" Re-Entry To avoid "whipsaws" in choppy markets, the script does not re-enter immediately after a stop-out.
It marks the highest price of the previous trade (Green Dotted Line).
A Re-Entry only occurs if the price breaks above this previous high (showing renewed strength) AND the long-term trend is bullish (Price > SMA 200).
Visuals:
SMAs: 25 (Yellow), 50 (Orange), 100 (Blue), 200 (White).
Red Line: Visualizes the dynamic Stop Loss level.
Green Dots: Visualizes the target price needed for a valid re-entry.
Settings: All parameters (SMA lengths, Stop Loss percentages, Staging triggers) are fully customizable in the settings menu to fit different assets (Crypto, Stocks, Forex) and timeframes.

Trendshift [CHE] StrategyTrendshift Strategy — First-Shift Structural Regime Trading
Profitfactor 2,603
Summary
Trendshift Strategy implements a structural regime-shift trading model built around the earliest confirmed change in directional structure. It identifies major swing highs and lows, validates breakouts through optional ATR-based conviction, and reacts only to the first confirmed shift in each direction. After a regime reversal, the strategy constructs a premium and discount band between the breakout candle and the previous opposite swing. This band is used as contextual bias and may optionally inform stop placement and position sizing.
The strategy focuses on clear, interpretable structural events rather than continuous signal generation. By limiting entries to the first valid shift, it reduces false recycles and allows the structural state to stabilize before a new trade occurs. All signals operate on closed-bar logic, and the strategy avoids higher-timeframe calls to stabilize execution behavior.
Motivation: Why this design?
Many structure-based systems repeatedly trigger as price fluctuates around prior highs and lows. This often leads to multiple flips during volatile or choppy conditions. Trendshift Strategy addresses this problem by restricting execution to the first confirmed structural event in each direction. ATR-based filters help differentiate genuine structural breaks from noise, while the contextual band ensures that the breakout is meaningful in relation to recent volatility.
The design aims to represent a minimalistic structural trading framework focused on regime turns rather than continuous trend signaling. This reduces chart noise and clarifies where the market transitions from one regime to another.
What’s different vs. standard approaches?
Baseline reference
Typical swing-based structure indicators report every break above or below recent swing points.
Architecture differences
First-shift-only regime logic that blocks repeated signals until direction reverses
ATR-filtered validation to avoid weak or momentum-less breaks
Premium and discount bands derived from breakout structure
Optional band-driven stop placement
Optional band-dependent position-sizing factor
Regime timeout system to neutralize structure after extended inactivity
Persistent-state architecture to prevent re-triggering
Practical effect
Only the earliest actionable structure change is traded
Fewer but higher-quality signals
Premium/discount tint assists contextual evaluation
Stops and sizing can be aligned with structural context rather than arbitrary volatility measures
Improved chart interpretability due to reduced marker frequency
How it works (technical)
The algorithm evaluates symmetric swing points using a fixed bar window. When a swing forms, its value and bar index are stored as persistent state. A structural shift occurs when price closes beyond the most recent major swing on the opposite side. If ATR filtering is enabled, the breakout must exceed a volatility-scaled distance to prevent micro-breaks from firing.
Once a valid shift is confirmed, the regime is updated to bullish or bearish. The script records the breakout level, the opposite swing, and derives a band between them. This band is checked for minimum size relative to ATR to avoid unrealistic contexts.
The first shift in a new direction generates both the strategy entry and a visual marker. Additional shifts in the same direction are suppressed until a reversal occurs. If a timeout is enabled, the regime resets after a specified number of bars without structural change, optionally clearing the band.
Stop placement, if enabled, uses either the opposite or same band edge depending on configuration. Position size is computed from account percentage and may optionally scale with the price-span-to-ATR relationship.
Parameter Guide
Market Structure
Swing length (default 5): Controls swing sensitivity. Lower values increase responsiveness.
Use ATR filter (default true): Requires breakouts to show momentum relative to ATR. Reduces false shifts.
ATR length (default 14): Volatility estimation for breakout and band validation.
Break ATR multiplier (default 1.0): Required breakout strength relative to ATR.
Premium/Discount Framework
Enable framework (default true): Activates premium/discount evaluation.
Persist band on timeout (default true): Keeps structural band after timeout.
Min band ATR mult (default 0.5): Rejects narrow bands.
Regime timeout bars (default 500): Neutralizes regime after inactivity.
Invert colors (default false): Color scheme toggle.
Visuals
Show zone tint (default true): Background shade in premium or discount region.
Show shift markers (default true): Display first-shift markers.
Execution and Risk
Risk per trade percent (default 1.0): Determines position size as account percentage.
Use band for size (default false): Scales size relative to band width behavior.
Flat on opposite shift (default true): Forces reversal behavior.
Use stop at band (default false): Stop anchored to band edges.
Stop band side: Chooses which band edge is used for stop generation.
Reading & Interpretation
A green background indicates discount conditions within the structural band; red indicates premium conditions. A green triangle below price marks the first bullish structural shift after a bearish regime. A red triangle above price marks the first bearish structural shift after a bullish regime.
When stops are active, the opposite band edge typically defines the protective level. Band width relative to ATR indicates how significant a structural change is: wider bands imply stronger volatility structure, while narrow bands may be suppressed by the minimum-size filter.
Practical Workflows & Combinations
Trend following: Use first-shift entries as initial regime confirmation. Add higher-timeframe trend filters for additional context.
Swing trading: Combine with simple liquidity or fair-value-gap concepts to refine entries.
Bias mapping: Use higher timeframes for structural regime and lower timeframes for execution within the premium/discount context.
Exit management: When using stops, consider ATR-scaling or multi-stage profit targets. When not using stops, reversals become the primary exit.
Behavior, Constraints & Performance
The strategy uses only confirmed swings and closed-bar logic, avoiding intrabar repaint. Pivot-based swings inherently appear after the pivot window completes, which is standard behavior. No higher-timeframe calls are used, preventing HTF-related repaint issues.
Persistent variables track regime and structural levels, minimizing recomputation. The maximum bars back setting is five-thousand. The design avoids loops and arrays, keeping performance stable.
Known limitations include limited signal density during consolidations, delayed swing confirmation, and sensitivity to extreme gaps that stretch band logic. ATR filtering mitigates some of these effects but does not eliminate them entirely.
Sensible Defaults & Quick Tuning
Fewer but stronger entries: Increase swing length or ATR breakout multiplier.
More responsive entries: Reduce swing length to capture earlier shifts.
More active band behavior: Lower the minimum band ATR threshold.
Stricter stop logic: Use the opposite band edge for stop placement.
Volatile markets: Increase ATR length slightly to stabilize behavior.
What this indicator is—and isn’t
Trendshift Strategy is a structural-regime trading engine that evaluates major directional shifts. It is not a complete trading system and does not include take-profit logic or prediction features. It does not attempt to forecast future price movement and should be used alongside broader market structure, volatility context, and disciplined risk management.
Disclaimer
The content provided, including all code and materials, is strictly for educational and informational purposes only. It is not intended as, and should not be interpreted as, financial advice, a recommendation to buy or sell any financial instrument, or an offer of any financial product or service. All strategies, tools, and examples discussed are provided for illustrative purposes to demonstrate coding techniques and the functionality of Pine Script within a trading context.
Any results from strategies or tools provided are hypothetical, and past performance is not indicative of future results. Trading and investing involve high risk, including the potential loss of principal, and may not be suitable for all individuals. Before making any trading decisions, please consult with a qualified financial professional to understand the risks involved.
By using this script, you acknowledge and agree that any trading decisions are made solely at your discretion and risk.
Do not use this indicator on Heikin-Ashi, Renko, Kagi, Point-and-Figure, or Range charts, as these chart types can produce unrealistic results for signal markers and alerts.
Best regards and happy trading
Chervolino

KAMA Flip strategyI built this strategy because I wanted something that doesn’t overcomplicate trading.
No 20 indicators, no guessing, no “maybe I should close here.”
Just a clear momentum flip, a defined stop, and a defined take profit. (for me on 1D BTC chart it works best with 6% stoploss and 3% takeprofit, lookback should be 40, everything else standard)
The idea is simple: when momentum shifts, I want to be on the right side of it.
KAMA is good for this because it speeds up when the market moves and slows down when it doesn’t.
I normalize it so it becomes a clean zero-line oscillator.
Above zero means momentum is turning up. Below zero means it’s turning down.
That’s the entire entry logic. A flip is a flip.
The exit logic is just as simple: one stop loss, one take profit, both fixed percentages from the entry.
The position closes 100% at the target or the stop. No scaling in, no scaling out, no trailing.
It’s straightforward and easy to analyze because every trade has the exact same structure.
I originally made this for BTC on the daily chart, but nothing stops you from trying it on other charts.
If you want it only to go long, only to go short, or take both sides, you can set that.
All the KAMA parameters are open so you can play with how reactive the signal is.
The visuals and SL/TP lines can be turned on or off depending on how clean you want your chart.
This isn’t financial advice. It’s just a system I like because it’s simple, objective, and does exactly what it’s supposed to do.
Test it, adjust it, break it, rebuild it — do whatever fits your own approach.

Double MOST with Pivot and EMAMOST Long Strategy with Multi-Filter Confirmation (Pivot + VAR Trend Filter)
This strategy combines a custom MOST stop-line structure with a moving average trend filter (EMA / VAR / ZLMA), daily pivot levels, and a 9-period VAR filter to generate clean long-only entries.
It aims to capture early trend continuations while avoiding reversals and false breakouts.
✔ Buy Conditions
A long position is opened only if all of the conditions below occur simultaneously:
MA (ort) > MOST Line (s2)
– Confirms that momentum is on the long side.
Price > Daily Pivot (pvt_gun)
– Ensures the market is trading above the day’s fair-value level.
Price > VAR(9)
– Short-term VAR filter to confirm trend strength and reduce noise.
Only the first bar where all conditions turn true generates a position.
✔ Sell Condition
A long position is closed when:
MOST Line (s2) crosses above MA (ort)
– Indicates a momentum shift against the long position.
✔ Execution Style (MetaStock-like)
Strategy operates long-only
Orders are filled on the next bar open, not on the signal bar
Commission: 0.03% (3 bps / on-binde 3)
Position size: 100% of equity per trade
This makes the behavior comparable to classical MetaStock backtesting logic.
✔ Chart Markers
Only actual trade entries and exits are drawn
No repeated signals or overlapping markers
Clean visual trade history
Purpose
This strategy is ideal for traders who want:
A structured long-only trend model
A multi-layer confirmation filter
Clean execution without repaint
High-quality entries above market structure levels

DTR V 1.0DTR V 1.0 is a momentum-based reversal strategy that combines the Stochastic Oscillator and the Relative Strength Index (RSI) to identify potential turning points in the market. It uses dual confirmation to filter out weak signals and focus on moments when price is genuinely stretched.
The strategy calculates Stochastic and RSI using user-defined lengths (default 14). A long entry occurs when both indicators show oversold conditions: Stochastic falls below the Oversold Level (default 20) and RSI drops below the RSI Oversold Level (default 30). This suggests weakening downward momentum and a possible reversal.
A long position is closed when both indicators reach overbought conditions: Stochastic rises above the Overbought Level (default 80) and RSI moves above the RSI Overbought Level (default 70). This helps capture the rebound move without staying in during momentum exhaustion.
DTR V 1.0 works best in range-bound markets, where oscillators frequently move between extremes, and it can also be effective for catching pullbacks within uptrends. It is generally suited for intraday to swing-trading timeframes. Like most oscillator-based systems, it may struggle during strong trending or high-volatility conditions where overbought or oversold readings can persist.
All thresholds and indicator lengths are adjustable, allowing traders to tune the strategy to different assets and market environments.

Trend Breakout & Ratchet Stop System [Market Filter]Description:
This strategy implements a robust trend-following system designed to capture momentum moves while strictly managing downside risk through a multi-stage "Ratchet" exit mechanism and broad market filters.
It is designed for swing traders who want to align individual stock entries with the overall market direction.
How it works:
1. Market Regime Filters (The "Safety Check") Before taking any position, the strategy checks the health of the broader market to avoid "catching falling knives."
Broad Market Filter: By default, it checks NASDAQ:QQQ (adjustable). If the benchmark is trading below its SMA 200, the strategy assumes a Bear Market and suppresses all new long entries.
Volatility Filter (VIX): Uses CBOE:VIX to gauge fear. If the VIX is above a specific threshold (Default: 32), entries are paused, and existing positions can optionally be closed to preserve capital.
2. Entry Logic Entries are based on Momentum and Trend confirmation. A position is opened if filters are clear AND one of the following occurs:
Golden Cross: SMA 25 crosses over SMA 50.
SMA Breakouts: A "Three-Bar-Break" logic confirms a breakout above the SMA 50, 100, or 200 (price must establish itself above the moving average).
3. The "Ratchet" Exit System The exit logic evolves as the trade progresses, tightening risk like a ratchet:
Stage 0 (Initial Risk): Starts with a standard percentage Stop Loss from the entry price.
Stage 1 (Breakeven/Lock): Once the price rises by Profit Step 1 (e.g., +10%), the Stop Loss jumps to a tighter level and locks there. This secures the initial move.
Stage 2 (Trailing Mode): If the price continues to rise to Profit Step 2 (e.g., +15%), the Stop Loss converts into a dynamic Trailing Stop relative to the Highest High. This allows the trade to run as long as the trend persists.
Additional Exits:
Dead Cross: Closes position if SMA 25 crosses under SMA 50.
VIX Panic: Emergency exit if volatility spikes above the threshold.
Settings & Customization:
SMAs: Adjustable lengths for all Moving Averages.
Filters: Toggle Market/VIX filters on/off and choose your benchmark ticker (e.g., SPY or QQQ).
Risk Management: Fully customizable percentages for the Ratchet steps (Initial SL, Stage 1 Trigger, Trailing distance).

Dynamic Ratchet Trend Strategy [VIX Filter]Overview This strategy is a long-only trend-following system designed to capture major market moves while strictly managing downside risk through a state-machine based "Ratchet" exit logic. It incorporates a volatility filter using the CBOE VIX index to stay out of (or exit) the market during high-stress environments.
Key Features
1. Multi-Condition Entries The strategy looks for momentum shifts and trend breakouts using four Simple Moving Averages (25, 50, 100, 200).
Momentum Cross: SMA 25 crossover above SMA 50.
Trend Breakouts: A specific "3-Bar Breakout" logic above the SMA 50, 100, or 200. This requires the price to hold above the SMA for 3 consecutive bars after being below it, reducing false signals compared to simple closes.
2. VIX Volatility Filter Before entering any trade, the script checks the CBOE:VIX.
Filter: If VIX is above the threshold (default 32), new entries are blocked.
Panic Exit: If you are in a position and the VIX spikes above the threshold, the strategy executes an immediate "Panic Exit" to preserve capital during market crashes.
3. The "Ratchet" Exit System (3 Stages) Unlike a standard trailing stop, this strategy uses a 3-stage dynamic exit mechanism that tightens as profits grow:
Stage 0 (Initial Risk): Standard percentage-based Stop Loss from the entry price.
Stage 1 (The Lock-In): Triggered when profit hits 10% (configurable).
Unique Logic: Instead of trailing from the highest high, the stop is calculated based on the price at the exact moment this stage was triggered. It "steps up" once and holds, securing the initial move without being prematurely stopped out by normal volatility.
Stage 2 (Trailing Mode): Triggered when profit hits 15% (configurable).
The strategy switches to a classic Trailing Stop, following the percentage distance from the Highest High.
4. Emergency Backup A "Dead Cross" (SMA 25 crossing under SMA 50) acts as a final fail-safe to close positions if the trend reverses completely before hitting a stop.
Settings & Inputs
SMAs: Customize the lengths for all four moving averages.
VIX Filter: Toggle the filter on/off and set the panic threshold.
Exit Logic: Fully customizable percentages for Initial SL, Stage 1 Trigger/Distance, and Stage 2 Trigger/Trailing Distance.
Disclaimer This script is for educational purposes only. Past performance is not indicative of future results. Always manage your risk appropriately.

Best Entry Swing MASTER v3 PUBLIC (S.S)Strategy Description (English)
Best Entry Swing MASTER v3 – Quality Mode
The Best Entry Swing MASTER v3 is a structured swing trading and trend-following strategy designed to identify high-probability long and short entries during directional markets.
It combines three core setup types commonly used by momentum and breakout traders:
Breakout (BO)
Pullback Reversal (PB)
Volatility Contraction Pattern (VCP)
The strategy applies multiple layers of confirmation, including multi-EMA trend structure, volatility contraction, volume filters, and an optional market regime filter.
It is suitable for swing trading on higher timeframes (4H, Daily), as well as medium-term trend continuation setups.
Core Concepts
1. Trend Structure
A trend is considered valid when:
Uptrend: Price > EMA20 > EMA50 > EMA100
Downtrend: Price < EMA20 < EMA50 < EMA100
In addition, a simple but effective trend-strength metric is calculated using the percentage spread between EMA20 and EMA100.
This helps avoid signals during sideways or low-volatility environments.
2. Market Regime Filter
The market environment is determined using a higher timeframe benchmark (default: SPY on Daily).
Only long trades are allowed in bullish market conditions
Only short trades in bearish conditions
This significantly reduces false signals in counter-trend conditions.
Entry Logic
Breakout (BO)
A long breakout triggers when:
Price closes above the highest high of the lookback period
Volume exceeds its 20-period average
Trend and market regime confirm
(Optional A+ mode): true volatility contraction is required
Similar logic applies for short breakdowns.
Pullback (PB)
A pullback entry triggers after:
At least two corrective candles
A strong reversal candle (close above previous high for long)
Volume confirmation
Price interacts with EMA20
This structure models classical trend-reentry conditions.
Volatility Contraction Pattern (VCP)
A VCP entry triggers when:
True range contracts over multiple bars
Price holds near the breakout zone
Volume contracts
Trend and market regime are aligned
This setup aims to capture explosive continuation moves.
Quality Modes
The strategy offers two modes:
Balanced Mode
Moderate signal frequency
Broader trend-strength allowance
Suitable for more active traders
A+ Only Mode
Strict confirmation requirements
Only high-quality setups with multiple confluences
Designed to avoid low-probability trades entirely
Risk Management
Risk is managed using an ATR-based stop and target:
Long SL = Close − ATR × 1.5
Long TP = Close + ATR × 3
(Equivalent logic for short positions)
This provides a balanced reward-to-risk profile and avoids overly tight stops.
Early Entry Signals (Optional)
The script offers optional “Early Entry” markers that highlight when a setup is forming but not yet confirmed.
These are not entry signals and are disabled by default for public use.
Intended Use
This strategy is designed for:
Swing trading
Momentum continuation
Trend-following
Multi-day to multi-week trades
It performs best on:
4H
Daily
High-liquidity equities, indices, and futures
Disclaimer
This script is intended for educational and research purposes.
Past performance does not guarantee future results.
Always backtest thoroughly and use appropriate risk management.

[iQ]PRO Quant GANN FOURIER VZO RANGE+🔮 PRO Quant GANN FOURIER VZO RANGE+
A Highly Adaptive and Proprietary Quantitative Strategy for Precision Market Analysis
This is the official description for the PRO Quant GANN FOURIER VZO RANGE+ strategy, a sophisticated, closed-source system engineered for high-level market engagement. This tool integrates multiple independent quantitative models into a single, cohesive Ensemble Signal, providing an edge through robust, multi-dimensional analysis.
🔬 Core Quantitative Architecture
The strategy is built on the convergence of several powerful, state-of-the-art analytical components, each designed to capture a distinct facet of market dynamics:
Proprietary Gann Swing Models: We utilize a dual-approach to Gann analysis.
Array–Based Gann Swing: A proprietary implementation leveraging advanced Pine Script array structures for dynamic tracking of significant price pivots and structure shifts. This component continuously monitors market momentum and potential areas of interest, including proprietary "ChoCh" (Change of Character) detection—a highly sensitive mechanism for identifying early trend inflection points. This core mechanism provides a high-frequency structural view of the market.
Composite Multi-Timeframe Gann Swing: This model synthesizes traditional swing analysis across two distinct timeframes to filter noise and confirm structural trends, ensuring the system operates with conviction against the backdrop of a higher-level market perspective.
VZO/VSA (Volume Zone Oscillator/Volume Spread Analysis) Hybrid: This module is engineered to analyze the crucial relationship between price momentum and volume flow, specifically using a Volume Zone Oscillator (VZO) approach integrated with Volume Spread Analysis (VSA) principles. It is designed to identify underlying accumulation and distribution activity with a unique dual-timeframe composite for enhanced signal quality.
Trend and Statistical Component: A dedicated module assesses the statistical bias and slope of the aggregated market movement, providing a crucial check against overextension and ensuring alignment with the underlying price regression trajectory.
⚖️ The Ensemble Signal and Trade Logic
All independent signals—Gann Array, Composite Gann, VZO/VSA, and Trend—are processed through a Weighted Ensemble Logic.
Weighted Voting: Each component's signal is assigned a customizable weight (input parameters wGannComp, wVZO, etc.) to reflect its relative importance in the current market environment.
Threshold-Based Decision: The weighted average of all signals results in an Ensemble Signal. Only when this signal decisively exceeds a customizable Signal Threshold does the system generate a Final Signal for trade execution. This rigor is key to filtering lower-conviction setups.
The strategy's execution logic is designed to open and close positions dynamically based on the Final Signal, maintaining maximum control with a default position size of 15% of equity per trade. A dedicated toggle allows for aggressive position management to "stay in" trades longer under specific conditions identified by the proprietary swing models.
⚙️ Strategic Advantages and Exclusivity
This strategy is marked by its extreme adaptability, incorporating features such as:
Higher Timeframe Synthesis: Crucial components utilize multi-timeframe confirmation to validate signals.
Price Smoothing: An optional, light-touch EMA smoothing is applied to the input price data to enhance signal clarity and reduce spurious whipsaws.
Due to the proprietary nature and complexity of the underlying swing detection algorithms and array management, the source code is kept strictly closed-source. This ensures the continued analytical edge and integrity of the model for our exclusive community.
OG INDICATOR TO MESS AROUND WITH, USE RIGHT, AND ENJOY. PRO STRATS COMING TOO
NFA.
MKNiQ
