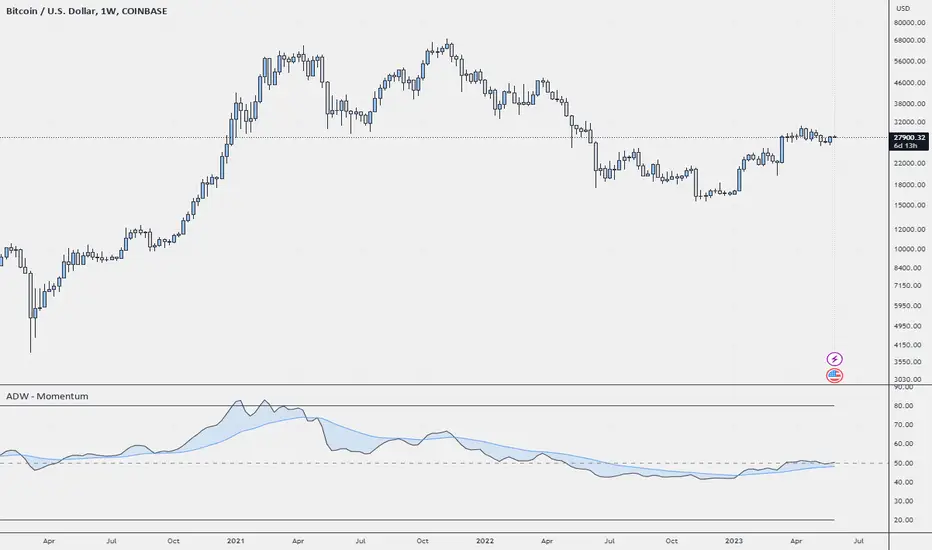
ADW - MomentumADW - Momentum is a trading indicator based on the Relative Momentum Index (RMI) and Exponential Moving Averages (EMAs). This indicator plots the RMI along with its EMAs and highlights regions where RMI crosses its slow EMA. Additionally, it provides alerts when the momentum flips bullish or bearish.
Key Features:
The RMI helps to identify momentum in the market.
Three EMAs (Fast, Standard, and Slow) were calculated on the RMI. These can be utilized to analyze the momentum trend over different periods.
Highlighted regions and colour coding to indicate when RMI crosses its Slow EMA, signalling potential momentum shifts.
Customizable parameters: Users can specify the lengths of the RMI and EMAs, boundaries for RMI, and colours for various components of the plot.
Alerts: The script can alert users when the momentum has flipped bullish or bearish.
The script is organized into several sections:
Inputs: The user can customize several parameters including the RMI averaging length, momentum lookback, RMI boundaries, and the EMA lengths. In addition, users can also specify the colours for the RMI line, Slow EMA line, and the fill colour.
RMI Calculation: The script calculates the RMI based on the user-provided length and momentum lookback. This is done by first calculating two EMAs - one for the positive differences between closing prices (emaInc), and one for the negative differences (emaDec). Then, the RMI is computed using these EMAs.
Plotting: The script plots the RMI line, Slow EMA line, and two horizontal lines indicating the RMI boundaries. In addition, it also fills the region between the RMI and Slow EMA lines.
Conditions: The script computes the conditions for bullish and bearish momentum flips. These are defined as when the RMI crosses above or below the Slow EMA respectively.
Alerts: Finally, the script sets up two alert conditions based on the bullish and bearish conditions. These alert the user when the momentum has flipped bullish or bearish, with a message that includes the current RMI value.
Cari dalam skrip untuk "momentum"
Momentum Ratio Oscillator [Loxx]What is Momentum Ratio Oscillator?
The theory behind this indicator involves utilizing a sequence of exponential moving average (EMA) calculations to achieve a smoother value of momentum ratio, which compares the current value to the previous one. Although this results in an outcome similar to that of some pre-existing indicators (such as volume zone or price zone oscillators), the use of EMA for smoothing is what sets it apart. EMA produces a smooth step-like output when values undergo sudden changes, whereas the mathematics used for those other indicators are completely distinct. This is a concept by the beloved Mladen of FX forums.
To utilize this version of the indicator, you have the option of using either levels, middle, or signal crosses for signals. The indicator is range bound from 0 to 1.
What is an EMA?
EMA stands for Exponential Moving Average, which is a type of moving average that is commonly used in technical analysis to smooth out price data and identify trends.
In a simple moving average (SMA), each data point is given equal weight when calculating the average. For example, if you are calculating the 10-day SMA, you would add up the prices for the past 10 days and divide by 10 to get the average. In contrast, in an EMA, more weight is given to recent prices, while older prices are given less weight.
The formula for calculating an EMA involves using a smoothing factor that is multiplied by the difference between the current price and the previous EMA value, and then adding this to the previous EMA value. The smoothing factor is typically calculated based on the length of the EMA being used. For example, a 10-day EMA might use a smoothing factor of 2/(10+1) or 0.1818.
The result of using an EMA is that the line produced is more responsive to recent price changes than a simple moving average. This makes it useful for identifying short-term trends and potential trend reversals. However, it can also be more volatile and prone to whipsaws, so it is often used in combination with other indicators to confirm signals.
Overall, the EMA is a widely used and versatile tool in technical analysis, and its effectiveness depends on the specific context in which it is applied.
What is Momentum?
In technical analysis, momentum refers to the rate of change of an asset's price over a certain period of time. It is often used to identify trends and potential trend reversals in financial markets.
Momentum is calculated by subtracting the closing price of an asset X days ago from its current closing price, where X is the number of days being used for the calculation. The result is the momentum value for that particular day. A positive momentum value suggests that prices are increasing, while a negative value indicates that prices are decreasing.
Traders use momentum in a variety of ways. One common approach is to look for divergences between the momentum indicator and the price of the asset being traded. For example, if an asset's price is trending upwards but its momentum is trending downwards, this could be a sign of a potential trend reversal.
Another popular strategy is to use momentum to identify overbought and oversold conditions in the market. When an asset's price has been rising rapidly and its momentum is high, it may be considered overbought and due for a correction. Conversely, when an asset's price has been falling rapidly and its momentum is low, it may be considered oversold and due for a bounce back up.
Momentum is also often used in conjunction with other technical indicators, such as moving averages or Bollinger Bands, to confirm signals and improve the accuracy of trading decisions.
Overall, momentum is a useful tool for traders and investors to analyze price movements and identify potential trading opportunities. However, like all technical indicators, it should be used in conjunction with other forms of analysis and with consideration of the broader market context.
Extras
Alerts
Signals
Loxx's Expanded Source Types, see here for details

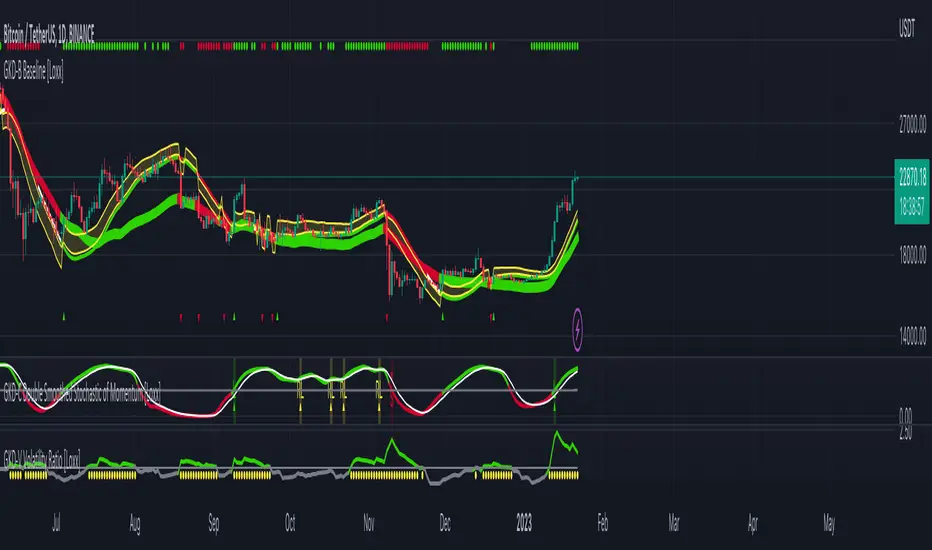
GKD-C Double Smoothed Stochastic of Momentum [Loxx]Giga Kaleidoscope Double Smoothed Stochastic of Momentum Confirmation is a Confirmation module included in Loxx's "Giga Kaleidoscope Modularized Trading System".
What is Loxx's "Giga Kaleidoscope Modularized Trading System"?
The Giga Kaleidoscope Modularized Trading System is a trading system built on the philosophy of the NNFX (No Nonsense Forex) algorithmic trading.
What is an NNFX algorithmic trading strategy?
The NNFX algorithm is built on the principles of trend, momentum, and volatility. There are six core components in the NNFX trading algorithm:
1. Volatility - price volatility; e.g., Average True Range, True Range Double, Close-to-Close, etc.
2. Baseline - a moving average to identify price trend (such as "Baseline" shown on the chart above)
3. Confirmation 1 - a technical indicator used to identify trends. This should agree with the "Baseline"
4. Confirmation 2 - a technical indicator used to identify trends. This filters/verifies the trend identified by "Baseline" and "Confirmation 1"
5. Volatility/Volume - a technical indicator used to identify volatility/volume breakouts/breakdown.
6. Exit - a technical indicator used to determine when a trend is exhausted.
How does Loxx's GKD (Giga Kaleidoscope Modularized Trading System) implement the NNFX algorithm outlined above?
Loxx's GKD v1.0 system has five types of modules (indicators/strategies). These modules are:
1. GKD-BT - Backtesting module (Volatility, Number 1 in the NNFX algorithm)
2. GKD-B - Baseline module (Baseline and Volatility/Volume, Numbers 1 and 2 in the NNFX algorithm)
3. GKD-C - Confirmation 1/2 module (Confirmation 1/2, Numbers 3 and 4 in the NNFX algorithm)
4. GKD-V - Volatility/Volume module (Confirmation 1/2, Number 5 in the NNFX algorithm)
5. GKD-E - Exit module (Exit, Number 6 in the NNFX algorithm)
(additional module types will added in future releases)
Each module interacts with every module by passing data between modules. Data is passed between each module as described below:
GKD-B => GKD-V => GKD-C(1) => GKD-C(2) => GKD-E => GKD-BT
That is, the Baseline indicator passes its data to Volatility/Volume. The Volatility/Volume indicator passes its values to the Confirmation 1 indicator. The Confirmation 1 indicator passes its values to the Confirmation 2 indicator. The Confirmation 2 indicator passes its values to the Exit indicator, and finally, the Exit indicator passes its values to the Backtest strategy.
This chaining of indicators requires that each module conform to Loxx's GKD protocol, therefore allowing for the testing of every possible combination of technical indicators that make up the six components of the NNFX algorithm.
What does the application of the GKD trading system look like?
Example trading system:
Backtest: Strategy with 1-3 take profits, trailing stop loss, multiple types of PnL volatility, and 2 backtesting styles
Baseline: Leader Exponential Moving Average as shown on chart
Volatility/Volume: Volatility Ratio as shown on chart
Confirmation 1: Double Smoothed Stochastic of Momentum as shown on the chart above
Confirmation 2: Jurik Turning Point Oscillator
Exit: Rex Oscillator
Each GKD indicator is denoted with a module identifier of either: GKD-BT, GKD-B, GKD-C, GKD-V, or GKD-E. This allows traders to understand to which module each indicator belongs and where each indicator fits into the GKD protocol chain.
Now that you have a general understanding of the NNFX algorithm and the GKD trading system. Let's go over what's inside the GKD-E Double Smoothed Stochastic of Momentum itself.
What is Double Smoothed Stochastic of Momentum?
The Double Smoothed Stochastic of Momentum demonstrates smoother indicators and therefore gives fewer false signals in comparison with the traditional oscillator.
The indicator is written in accordance with the description given in the book by Joe Dinapoli "Trading With DiNapoli Levels". This oscillator smoothing method leads to a filtering of the most "noise" component of the price movement.
The Double Smoothed Stochastic of Momentum indicator can be used in the strategies oriented to a standard stochastic. However, the stronger smoothing can lead to the loss of an array of signals. It is recommended to apply any trend indicator for more efficient use of the indicator and its signals filtering.
Signals
A GKD-C Confirmation indicator can be used as either a Confirmation 1, Confirmation 2, or Solo Confirmation indicator. See step 3 & 4 of the NNFX algorithm above to understand how this indicator fits into the GKD trading system. The Solo Confirmation setting allows you to test this indicator by itself without an additional GKD-C indicator present in the GKD protocol chain.
On the chart shown above, this indicator is shown as GKD-C Double Smoothed Stochastic of Momentum and is set to Solo Confirmation. The GKD-B Baseline, GKD-V Volatility Ratio, and this indicator satisfy the first three steps in the GKD trading system chain: GKD-B => GKD-V => GKD-C(solo).
The signals from each of these settings are as follows:
Confirmation 1 Signal
Initial Long (L): Double Smoothed Stochastic of Momentum crosses-up over middle-line*
Initial Short (S): Double Smoothed Stochastic of Momentum crosses-down under middle-line*
Continuation Long (CL): Double Smoothed Stochastic of Momentum is over middle-line, then crosses-up over the signal**
Continuation Short (CS): Double Smoothed Stochastic of Momentum is under middle-line, then crosses-down under the signal**
Post Baseline Cross Long (BL): Double Smoothed Stochastic of Momentum crossed-up over middle-line but Baseline is still in downtrend, then Baseline turns to uptrend within XX bars***
Post Baseline Cross Short (BS): Double Smoothed Stochastic of Momentum crossed-down under middle-line but Baseline is still in uptrend, then Baseline turns to downtrend within XX bars***
BL Recovery Continuation Long (RL): Double Smoothed Stochastic of Momentum is above middle-line. Baseline already crossed down into downtrend, then baseline crosses back up to uptrend; then, Double Smoothed Stochastic of Momentum crosses-up over the signal****
BL Recovery Continuation Short (RS): Double Smoothed Stochastic of Momentum is below middle-line. Baseline already crossed up into uptrend, then baseline crosses back down to downtrend; then, Double Smoothed Stochastic of Momentum crosses-down under the signal****
*All signals are shown regardless of Baseline and Volatility/Volume qualification
**All signals are shown regardless of Baseline qualification; however, when Baseline filter is active, only true continuations are shown. When the Baseline filter is not active, then all continuations are shown. True continuations are when the Baseline is active and maintains its uptrend/downtrend after the initial cross-up/cross-down over the middle-line respectively. This means that if the Baseline trend then moves against the Double Smoothed Stochastic of Momentum then any continuation signals are voided until another initial Long/Short. All continuations are will either show as regular continuations or be converted into recovery continuations
***All signals are shown regardless of Volatility/Volume qualification
****When the Baseline filter is active, some regular continuations are converted to recovery continuations and are shown. When the Baseline filter is not active, then these signals are not shown.
Confirmation 2 Signal
Initial Long (L): Double Smoothed Stochastic of Momentum crosses-up over middle-line*
Initial Short (S): Double Smoothed Stochastic of Momentum crosses-down under middle-line*
Continuation Long (CL): Double Smoothed Stochastic of Momentum is over middle-line, then crosses-up over the signal**
Continuation Short (CS): Double Smoothed Stochastic of Momentum is under middle-line, then crosses-down under the signal**
Post Baseline Cross Long (BL): Double Smoothed Stochastic of Momentum crossed-up over middle-line but Baseline is still in downtrend, then Baseline turns to uptrend within XX bars***
Post Baseline Cross Short (BS): Double Smoothed Stochastic of Momentum crossed-down under middle-line but Baseline is still in uptrend, then Baseline turns to downtrend within XX bars***
BL Recovery Continuation Long (RL): Double Smoothed Stochastic of Momentum is above middle-line. Baseline already crossed down into downtrend, then baseline crosses back up to uptrend while Double Smoothed Stochastic of Momentum is still above middle-line; then, Double Smoothed Stochastic of Momentum crosses-up over the signal****
BL Recovery Continuation Short (RS): Double Smoothed Stochastic of Momentum is below middle-line. Baseline already crossed up into uptrend, then baseline crosses back down to downtrend while Double Smoothed Stochastic of Momentum is still below middle-line; then, Double Smoothed Stochastic of Momentum crosses-down under the signal****
*All signals are shown regardless of Baseline and Volatility/Volume qualification
**All signals are shown regardless of Baseline qualification; however, when Baseline filter is active, only true continuations are shown. When the Baseline filter is not active, then all continuations are shown. True continuations are when the Baseline is active and maintains its uptrend/downtrend after the initial cross-up/cross-down over the middle-line respectively. This means that if the Baseline trend then moves against the Double Smoothed Stochastic of Momentum then any continuation signals are voided until another initial Long/Short. All continuations are will either show as regular continuations or be converted into recovery continuations
***All signals are shown regardless of Volatility/Volume qualification
****When the Baseline filter is active, some regular continuations are converted to recovery continuations and are shown. When the Baseline filter is not active, then these signals are not shown.
Confirmation 2 Confluence Background Color Signals; Confirmation Order: Regular; Confirmation Type: Confirmation 1
Initial Long (L): The imported GKD-C Confirmation 1 indicator crosses-up over middle-line, then Double Smoothed Stochastic of Momentum crosses-up over the middle-line on the same bar or "Number of Bars Confirmation" bars in the future (see X-bar rule below)
Initial Short (S): The imported GKD-C Confirmation 1 indicator crosses-down under middle-line, then Double Smoothed Stochastic of Momentum crosses-down under the middle-line on the same bar or "Number of Bars Confirmation" bars in the future (see X-bar rule below)
Continuation Long Confirmation 1 (CL): The imported GKD-C Confirmation 1 indicator is over middle-line, then crosses-up over the signal
Continuation Short Confirmation 1 (CS): The imported GKD-C Confirmation 1 indicator is under middle-line, then crosses-down under the signal
Post Baseline Cross Long (BL): The imported GKD-C Confirmation 1 crossed-up over middle-line but Baseline is still in downtrend; and Double Smoothed Stochastic of Momentum crossed-up over middle-line on the same bar or XX bars in the future but Baseline is still in downtrend; then Baseline turns to uptrend within "Maximum Allowable PSBC Bars Back" bars (see X-bar rule below)
Post Baseline Cross Short (BS): The imported GKD-C Confirmation 1 crossed-down under middle-line but Baseline is still in uptrend; and, Double Smoothed Stochastic of Momentum crossed-down under middle-line on the same bar or XX bars in the future but Baseline is still in uptrend; then Baseline turns to downtrend within "Maximum Allowable PSBC Bars Back" bars (see X-bar rule below)
BL Recovery Continuation Long (RL): The imported GKD-C Confirmation 1 indicator is above middle-line. Baseline already crossed down into downtrend, then baseline crosses back up to uptrend while Double Smoothed Stochastic of Momentum is still above middle-line; then, The imported GKD-C Confirmation 1 crosses-up over the signal
BL Recovery Continuation Short (RS): The imported GKD-C Confirmation 1 indicator is below middle-line. Baseline already crossed up into uptrend, then baseline crosses back down to downtrend while Double Smoothed Stochastic of Momentum is still below middle-line; then, The imported GKD-C Confirmation 1 crosses-down under the signal
Confirmation 2 Confluence Background Color Signals; Confirmation Order: Regular; Confirmation Type: Confirmation 2
Initial Long (L): same as Confirmation 2 Confluence Background Color Signals; Confirmation Order: Regular; Confirmation Type: Confirmation 1
Initial Short (S): same as Confirmation 2 Confluence Background Color Signals; Confirmation Order: Regular; Confirmation Type: Confirmation 1
Continuation Long Confirmation 2 (CL): Double Smoothed Stochastic of Momentum is over middle-line, then crosses-up over the signal
Continuation Short Confirmation 2 (CS): Double Smoothed Stochastic of Momentum is under middle-line, then crosses-down under the signal
Post Baseline Cross Long (BL): same as Confirmation 2 Confluence Background Color Signals; Confirmation Order: Regular; Confirmation Type: Confirmation 1
Post Baseline Cross Short (BS): same as Confirmation 2 Confluence Background Color Signals; Confirmation Order: Regular; Confirmation Type: Confirmation 1
BL Recovery Continuation Long (RL): Double Smoothed Stochastic of Momentum is above middle-line. Baseline already crossed down into downtrend, then baseline crosses back up to uptrend; then, Double Smoothed Stochastic of Momentum crosses-up over the signal
BL Recovery Continuation Short (RS): Double Smoothed Stochastic of Momentum is below middle-line. Baseline already crossed up into uptrend, then baseline crosses back down to downtrend; then, Double Smoothed Stochastic of Momentum crosses-down under the signal
Confirmation 2 Confluence Background Color Signals; Confirmation Order: Regular; Confirmation Type: Both
Initial Long (L): same as Confirmation 2 Confluence Background Color Signals; Confirmation Order: Regular; Confirmation Type: Confirmation 1
Initial Short (S): same as Confirmation 2 Confluence Background Color Signals; Confirmation Order: Regular; Confirmation Type: Confirmation 1
Continuation Long Confirmation 2 (CL): The imported GKD-C Confirmation 1 indicator is over middle-line, then crosses-up over the signal; Double Smoothed Stochastic of Momentum is over middle-line, then crosses-up over the signal within "Number of Bars Confirmation" bars in the future
Continuation Short Confirmation 2 (CS): The imported GKD-C Confirmation 1 indicator is under middle-line, then crosses-down under the signal; Double Smoothed Stochastic of Momentum is under middle-line, then crosses-down under the signal within "Number of Bars Confirmation" bars in the future
Post Baseline Cross Long (BL): same as Confirmation 2 Confluence Background Color Signals; Confirmation Order: Regular; Confirmation Type: Confirmation 1
Post Baseline Cross Short (BS): same as Confirmation 2 Confluence Background Color Signals; Confirmation Order: Regular; Confirmation Type: Confirmation 1
BL Recovery Continuation Long (RL): The imported GKD-C Confirmation 1 indicator is above middle-line and Double Smoothed Stochastic of Momentum is above middle-line. Baseline already crossed down into downtrend, then baseline crosses back up to uptrend; then, the imported GKD-C Confirmation 1 crosses-up over its signal, and Double Smoothed Stochastic of Momentum crosses-up over its signal within "Number of Bars Confirmation" bars in the future
BL Recovery Continuation Short (RS): The imported GKD-C Confirmation 1 indicator is below middle-line and Double Smoothed Stochastic of Momentum is below middle-line. Baseline already crossed up into uptrend, then baseline crosses back down to downtrend; then, the imported GKD-C Confirmation 1 crosses-down under its signal, and Double Smoothed Stochastic of Momentum crosses-down under its signal within "Number of Bars Confirmation" bars in the future
Confirmation 2 Confluence Background Color Signals; Confirmation Order: Both; Confirmation Type: (continuations don't change from the variations above)
Initial Long (L): The imported GKD-C Confirmation 1 indicator crosses-up over middle-line, then Double Smoothed Stochastic of Momentum crosses-up over the middle-line on the same bar or "Number of Bars Confirmation" bars in the future (see X-bar rule below); OR, Double Smoothed Stochastic of Momentum crosses-up over middle-line, then the imported GKD-C Confirmation 1 indicator crosses-up over the middle-line on the same bar or "Number of Bars Confirmation" bars in the future (see X-bar rule below)
Initial Short (S): The imported GKD-C Confirmation 1 indicator crosses-down under middle-line, then Double Smoothed Stochastic of Momentum crosses-down under the middle-line on the same bar or "Number of Bars Confirmation" bars in the future (see X-bar rule below); OR, Double Smoothed Stochastic of Momentum crosses-down under middle-line, then the imported GKD-C Confirmation 1 indicator crosses-down under the middle-line on the same bar or "Number of Bars Confirmation" bars in the future (see X-bar rule below)
Post Baseline Cross Long (BL): The imported GKD-C Confirmation 1 crossed-down under middle-line but Baseline is still in uptrend; and, Double Smoothed Stochastic of Momentum crossed-down under middle-line on the same bar or XX bars in the future but Baseline is still in uptrend; then Baseline turns to downtrend within "Maximum Allowable PSBC Bars Back" bars (see X-bar rule below); OR, Double Smoothed Stochastic of Momentum crossed-down under middle-line but Baseline is still in uptrend; and, the imported GKD-C Confirmation 1 crossed-down under middle-line on the same bar or XX bars in the future but Baseline is still in uptrend; then Baseline turns to downtrend within "Maximum Allowable PSBC Bars Back" bars (see X-bar rule below)
Post Baseline Cross Short (BS): The imported GKD-C Confirmation 1 crossed-down under middle-line but Baseline is still in uptrend; and, Double Smoothed Stochastic of Momentum crossed-down under middle-line on the same bar or XX bars in the future but Baseline is still in uptrend; then Baseline turns to downtrend within "Maximum Allowable PSBC Bars Back" bars (see X-bar rule below); OR, Double Smoothed Stochastic of Momentum crossed-down under middle-line but Baseline is still in uptrend; and, the imported GKD-C Confirmation 1 crossed-down under middle-line on the same bar or XX bars in the future but Baseline is still in uptrend; then Baseline turns to downtrend within "Maximum Allowable PSBC Bars Back" bars (see X-bar rule below)
Solo Confirmation Signals
Initial Long (L): Double Smoothed Stochastic of Momentum crosses-up over middle-line
Initial Short (S): Double Smoothed Stochastic of Momentum crosses-down under middle-line
Continuation Long (CL): Double Smoothed Stochastic of Momentum is over middle-line, then crosses-up over the signal
Continuation Short (CS): Double Smoothed Stochastic of Momentum is under middle-line, then crosses-down under the signal
Post Baseline Cross Long (BL): Double Smoothed Stochastic of Momentum crossed-up over middle-line but Baseline is still in downtrend, then Baseline turns to uptrend within XX bars
Post Baseline Cross Short (BS): Double Smoothed Stochastic of Momentum crossed-down under middle-line but Baseline is still in uptrend, then Baseline turns to downtrend within XX bars
BL Recovery Continuation Long (RL): Double Smoothed Stochastic of Momentum above middle-line. Baseline already crossed down into downtrend, then baseline crosses back up to uptrend while Double Smoothed Stochastic of Momentum is still above middle-line
BL Recovery Continuation Short (RS): Double Smoothed Stochastic of Momentum below middle-line. Baseline already crossed up into uptrend, then baseline crosses back down to downtrend while Double Smoothed Stochastic of Momentum is still below middle-line
X-bar Rule settings
This rule only applies when this indicator "Confirmation Type" set to "Confirmation 2"
Requirements
Inputs: Confirmation 1 and Solo Confirmation: GKD-V Volatility/Volume indicator; Confirmation 2: GKD-C Confirmation indicator
Output: Confirmation 2 and Solo Confirmation: GKD-E Exit indicator; Confirmation 1: GKD-C Confirmation indicator
Additional features will be added in future releases.
This indicator is only available to ALGX Trading VIP group members . You can see the Author's Instructions below to get more information on how to get access.
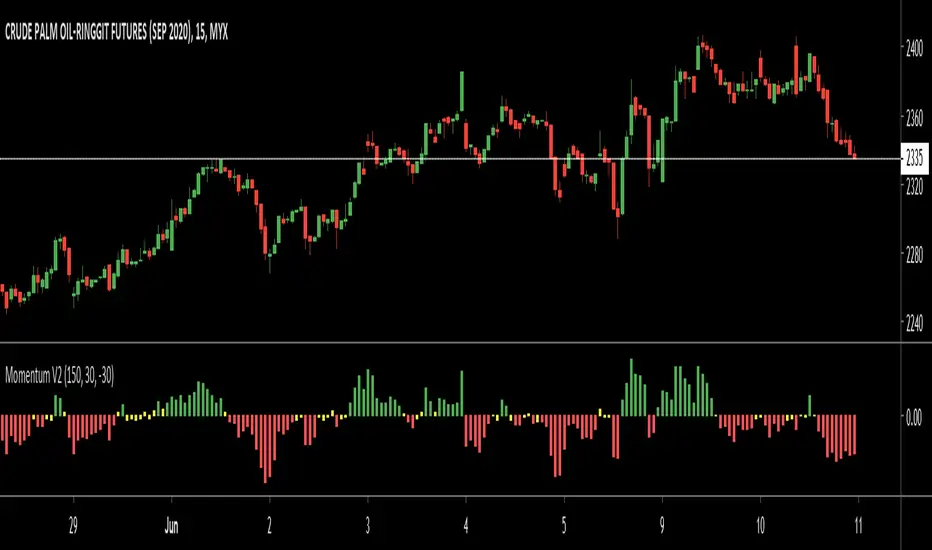
[AKM] MomentumThis indicator will indicate the movement of momentum, whether sell or buy zone.
Value above 0 indicate momentum is in Buy zone.
Value below 0 indicate momentum is in Sell zone.
Value between Low Momentum Upper and Low Momentum Bottom indicate momentum is low.
The green color indicates that the buy momentum exceeds the value set at Low Momentum Upper.
The red color indicates that the sell momentum exceeds the value set at Low Momentum Bottom.
The yellow color indicates the value of buy or sell is between Low Momentum Upper and Low Momentum Bottom.
Send us private message on TV to gain access to the indicator.
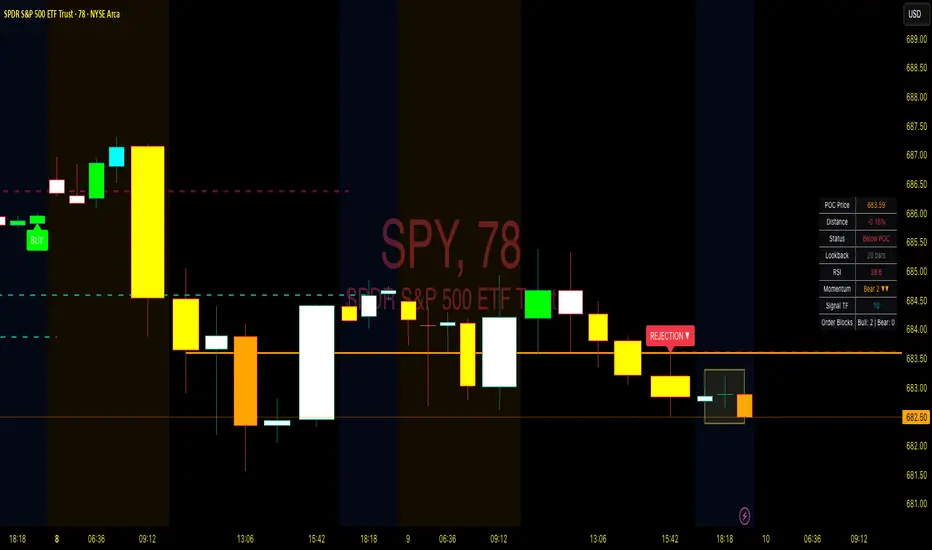
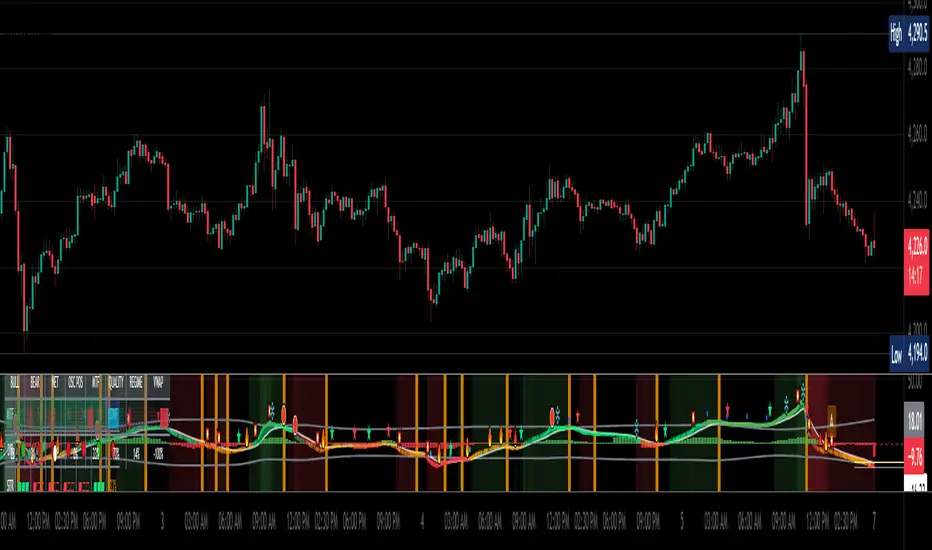
Point of Control + Momentum CandlesPOINT OF CONTROL + MOMENTUM CANDLES
A multi-feature indicator combining volume-based POC detection, 6-level momentum candle coloring, higher timeframe buy/sell signals, and order block identification.
FEATURES
Point of Control (POC)
Calculates the price level with highest traded volume over a customizable lookback period. Includes break and rejection detection with visual signals.
Momentum Candle Coloring
Colors candles based on EMA positioning and RSI values across 6 momentum levels:
- Bull 3/2/1: Strong to weak bullish momentum (Blue/Cyan/Green)
- Bear 1/2/3: Weak to strong bearish momentum (Yellow/Orange/Red)
- Neutral: No clear momentum (White)
Buy/Sell Signals
Generates signals from a user-selectable timeframe using EMA crossovers and RSI conditions. Signals appear on your current chart for multi-timeframe analysis.
Order Blocks
Detects potential institutional entry zones:
- Bullish OB: Last bearish candle before bullish impulse
- Bearish OB: Last bullish candle before bearish impulse
Blocks extend forward and optionally delete when mitigated.
Dashboard
Displays POC price, distance, RSI, momentum level, signal timeframe, and active order block count.
ALERTS
10 conditions available: POC breaks, rejections, buy/sell signals, and order block formations.
HOW TO USE
- Trade POC breaks for trend continuation
- Trade POC rejections for reversals
- Use candle colors to gauge momentum strength
- Confirm entries with higher timeframe signals
- Watch for price returning to order blocks
SETTINGS
All parameters are fully customizable including lookback periods, thresholds, timeframes, colors, and visual styles.
DISCLAIMER
For educational purposes only. Not financial advice. Trading involves risk. Always conduct your own analysis before making trading decisions.
BK AK-Momentum Pivot Wolf🐺⚔️ BK AK–Momentum Pivot Wolf — The Court of Price. ⚔️🐺
Not prophecy. Procedure. Not prediction. Judgment.
Most indicators sell you a feeling: “it’s going up.”
Pivot Wolf is built to do the opposite: make the market prove it—under rules.
Price lies. Not maliciously—mechanically.
It prints motion whether there’s intent behind it or not. That’s why traders get slaughtered: they treat movement like truth.
Pivot Wolf treats movement like a defendant.
⚖️ The Law of the Tool (What It Refuses to Do)
This script does not exist to “call tops and bottoms.”
It exists to remove the sin that ruins traders:
answering before hearing.
If you trade before testimony, you’re not trading—you’re volunteering.
So Pivot Wolf is designed to withhold permission until three things line up:
Pivots = Boundary Stones
Where price must answer. Where excuses die. Where decisions become visible.
Momentum = Witness
Not what price did—what it carried. Force behind the move, not the costume of the candle.
Acceleration = Confession
The moment intent leaks. The early tell that strength is arriving—or that strength is bleeding out.
You’re not hunting “signals.”
You’re watching a case get built.
🪨 Solomon’s Hidden Layer (Why This Is a Wisdom Tool)
Solomon’s world wasn’t obsessed with forecasting. It was obsessed with right judgment.
He didn’t ask, “What do I want to happen?”
He asked, “What’s true—and what is counterfeit?”
That’s why his writing keeps returning to the same themes:
Weights & measures (standardization over vibes)
Witnesses (confirmation over impulse)
Gates & boundaries (permissioned action over chaos)
Silence (restraint as intelligence)
Pivot Wolf is built in that spirit: it’s a weights-and-witness engine disguised as an indicator.
It’s trying to keep you from trading counterfeit strength at the edge of a boundary.
🐺 How to Use It Like You Actually Respect Capital
1) Campaign Mode (Trend):
Boundaries tell you where business is allowed. Momentum/acceleration tell you whether business is justified. You press when testimony is clean—not when price is exciting.
2) Verdict Mode (Turns):
Reversals aren’t vibes. They’re a collapse of testimony: momentum fails at the boundary, acceleration flips, and the move confesses exhaustion.
3) Stand-Down Mode (The Feature Tourists Hate):
When the script goes quiet, it’s not “missing trades.”
It’s telling you: the court is not in session.
That’s the part that keeps your P&L alive.
🏷️ BK / AK
BK is the mark I’m building.
AK is honor—my mentor’s standard: clarity, patience, no shortcuts.
Above that: gratitude to Gd, the true source of wisdom, restraint, and endurance.
📜 King Solomon Lens
“Solomon didn’t predict. He judged. He built tests that made truth show itself. Pivot Wolf is that: pivots as boundary stones, momentum as witness, acceleration as the confession. No hammer in the Temple — rules are cut before entry. When it’s quiet, it’s saving you. When it speaks, it’s a ruling.”
This is not financial advice. This is structure.
If you wanted a fortune teller, you’ll hate this script.
If you wanted a system that makes the market prove itself before you strike—welcome to the Wolf.
Multi-factor momentum & flow confluence oscillator
MarketExploiter
Momentum–flow confluence oscillator.
Overview
This indicator combines momentum structure, money-flow behavior, trend context, and divergence detection into a single visual tool. It helps highlight when momentum is strengthening, weakening, or beginning to shift direction.
Components
• A smoothed momentum curve that visualizes acceleration and exhaustion.
• Money-flow bias reflecting underlying buying or selling pressure.
• Momentum-shift dots that appear only when several factors align, such as momentum inflection, curve behavior, and supportive flow.
• Bullish and bearish divergence detection between price and the momentum curve.
• A trend panel offering broader directional context.
How to Use
Signals are most effective when they appear in the direction of the trend panel and when money-flow conditions support the move. Divergence signals may highlight early strength or weakness relative to price action. The indicator is intended for context and confirmation rather than standalone entries. Works across all liquid markets and timeframes.
Notes
Non-repainting. Suitable for momentum assessment, trend reading, and identifying potential inflection zones.

BVC - Momentum Dashboard ForecastBVC – Momentum Dashboard Forecast is an all-in-one indicator designed for the Casablanca Stock Exchange.
It merges trend, momentum, volatility and breakout signals to produce clear, non-repainting Buy/Sell triggers, strength scoring,
short-term forecasting and a complete visual dashboard.
Main Components
• MA20 / MA50 trend structure
• RSI(14) oversold/overbought exits
• Donchian breakouts (non-repainting using previous window)
• Optional volume confirmation
• Buy/Sell labels + strength score (0→5)
• Automatic trend-based background coloring
• Forecasting (J+1 … J+H) using linear regression + ±k·ATR
• Mini Dashboard + Forecast Table
Forecast Module
• Linear projection using slope of linreg
• ATR-based uncertainty envelope
• Projection labels (optional)
• Forecast table: Session, Projection, ATR band
Alerts
• Buy Signal
• Sell Signal
(Add alert on the indicator.)
Best Practices (BVC)
• Use daily for swing trades
• Weekly timeframe for structural trend
• Donchian 20–30 depending on volatility
• Activate volume filter for liquid stocks
• Combine with support/resistance and order book analysis

Relative Rotation - RRG JdK RS-Ratio & RS-MomentumThis indicator calculates the JdK RS-Ratio and RS-Momentum, which form the basis of Relative Rotation Graphs (RRG). It compares the performance of any asset against a benchmark (default: SPY) to identify the current RRG quadrant: LEADING, WEAKENING, LAGGING, or IMPROVING.
The RS-Ratio (red line) and RS-Momentum (green line) are plotted around a baseline of 100. The background color indicates the current quadrant, and an optional feature allows coloring chart candles based on the RRG phase.
Alerts can be configured to notify when the asset transitions between quadrants, helping traders identify rotational shifts in relative strength.

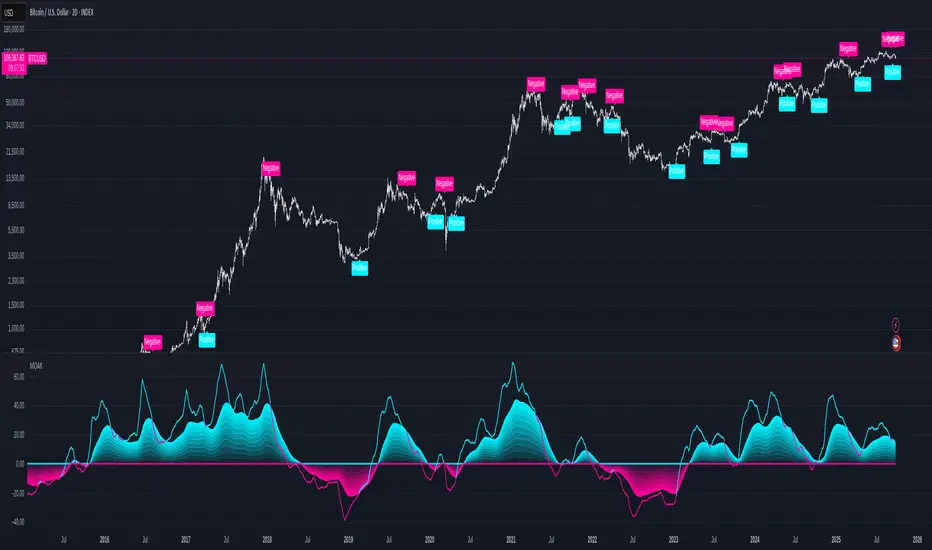
Multi-Oscillator Adaptive Kernel with MomentumMulti-Oscillator Adaptive Kernel w. Momentum
An adaptation of the indicator by AlphaAlgos : Multi-Oscillator-Adaptive-Kernel (MOAK) with Divergence . Please find the description of the indicator in the above link.
Apart from adding labels to show trend/momentum changes, the following changes have been made to the original script:
1. Sensitivity is used in the computation to scale the fast MOAK signal,
2. Selection between two indicator modes:
Trending - (the original script method) assesses whether smoothed MOAK is above/below 0 - for up/down trends respectively.
Momentum - assesses whether the fast MOAK signal is above/below the smoothed MOAK, and can be used to indicate potential trend reversals as momentum of current trend fades.
[ClearEdege] Momentum Suites V3 Advanced contrarian momentum analysis with intelligent pivot point integration for precision market timing. Developed for ClearEdge members
*This indicator is not publicly available.
Key Features
Smart Signal System
- Buy Low/Sell High Logic: Identifies oversold conditions for long entries and overbought conditions for short entries
- Multi-Timeframe Confirmation: Incorporates higher timeframe bias for enhanced signal reliability
- Momentum Convergence: Combines RSI, StochRSI, and Bollinger Bands for comprehensive market analysis
Dynamic Pivot Integration
- Classic Pivot Points: Auto-calculated daily/weekly/monthly support and resistance levels
- Pivot Confluence Detection: Signals gain strength when price approaches key pivot levels
- Smart Warning System: Single-alert approach prevents label spam while highlighting critical S/R interactions
Table Dashboard
- Compact Signal Table: Real-time buy/sell signal strength with scoring system
- Market Context: Momentum status, nearest pivot level, volume and trend analysis
- Clean Visual Design: Minimal interface focused on actionable information
Intelligent Alerts
- Approach Warnings: Alerts when price nears resistance with overbought momentum or support with oversold momentum
- Confluence Signals: High-probability setups combining momentum extremes with pivot level proximity
- Single-Shot Logic: Prevents alert fatigue with smart reset mechanisms
Best Use Cases
- Swing Trading: Ideal for identifying major reversal points at key levels
- Risk Management: Clear warning system for potential turning points
- Multi-Asset Analysis: Works across forex, crypto, stocks, and commodities
- All Timeframes: Scalable from 5-minute charts to daily analysis
Designed for traders who value precision over noise - combining classical pivot analysis with modern momentum indicators for superior market timing.

Institutional Momentum Scanner [IMS]Institutional Momentum Scanner - Professional Momentum Detection System
Hunt explosive price movements like the professionals. IMS identifies maximum momentum displacement within 10-bar windows, revealing where institutional money commits to directional moves.
KEY FEATURES:
▪ Scans for strongest momentum in rolling 10-bar windows (institutional accumulation period)
▪ Adaptive filtering reduces false signals using efficiency ratio technology
▪ Three clear states: LONG (green), SHORT (red), WAIT (gray)
▪ Dynamic volatility-adjusted thresholds (8% ATR-scaled)
▪ Visual momentum flow with glow effects for signal strength
BASED ON:
- Pocket Pivot concept (O'Neil/Morales) applied to price momentum
- Adaptive Moving Average principles (Kaufman KAMA)
- Market Wizards momentum philosophy
- Institutional order flow patterns (5-day verification window)
HOW IT WORKS:
The scanner finds the maximum price displacement in each 10-bar window - where the market showed its hand. An adaptive filter (5-bar regression) separates real moves from noise. When momentum exceeds the volatility-adjusted threshold, states change.
IDEAL FOR:
- Momentum traders seeking explosive moves
- Swing traders (especially 4H timeframe)
- Position traders wanting institutional footprints
- Anyone tired of false breakout signals
Default parameters (10,5) optimized for 4H charts but adaptable to any timeframe. Remember: The market rewards patience and punishes heroes. Wait for clear signals.
"The market is honest. Are you?"

BTC Momentum Detector 1h# BTC Momentum Detector 1h
This indicator is designed to detect significant momentum movements in Bitcoin price on the 1-hour timeframe. It identifies candles with percentage changes within a specific range, which often precede larger price movements.
## How It Works
The indicator analyzes price movements to detect potential momentum shifts:
- Identifies candles with percentage changes between configurable thresholds (default: 1.7% - 2.8%)
- Requires neutral or inverse movement in the prior candle to avoid false signals
- Optional volume filter ensures signals are confirmed by above-average trading activity
- Tracks price continuation to calculate success rates and average returns
## Key Features
- **Signal Detection**: Green triangles below price bars indicate upward momentum signals; red triangles above price bars indicate downward momentum signals
- **Continuation Tracking**: Dashed horizontal lines show the entry price levels of active signals being tracked
- **Statistics Panel**: Displays real-time metrics including signal counts, success rates, and average returns
- **Current Status**: Shows the current price change percentage and active signals being monitored
## Parameters
- **Minimum Percentage Threshold**: Minimum price change to trigger a signal (default: 1.7%)
- **Maximum Percentage Threshold**: Maximum price change to filter out extreme moves (default: 2.8%)
- **Continuation Periods**: Number of periods to track after signal (default: 2)
- **Require Prior Neutral/Inverse**: Filters signals by requiring neutral or opposite prior movement
- **Neutral Threshold**: Defines what's considered a neutral movement (default: 0.1%)
- **Volume Filter**: Option to require above-average volume for confirmation
- **Volume Multiplier**: Volume must exceed average by this factor (default: 2x)
## Strategy Concept
The underlying strategy is based on the concept that when Bitcoin makes a controlled, significant move (not too small, not too large) after a period of neutral or opposite movement, it often continues in that direction for the next few periods. This pattern reflects the early stages of momentum development in the market.

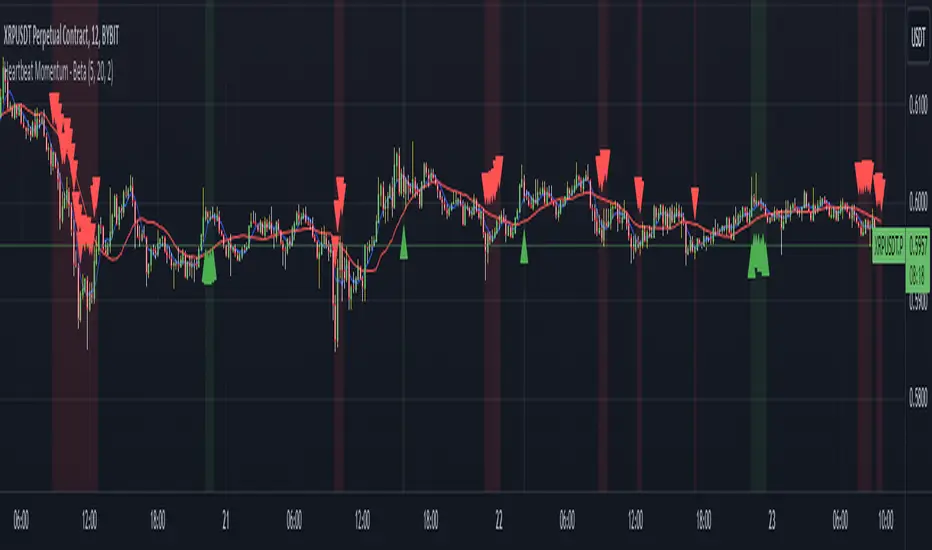
Heartbeat Momentum Strategy BetaHeartbeat Momentum Strategy Beta
Overview
The Heartbeat Momentum Strategy is an innovative approach to market analysis that draws inspiration from the rhythmic patterns of a heartbeat. This strategy aims to identify significant momentum shifts in the market by comparing short-term and long-term moving averages, analogous to detecting irregularities in a heartbeat.
Key Concepts
Market Heartbeat: The difference between short-term and long-term moving averages, representing the market's current 'pulse'.
Heartbeat Volatility: Measured by the standard deviation of the market heartbeat.
Momentum Signals: Generated when the heartbeat deviates significantly from its normal range.
How It Works
Calculates a short-term moving average (default 5 periods) and a long-term moving average (default 20 periods) of the closing price.
Computes the 'heartbeat' by subtracting the long-term MA from the short-term MA.
Measures the volatility of the heartbeat using its standard deviation over the long-term period.
Generates buy signals when the heartbeat exceeds 2 standard deviations above its mean.
Generates sell signals when the heartbeat falls 2 standard deviations below its mean.
Indicator Components
Blue Line: Short-term moving average
Red Line: Long-term moving average
Green Triangles: Buy signals
Red Triangles: Sell signals
Background Color: Light green during buy signals, light red during sell signals
Strategy Parameters
Short MA Window: The period for the short-term moving average (default: 5)
Long MA Window: The period for the long-term moving average (default: 20)
Standard Deviation Threshold: The number of standard deviations to trigger a signal (default: 2.0)
Interpretation
Buy Signal: Indicates a potential strong upward momentum shift. Consider opening long positions or closing short positions.
Sell Signal: Suggests a potential strong downward momentum shift. Consider opening short positions or closing long positions.
No Signal: The market is moving within its normal rhythm. Maintain current positions or look for other entry opportunities.
Customization
Users can adjust the strategy parameters to suit different assets, timeframes, or trading styles:
Decrease the MA windows for more frequent signals (more suitable for shorter timeframes).
Increase the MA windows for fewer, potentially more significant signals (better for longer timeframes).
Adjust the Standard Deviation Threshold to fine-tune sensitivity (lower for more signals, higher for fewer but potentially stronger signals).
Risk Management
While this strategy can provide valuable insights into market momentum, it should not be used in isolation:
Always use stop-loss orders to manage potential losses.
Consider the overall market context and other technical/fundamental factors.
Be aware of potential false signals, especially in ranging or highly volatile markets.
Backtest and forward-test the strategy with different parameters before live trading.
Conclusion
The Heartbeat Momentum Strategy offers a unique perspective on market movements by treating price action like a heartbeat. By identifying significant deviations from the normal market rhythm, it aims to capture strong momentum shifts while filtering out market noise. As with any trading strategy, use it as part of a comprehensive trading plan and always practice sound risk management.
Multi-Timeframe Momentum Indicator [Ox_kali]The Multi-Timeframe Momentum Indicator is a trend analysis tool designed to examine market momentum across various timeframes on a single chart. Utilizing the Relative Strength Index (RSI) to assess the market’s strength and direction, this indicator offers a multidimensional perspective on current trends, enriching technical analysis with a deeper understanding of price movements. Other oscillators, such as the MACD and StochRSI, will be integrated in future updates.
Regarding the operation with the RSI: when its value is below 50 for a given period, the trend is considered bearish. Conversely, a value above 50 indicates a bullish trend. The indicator goes beyond the isolated analysis of each period by calculating an average of the displayed trends, based on user preferences. This average, ranging from “Strong Down” to “Strong Up,” reflects the percentage of periods indicating a bullish or bearish trend, thus providing a precise overview of the overall market condition.
Key Features:
Multi-Timeframe Analysis : Allows RSI analysis across multiple timeframes, offering an overview of market dynamics.
Advanced Customization : Includes options to adjust the RSI period, the RSI trend threshold, and more.
Color and Transparency Options : Offers color styles for bullish and bearish trends, as well as adjustable transparency levels for personalized visualization.
Average Trend Display : Calculates and displays the average trend based on activated timeframes, providing a quick summary of the current market state.
Flexible Table Positioning : Allows users to choose the indicator’s display location on the chart for seamless integration.
List of Parameters:
RSI Period : Defines the RSI period for calculation.
RSI Up/Down Threshold: Threshold for determining bullish or bearish trends of the RSI.
Table Position: Location of the indicator’s display on the chart.
Color Style : Selection of the color style for the indicator.
Strong Down/Up Color (User) : Customization of colors for strong market movements.
Table TF Transparency : Adjustment of the transparency level for the timeframe table.
Show X Minute/Hour/Day/Week Trend : Activation of the RSI display for specific timeframes.
Show AVG : Option to display or not the calculated average trend.
the Multi-Timeframe Momentum Indicator , stands as a comprehensive tool for market trend analysis across various timeframes, leveraging the RSI for in-depth market insights. With the promise of future updates including the integration of additional oscillators like the MACD and StochRSI, this indicator is set to offer even more robust analysis capabilities.
Please note that the MTF-Momentum is not a guarantee of future market performance and should be used in conjunction with proper risk management. Always ensure that you have a thorough understanding of the indicator’s methodology and its limitations before making any investment decisions. Additionally, past performance is not indicative of future results.

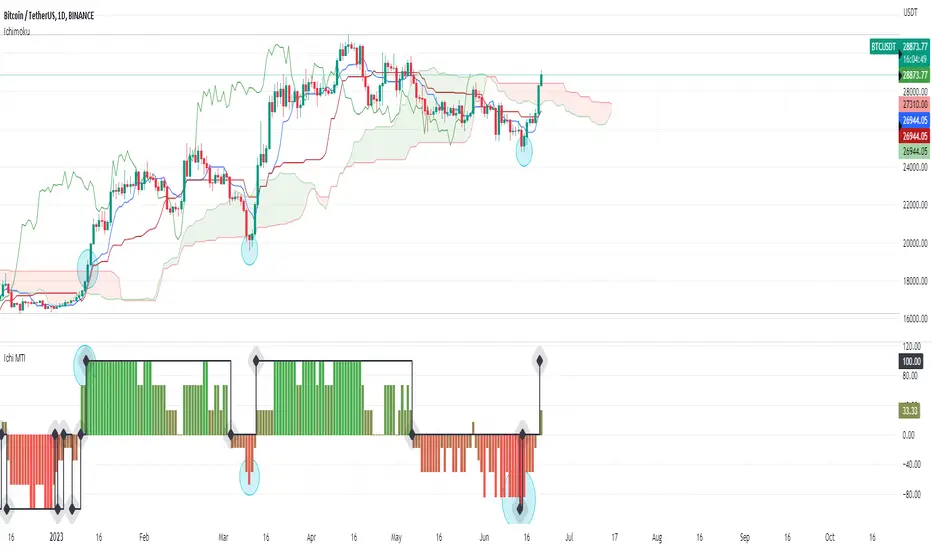
Ichimoku Cloud Momentum & Trend Indicator «NoaTrader»If you like Ichimoku cloud and use it in your analysis, or you are new to it and sometimes gets tricky to figure out all the details, this indicator tries to simplify that and visualize the change of trend and momentum relative to the past based on ichimoku.
The RED/GREEN columns are showing momentum strength while the black diamond line suggests the trend change. The conditions are simple enough to check them out on the script.
As you can see highlighted cyan circles on the chart as major important signals on the chart of Bitcoin daily timeframe.
This script tries to be complementary to the ichimoku cloud itself and cannot replace the levels represented by the cloud on chart.
Momentum Composite Indicator@CRYPTOSLIFE
This script creates a Momentum Composite Indicator (MCI) that combines four different momentum indicators: RSI, MACD, Stochastic Oscillator, and Rate of Change (ROC). Each of these indicators is calculated, normalized, and then combined with equal weights (25% each) to create the composite indicator. The script also includes a color change based on the change in the composite indicator's value.
Here's a brief explanation of the indicator:
Parameters: The script takes one input parameter, 'length,' which is used as the length for RSI, Stochastic Oscillator, and ROC calculations.
RSI: The Relative Strength Index (RSI) is calculated using the 'length' input parameter. The RSI is then normalized to range between 0 and 1.
MACD: The Moving Average Convergence Divergence (MACD) is calculated using the default lengths of 12, 26, and 9. The histogram is then computed as the difference between the MACD line and the signal line. The MACD histogram is normalized to range between 0 and 1.
Stochastic Oscillator: The Stochastic Oscillator is calculated using the 'length' input parameter, taking the lowest low and highest high over the specified period. The oscillator is then normalized to range between 0 and 1.
Rate of Change (ROC): The Rate of Change (ROC) is calculated using the 'length' input parameter. The ROC is then normalized to range between 0 and 1.
Composite Indicator: The normalized values of RSI, MACD, Stochastic Oscillator, and ROC are combined with equal weights to create the composite indicator.
Color Change: The line color changes based on the change in the composite indicator's value. If the value increases, the line color is green; if it decreases, the line color is red.
Plotting: The composite indicator is plotted on the chart with a linewidth of 5.
This Momentum Composite Indicator can help traders assess the overall momentum in the price movement of a financial instrument by combining the information from four popular momentum indicators.

GKD-C Momentum Breakout Bands [Loxx]Giga Kaleidoscope Momentum Breakout Bands is a Confirmation module included in Loxx's "Giga Kaleidoscope Modularized Trading System".
█ Giga Kaleidoscope Modularized Trading System
What is Loxx's "Giga Kaleidoscope Modularized Trading System"?
The Giga Kaleidoscope Modularized Trading System is a trading system built on the philosophy of the NNFX (No Nonsense Forex) algorithmic trading.
What is an NNFX algorithmic trading strategy?
The NNFX algorithm is built on the principles of trend, momentum, and volatility. There are six core components in the NNFX trading algorithm:
1. Volatility - price volatility; e.g., Average True Range, True Range Double, Close-to-Close, etc.
2. Baseline - a moving average to identify price trend
3. Confirmation 1 - a technical indicator used to identify trends
4. Confirmation 2 - a technical indicator used to identify trends
5. Continuation - a technical indicator used to identify trends
6. Volatility/Volume - a technical indicator used to identify volatility/volume breakouts/breakdown
7. Exit - a technical indicator used to determine when a trend is exhausted
How does Loxx's GKD (Giga Kaleidoscope Modularized Trading System) implement the NNFX algorithm outlined above?
Loxx's GKD v1.0 system has five types of modules (indicators/strategies). These modules are:
1. GKD-BT - Backtesting module (Volatility, Number 1 in the NNFX algorithm)
2. GKD-B - Baseline module (Baseline and Volatility/Volume, Numbers 1 and 2 in the NNFX algorithm)
3. GKD-C - Confirmation 1/2 and Continuation module (Confirmation 1/2 and Continuation, Numbers 3, 4, and 5 in the NNFX algorithm)
4. GKD-V - Volatility/Volume module (Confirmation 1/2, Number 6 in the NNFX algorithm)
5. GKD-E - Exit module (Exit, Number 7 in the NNFX algorithm)
(additional module types will added in future releases)
Each module interacts with every module by passing data between modules. Data is passed between each module as described below:
GKD-B => GKD-V => GKD-C(1) => GKD-C(2) => GKD-C(Continuation) => GKD-E => GKD-BT
That is, the Baseline indicator passes its data to Volatility/Volume. The Volatility/Volume indicator passes its values to the Confirmation 1 indicator. The Confirmation 1 indicator passes its values to the Confirmation 2 indicator. The Confirmation 2 indicator passes its values to the Continuation indicator. The Continuation indicator passes its values to the Exit indicator, and finally, the Exit indicator passes its values to the Backtest strategy.
This chaining of indicators requires that each module conform to Loxx's GKD protocol, therefore allowing for the testing of every possible combination of technical indicators that make up the six components of the NNFX algorithm.
What does the application of the GKD trading system look like?
Example trading system:
Backtest: Strategy with 1-3 take profits, trailing stop loss, multiple types of PnL volatility, and 2 backtesting styles
Baseline: Hull Moving Average as shown on the chart above
Volatility/Volume: Volatility Ratio as shown on the chart above
Confirmation 1: Momentum Breakout Bands as shown on the chart above
Confirmation 2: Williams Percent Range
Continuation: Fisher Transform
Exit: Rex Oscillator
Each GKD indicator is denoted with a module identifier of either: GKD-BT, GKD-B, GKD-C, GKD-V, or GKD-E. This allows traders to understand to which module each indicator belongs and where each indicator fits into the GKD protocol chain.
Giga Kaleidoscope Modularized Trading System Signals (based on the NNFX algorithm)
Standard Entry
1. GKD-C Confirmation 1 Signal
2. GKD-B Baseline agrees
3. Price is within a range of 0.2x Volatility and 1.0x Volatility of the Goldie Locks Mean
4. GKD-C Confirmation 2 agrees
5. GKD-V Volatility/Volume agrees
Baseline Entry
1. GKD-B Baseline signal
2. GKD-C Confirmation 1 agrees
3. Price is within a range of 0.2x Volatility and 1.0x Volatility of the Goldie Locks Mean
4. GKD-C Confirmation 2 agrees
5. GKD-V Volatility/Volume agrees
6. GKD-C Confirmation 1 signal was less than 7 candles prior
Continuation Entry
1. Standard Entry, Baseline Entry, or Pullback; entry triggered previously
2. GKD-B Baseline hasn't crossed since entry signal trigger
3. GKD-C Confirmation Continuation Indicator signals
4. GKD-C Confirmation 1 agrees
5. GKD-B Baseline agrees
6. GKD-C Confirmation 2 agrees
1-Candle Rule Standard Entry
1. GKD-C Confirmation 1 signal
2. GKD-B Baseline agrees
3. Price is within a range of 0.2x Volatility and 1.0x Volatility of the Goldie Locks Mean
Next Candle:
1. Price retraced (Long: close < close or Short: close > close )
2. GKD-B Baseline agrees
3. GKD-C Confirmation 1 agrees
4. GKD-C Confirmation 2 agrees
5. GKD-V Volatility/Volume agrees
1-Candle Rule Baseline Entry
1. GKD-B Baseline signal
2. GKD-C Confirmation 1 agrees
3. Price is within a range of 0.2x Volatility and 1.0x Volatility of the Goldie Locks Mean
4. GKD-C Confirmation 1 signal was less than 7 candles prior
Next Candle:
1. Price retraced (Long: close < close or Short: close > close )
2. GKD-B Baseline agrees
3. GKD-C Confirmation 1 agrees
4. GKD-C Confirmation 2 agrees
5. GKD-V Volatility/Volume Agrees
PullBack Entry
1. GKD-B Baseline signal
2. GKD-C Confirmation 1 agrees
3. Price is beyond 1.0x Volatility of Baseline
Next Candle:
1. Price is within a range of 0.2x Volatility and 1.0x Volatility of the Goldie Locks Mean
3. GKD-C Confirmation 1 agrees
4. GKD-C Confirmation 2 agrees
5. GKD-V Volatility/Volume Agrees
█ Momentum Breakout Bands
What is Momentum Breakout Bands?
Momentum Breakout Bands is a momentum oscillator with Bollinger Bands to filter noise by standard deviation. This is used for breakout trading and can be used on lower timeframes.
Requirements
Inputs
Confirmation 1 and Solo Confirmation: GKD-V Volatility / Volume indicator
Confirmation 2: GKD-C Confirmation indicator
Outputs
Confirmation 2 and Solo Confirmation: GKD-E Exit indicator
Confirmation 1: GKD-C Confirmation indicator
Continuation: GKD-E Exit indicator
Additional features will be added in future releases.
Percent Volatility MomentumThis pine script calculates percent volatility momentum, negative percent volatility and positive percent volatility. The blue line is the overall momentum of the current percent volatility trend. The red line only includes negative movements in the percent volatility of the source. The green line includes only positive movements of the percent volatility of the source. The script also includes an angle and a normalized angle setting that allows one to determine the angle of the source curve. Note, the angle was transformed from -90 to 90 to 0 to 100. Such that an angle of -90 is transformed to 0. An angle of 0 is transformed to 50 and an angle of 90 is transformed to 100. This is the first draft of this script and my first pine script published. Any feedback is welcome. I borrowed code from TradingView's Linear Regression Channel and Relative Strength Index pine scripts.
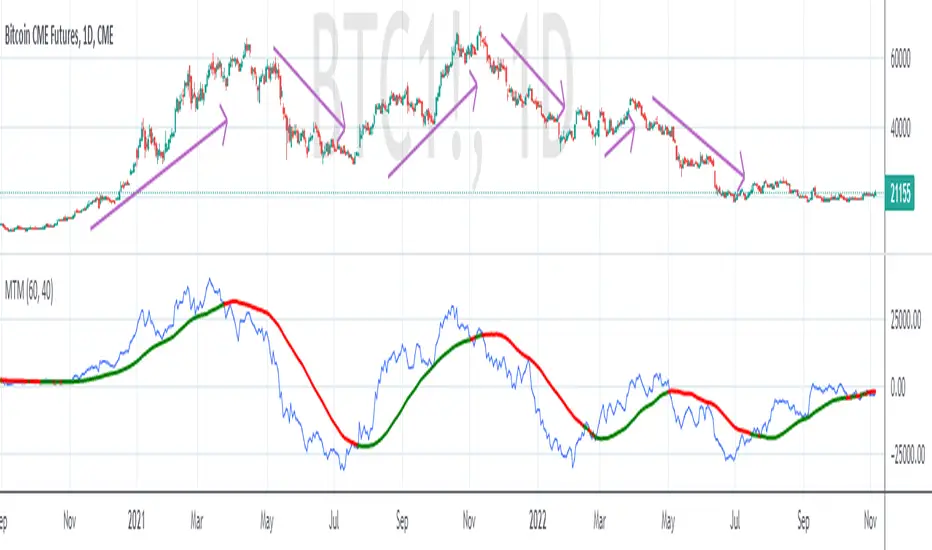
MTM - Momentum IndicatorMTM - Momentum
Description
The Momentum indicator is a speed of movement indicator that is designed to identify the speed (or strength) of price movement. This indicator compares the current close price to the close price N bars ago and also displays a moving average of this difference.
Category
Momentum Indicators
Parameters
N ( Default: 6 Min: 1 Max: 100 )
N1 ( Default: 6 Min: 1 Max: 100 )
Chart Script
MTM : CLOSE-REF(CLOSE,N);
MTMMA : MA(MTM,N1)
www.edgerater.com
Munich's Momentum Wave V2MUNICH'S MOMENTUM WAVE VERSION 2 IS LIVE!!!
There are a few big things to note with this one.
I decided to upload this as an entirely new script due to the number of changes differing from the first version, but as the last one, this will still work on ANY TIMEFRAME, ANY ASSET CLASS, ANY PRICE! .
This momentum wave indicator now will give you data for when trend could turn, and two momentum indicators to help you decide when to take an entry.
First off,
*I have added an alma ma (alma) that will track momentum alongside price action and further lead the indicator consisting of the Munich waves.
* The background feature will track the price using a method derived from the Bollinger bands, after calculations, it will color the background based on the average of the momentum's ema's, the alma ma, and also the alma in comparison to the alma's value pre offset ( the offset is 3, following the basis).
*There are now 5 basis values given from the increase in ema samples.
If anyone has any questions feel free to pm me or comment below. Thank you guys for the support! :)
INDEX:BTCUSD TVC:NDQ AMEX:SPY BITSTAMP:ETHUSD BINANCE:BTCUSDT FX:USDJPY NASDAQ:AAPL

Dap's Oscillator- Short Term Momentum and Trend. BINANCE:BTCUSDT BYBIT:BTCUSDT BYBIT:ETHUSDT BINANCE:ETHUSDT
DAP's OSCILLATOR:
WHAT IS IT?
This Oscillator was created to inspire confidence in the short-term trend of traders. This will work very well with a volatility metric (I recommend BBWP by @The_Caretaker)
WHAT IS IT MADE OF?
1. Consists of a series of equations (mainly the difference between simple to exponential moving averages) and Standard deviations of these moving average differences (length equivalent to the length of sampled ma's)
2. These equations are then boiled down through an averaging process array, after averaging the covariants are equated against the variants of the positive side of the array. This is what is presented as the aqua line.
3. The RC average (yellow) is the sma following the DAP'S Oscillator at a specified length
4. The most important part of this indicator is simply the momentum oscillator represented as a green or red line based on the value relative to the Oscillators.
HOW DO I USE THIS?
As I mentioned before mixed with a volatility metric, it should set you up for a good decision based on short-term trends. I would say to be careful for periods of consolidation, with the consolidation the momentum often meets hands with DAP's Oscillator and can cause fake-outs. You want to spot divergences from the price to the momentum difference, as well as room to work down or upward to secure a good entry on a position.
CHEAT CODE'S NOTES:
I appreciate everyone who has boosted my previous scripts, it means a lot. If you want to translate words to pine script onto a chart, feel free to PM me. I would be happy to help bring an indicator to life. I may take a quick break but will be back shortly to help create more cheat codes for yall. Thanks!
-Cheat Code

Synthetic EMA Momentum w/ DSL [Loxx]Synthetic EMA Momentum w/ DSL is a momentum indicator that is calculated with 5 different EMAs of increasing period to derive a final momentum value. This helps reduce noise and improve signal quality. Discontinued signal lines are uses to calculate signal values.
What are DSL Discontinued Signal Line?
A lot of indicators are using signal lines in order to determine the trend (or some desired state of the indicator) easier. The idea of the signal line is easy : comparing the value to it's smoothed (slightly lagging) state, the idea of current momentum/state is made.
Discontinued signal line is inheriting that simple signal line idea and it is extending it : instead of having one signal line, more lines depending on the current value of the indicator.
"Signal" line is calculated the following way :
When a certain level is crossed into the desired direction, the EMA of that value is calculated for the desired signal line
When that level is crossed into the opposite direction, the previous "signal" line value is simply "inherited" and it becomes a kind of a level
This way it becomes a combination of signal lines and levels that are trying to combine both the good from both methods.
In simple terms, DSL uses the concept of a signal line and betters it by inheriting the previous signal line's value & makes it a level.
Included:
Loxx's Expanded Source Types
Alerts
Signals
Bar coloring
Related indicators
Smoother Momentum MACD w/ DSL
T3 Velocity
