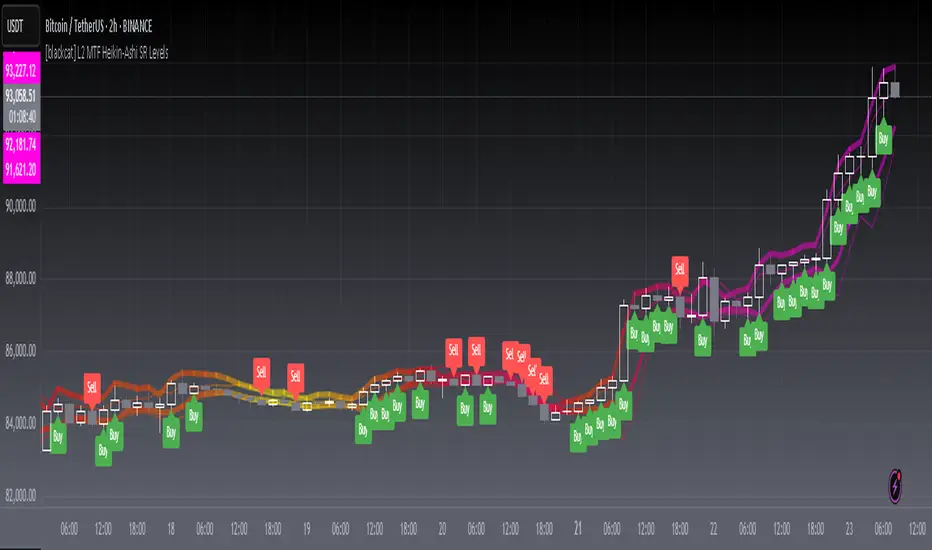
[blackcat] L2 MTF Heikin-Ashi SR LevelsOVERVIEW
The L2 MTF Heikin-Ashi SR Levels indicator is a sophisticated tool designed to help traders identify critical support and resistance levels across multiple timeframes. This script employs Heikin-Ashi candles, which provide a smoothed representation of price action, making it easier to spot trends and reversals. By integrating multi-timeframe analysis, this indicator offers a comprehensive view of market dynamics, enabling traders to make more informed decisions 📊✅.
This indicator not only calculates essential support and resistance levels but also visually represents them on the chart with gradient colors based on Relative Strength Index (RSI) values. Additionally, it features customizable alerts and labels to enhance user experience and ensure timely execution of trades.
FEATURES
Advanced Trend Identification:
Uses Heikin-Ashi candles for smoother price action analysis.
Helps filter out noise and focus on significant trends.
Ideal for both short-term and long-term trading strategies.
Multi-Timeframe Analysis:
Allows users to select different resolutions for deeper insights.
Ensures compatibility with various trading styles and preferences.
Comprehensive Support and Resistance Calculation:
Computes four distinct levels: Support Level 1, Support Level 2, Resistance Level 1, and Resistance Level 2.
Each level serves as a reference point for potential price reversals or continuations.
Gradient Color Visualization:
Employs a spectrum of colors derived from RSI values to represent support and resistance lines.
Enhances readability and helps traders quickly assess market sentiment 🎨.
Dynamic Labels and Alerts:
Automatically generates buy ('Buy') and sell ('Sell') labels when price crosses key levels.
Provides real-time alerts for crossing events, ensuring traders never miss important signals 🔔.
Customizable Parameters:
Offers adjustable Length and Resolution inputs for tailored performance.
Allows traders to fine-tune the indicator according to their unique needs and strategies.
HOW TO USE
Adding the Indicator:
Open your TradingView chart and navigate to the indicators list.
Search for ' L2 MTF Heikin-Ashi SR Levels' and add it to your chart.
Configuring Settings:
Adjust the Length parameter to determine the period over which calculations are made.
A shorter length increases sensitivity, while a longer length smoothens the output.
Choose a specific Resolution to analyze different timeframes simultaneously.
For example, set it to 'D' for daily charts or 'W' for weekly charts.
Interpreting the Chart:
Observe the plotted support and resistance lines on the chart.
Look for price interactions with these levels to identify potential entry and exit points.
Pay attention to the gradient colors, which reflect underlying market momentum.
Setting Up Alerts:
Configure alerts based on the generated signals to receive instant notifications.
Customize alert messages and conditions to suit your trading plan.
Utilizing Labels:
Use the automatically placed buy and sell labels as quick references for decision-making.
Combine these labels with other technical analyses for confirmation.
Backtesting and Optimization:
Thoroughly test the indicator on historical data to evaluate its performance.
Optimize settings and refine your strategy based on backtest results.
Live Trading:
Apply the indicator to live charts and monitor real-time price movements.
Execute trades based on the generated signals and adjust positions accordingly.
Combining with Other Tools:
Integrate this indicator with other technical tools and fundamental analyses for a holistic approach.
Consider using moving averages, oscillators, or volume indicators alongside L2 MTF Heikin-Ashi SR Levels.
LIMITATIONS
Market Volatility:
In highly volatile or ranging markets, the indicator might produce false signals due to erratic price movements 🌪️.
Traders should exercise caution during such periods and consider additional confirmations.
Timeframe Dependency:
The effectiveness of the indicator can vary significantly depending on the chosen timeframe and asset.
Always validate the indicator's performance across different contexts before relying solely on it.
Over-reliance Risk:
While powerful, no single indicator guarantees success in all market conditions.
Combining this tool with other analytical methods enhances reliability and reduces risk.
NOTES
Data Requirements:
Ensure your chart has enough historical data to perform accurate calculations.
Insufficient data may lead to inaccurate or incomplete results.
Demo Testing:
Before deploying the indicator in live trading, conduct extensive testing on demo accounts.
Familiarize yourself with how the indicator behaves under various market scenarios.
Parameter Tuning:
Experiment with different Length and Resolution settings to find what works best for your trading style.
Regularly review and update parameters as market conditions evolve.
Continuous Learning:
Stay updated with the latest developments in technical analysis and trading strategies.
Adapt your use of the indicator based on new insights and experiences.
THANKS
Additionally, gratitude goes to the broader TradingView community for fostering collaboration and knowledge-sharing among traders worldwide. Together, we strive to elevate our understanding and application of financial markets 🌍💡.
Cari dalam skrip untuk "mtf"
Market Structure MTF Trend [Pt]█ Author's Notes
There are numerous market structure indicators in the TradingView library, each offering a unique approach to identifying price action shifts. Market Structure MTF Trend was created with simplicity and flexibility in mind—providing a highly customizable multi-timeframe setup, visually clear trendlines, and straightforward labeling. This combination helps both new and experienced traders easily spot and interpret market structure changes.
█ Overview
Market Structure MTF Trend is a powerful yet user-friendly indicator designed to identify and visualize key turning points in price action. It focuses on two core concepts:
Change of Character (CHoCH): A momentary shift in the market’s behavior, signaling that the current price movement may be losing momentum and could soon reverse.
Break of Structure (BoS): A more definitive event confirming a new price pattern, where the market establishes a fresh trend direction by surpassing previous swing highs or lows.
By combining these signals across up to four different timeframes, even traders unfamiliar with market structure can quickly learn to spot and validate potential trend reversals or continuations.
█ Key Features
Multi-Timeframe Analysis: Monitors CHoCH and BoS events simultaneously on multiple intervals (e.g., 15m, 30m, 60m, 240m), providing a clear, layered understanding of market dynamics.
Straightforward Visual Cues: Labels are placed directly on the chart at swing highs and lows, while colored bars at the bottom give an instant snapshot of whether each timeframe is bullish or bearish.
Configurable Timeframes & Pivot Strength: Easily set up the desired intervals and adjust pivot strength to tune how sensitive the indicator is to minor price fluctuations.
Color-Coded Signals: Different colors help you distinguish between potential early reversals (CHoCH) and confirmed shifts (BoS), ensuring each signal’s importance is immediately clear.
█ Usage & Benefits
Learn Market Structure Basics: For those new to swing highs/lows, CHoCH, and BoS, the script’s on-chart labels and dynamic bar coloring provide a practical, visual way to grasp these concepts.
Spot Reversals Early: CHoCH alerts you to possible shifts in momentum, allowing you to anticipate trend changes before they fully develop.
Confirm Trend Breaks: BoS events confirm that the market has established a new directional bias, reinforcing higher‐probability entry or exit points.
Reduce Noise & Stay Focused: The multi-timeframe setup ensures you won’t overlook larger trends or get lost in smaller fluctuations.
Streamline Decision-Making: Color-coded bars let you gauge overall market sentiment at a glance—ideal for quickly validating trades without juggling multiple charts.
Market Structure MTF Trend is perfect for traders who want to learn or refine their understanding of price action. By integrating multiple timeframes into a single, cohesive interface, this tool highlights both subtle shifts and confirmed breaks in market structure, empowering you to trade with greater insight and confidence.

SSL Channel MTFSSL Channel with MTF support, This eliminates the noise of a basic SSL Channel script which is based on ErwinBeckers SSL Channel. So i have used a Multi Time Frame approach to have a clear confirmation of trend and reduce Noise and False signals unlike basic SSL Channel.
This script can be used to determine.
Support/Resistance
High/Low Breakout
Trend Direction
MA candles for Entry
The high and low sma are plotted as SSL CHANNEL when ever the high and low sma cross each other a direction change is observed.
The direction of SSL channel determines the trend of the price. The length of the channel can be changed as required a low value has a high noise and direction can be determined with low accuracy. Increasing the length of SSL channel has high accuracy trend confirmation.
The MTF SSL Channel uses plot from higher timeframe this helps in using SSL Channel as a Price Action Tool. Price when ever crosses over or below the channel determines a breakout. Price tries to move between the High SMA line and Low SMA Line of the SSL Channel rejection, breakouts can be easily observed on a lower timeframe using SSL Channel Plot from a higher timeframe.
I have used 5min/15min chart with MTF SSL from a 1Hr/4Hr and a length of 5 instead of 10. This helps quick direction changes over a period of 1hr to 4hr. Price is trapped within the High SMA and Low SMA lines of SSL Channel. In addition to SSL High Low and average mid line is plotted to additional reference.
Buy Sell Signals are plotted based on crossover of SMA High and Low.
Candle are Plotted Using a SMA with length of 5. This Candle Plot can be used to make an entry based on direction confirmation of SSL. keep in mind the direction of SSL Plot and the candle must be same. Preferably Entry can made above or below the midline of SSL Channel. The Candle Plot eliminates the Noise of traditional Japanese Candlesticks.
Additionally MACD Crossover and MACD Trend line confirmations can be used to confirm a Buy Sell and Entry signals
Alerts are also plotted accordingly.

Support and Resistance Signals MTF [LuxAlgo]The Support and Resistance Signals MTF indicator aims to identify undoubtedly one of the key concepts of technical analysis Support and Resistance Levels and more importantly, the script aims to capture and highlight major price action movements, such as Breakouts , Tests of the Zones , Retests of the Zones , and Rejections .
The script supports Multi-TimeFrame (MTF) functionality allowing users to analyze and observe the Support and Resistance Levels/Zones and their associated Signals from a higher timeframe perspective.
This script is an extended version of our previously published Support-and-Resistance-Levels-with-Breaks script from 2020.
Identification of key support and resistance levels/zones is an essential ingredient to successful technical analysis.
🔶 USAGE
Support and resistance are key concepts that help traders understand, analyze and act on chart patterns in the financial markets. Support describes a price level where a downtrend pauses due to demand for an asset increasing, while resistance refers to a level where an uptrend reverses as a sell-off happens.
The creation of support and resistance levels comes as a result of an initial imbalance of supply/demand, which forms what we know as a swing high or swing low. This script starts its processing using the swing highs/lows. Swing Highs/Lows are levels that many of the market participants use as a historical reference to place their trading orders (buy, sell, stop loss), as a result, those price levels potentially become and serve as key support and resistance levels.
One of the important features of the script is the signals it provides. The script follows the major price movements and highlights them on the chart.
🔹 Breakouts (non-repaint)
A breakout is a price moving outside a defined support or resistance level, the significance of the breakout can be measured by examining the volume. This script is not filtering them based on volume but provides volume information for the bar where the breakout takes place.
🔹 Retests
Retest is a case where the price action breaches a zone and then revisits the level breached.
🔹 Tests
Test is a case where the price action touches the support or resistance zones.
🔹 Rejections
Rejections are pin bar patterns with high trading volume.
Finally, Multi TimeFrame (MTF) functionality allows users to analyze and observe the Support and Resistance Levels/Zones and their associated Signals from a higher timeframe perspective.
🔶 SETTINGS
The script takes into account user-defined parameters to detect and highlight the zones, levels, and signals.
🔹 Support & Resistance Settings
Detection Timeframe: Set the indicator resolution, the users may examine higher timeframe detection on their chart timeframe.
Detection Length: Swing levels detection length
Check Previous Historical S&R Level: enables the script to check the previous historical levels.
🔹 Signals
Breakouts: Toggles the visibility of the Breakouts, enables customization of the color and the size of the visuals
Tests: Toggles the visibility of the Tests, enables customization of the color and the size of the visuals
Retests: Toggles the visibility of the Retests, enables customization of the color and the size of the visuals
Rejections: Toggles the visibility of the Rejections, enables customization of the color and the size of the visuals
🔹 Others
Sentiment Profile: Toggles the visibility of the Sentiment Profiles
Bullish Nodes: Color option for Bullish Nodes
Bearish Nodes: Color option for Bearish Nodes
🔶 RELATED SCRIPTS
Support-and-Resistance-Levels-with-Breaks
Buyside-Sellside-Liquidity
Liquidity-Levels-Voids

Regression Channel Alternative MTF█ OVERVIEW
This indicator displays 3 timeframes of parallel channel using linear regression calculation to assist manual drawing of chart patterns.
This indicator is not true Multi Timeframe (MTF) but considered as Alternative MTF which calculate 100 bars for Primary MTF, can be refer from provided line helper.
The timeframe scenarios are defined based on Position, Swing and Intraday Trader.
█ INSPIRATIONS
These timeframe scenarios are defined based on Harmonic Trading : Volume Three written by Scott M Carney.
By applying channel on each timeframe, MW or ABCD patterns can be easily identified manually.
This can also be applied on other chart patterns.
█ CREDITS
Scott M Carney, Harmonic Trading : Volume Three (Reaction vs. Reversal)
█ TIMEFRAME EXPLAINED
Higher / Distal : The (next) longer or larger comparative timeframe after primary pattern has been identified.
Primary / Clear : Timeframe that possess the clearest pattern structure.
Lower / Proximate : The (next) shorter timeframe after primary pattern has been identified.
Lowest : Check primary timeframe as main reference.
█ EXAMPLE OF USAGE / EXPLAINATION

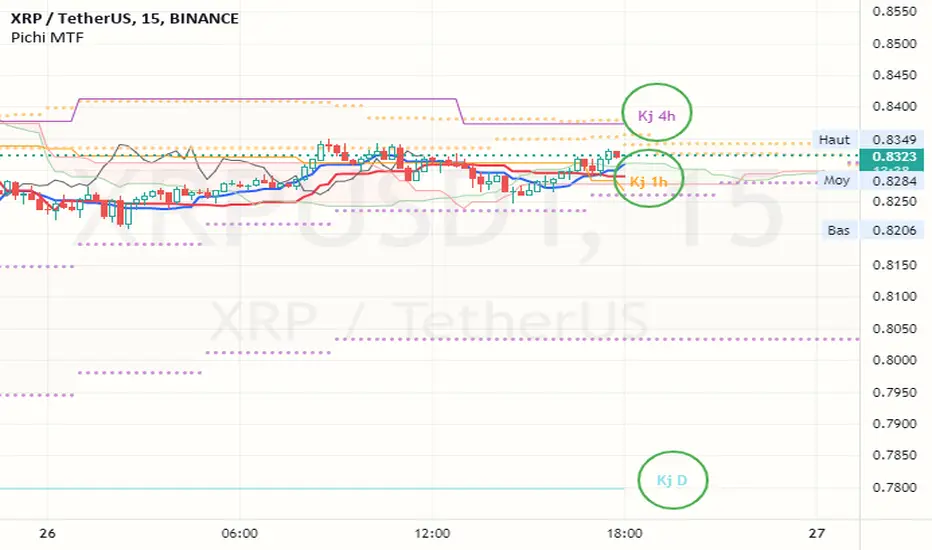
Pax24 MTF IchimokuPax24 Multiple Time Frames and Adaptative Ichimoku Cloud.
(based on the scripts : MTF Selection Framework by PineCoders and MTF ichimoku by anthonyf50)
Possible display :
- four differents Ichimoku, 1 current and 3 from higher UT (depending on your actual UT)
- Tenkan, Kijun, Chikou and Kumo for all
- labels : offset from line, color if you change style and with/without abbreviation
The 3 upper ichimoku you can display depends of your actual Time Frame :
- M1, M3 => M5 M15 H1
- M5 => M15 H1 H4
- M15, M30, M45 => H1 H4 D
- H1, H2, H3 => H4 D W
- H4, H6, H12 => D W M
- D => W M
- W => M
- M => none other
To add the indicator on your graph, go to "Indicators" then search for "Pax24 MTF Ichimoku" and add the script to your favorites.
-------- CONFIGURATION -------
Base : ichimoku numbers
ichimoku and +1 +2 +3 : Show the first ichimoku (actual UT) and 3 others (higher UT)
for each :
Tenkan : Show the Tenkan
Kijun : Show the Kijun
Chikou : Show the Chikou (Lagging span)
Kumo : Show the Kumo
Label : Show the labels
Offset : Label offset
Color : Label color (because you can't change the style of the label in "Style")
Abbreviation : Label abbreviation (Tk = Tenkan)
If you want to best see others UT kumo, change transparency in style for Kumo
There may be slow display since TradingView requires a minimum of candles to make these calculations. Just zoom out and then zoom in to fix the problem (especially for kumo).
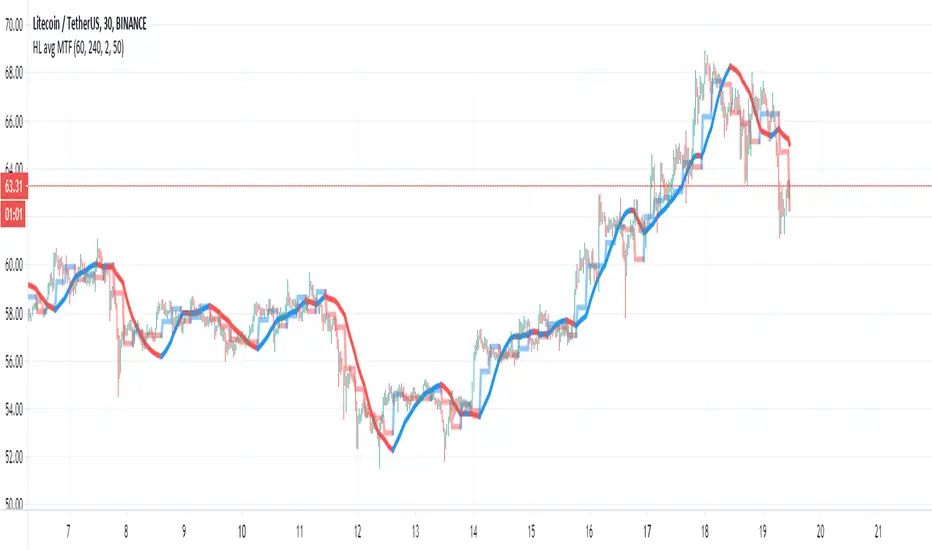
HL avg MTFThis indicator try to find trends more accurate
So first step is to make candle MTF and to find the average of high and low of the MTF candle. I think a ratio of 4/1 is good .
so this seen in the lime /red line
after we take this line and transform it to linear regression type . I use here 50 candle size seen in blue line
if close are above the blue line then we are above the avg of the high and low of the mtf candle .. this indicate a positive trend. if we close is bellow the blue line then it a negative trend and it good time to short it .
also very important is the direction of the blue line as it give us the direction of the trend
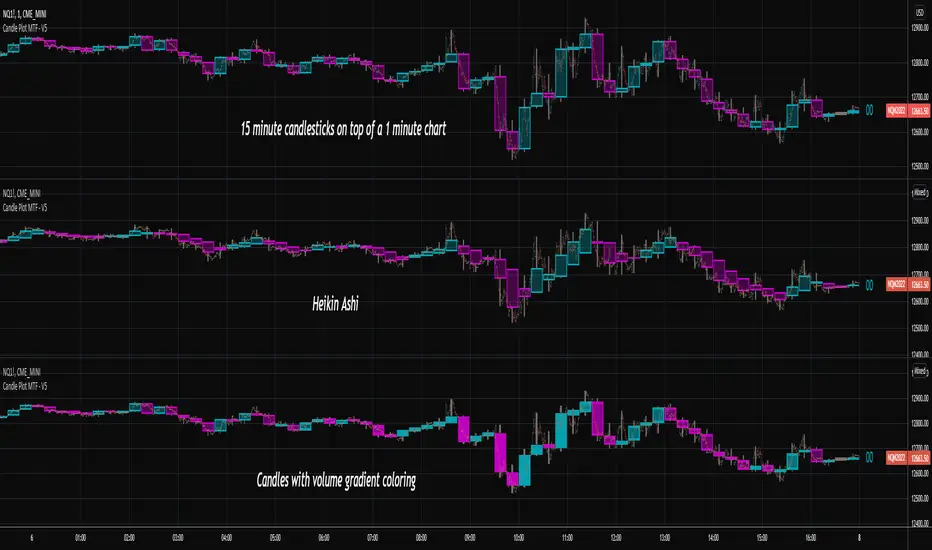
Candlestick Plot MTFPlots the live non-repainting candles for a higher time interval than the chart interval.
Features:
Configuration of the look and feel of the MTF candles.
Live candles update as the price action evolves for the session.
Historical candles can be toggled on/off.
Includes a moving average ribbon that is also MTF, matching the interval chosen.
Please watch this video to understand more:
RSI Shaded - MTF
Non-repainting multiple time frame RSI with shading of overbought and oversold levels.
Includes option for simple moving average smooth of the RSI (Larry Connors)
Includes option to plot the EMA of the RSI
Related to RSI Shaded .
For other multiple time frame indicators see:
Adaptive ATR-ADX Trend
Fisher Transform MTF
ADX-DI MTF
Laguerre RSI MTF
[OZ]MTF Ichimoku CloudBased on this script from RicardoSantos:
This script can display Ichimoku cloud , SSA , SSB , Chikou, Kijun and Tenkan from another time frame.
With it you can apply Karen Péloille's MTF Ichimoku Kinko Hyo advanced trading techniques on TradingView.
By default Tenkan is not displayed (fully transparent).
The original script has been enhanced to draw the full cloud beyond the price and to draw the Chikou.

SMA/WMA histogram with MTF and alertsThis histogram is based on the difference between SMA and WMA (I make it as false MACD to create signals)
Since we have the non repainting MTF function we can see the buy and the sell signals at different time frames.
the color of the histo change according to difference so as the color change from dark red to light red be ready to buy and if color change from dark green to light green be ready to sell. The signal based on cross to the 0 .
since you have MTF in build you can change time frame changing int2 to desire min you want
here 60 min MTF on 30 min graph. you can make any variation you want .it flexible model allow you to find the best setting for your purpose

modified DMI with MTF and alertsThis is special indicator based on DMI , I add to time length MTF that is not repainting
you can change the MTF using int2 function
the alerts are based on crossing the 0 (up or down)
I hope you like it
with no MTF

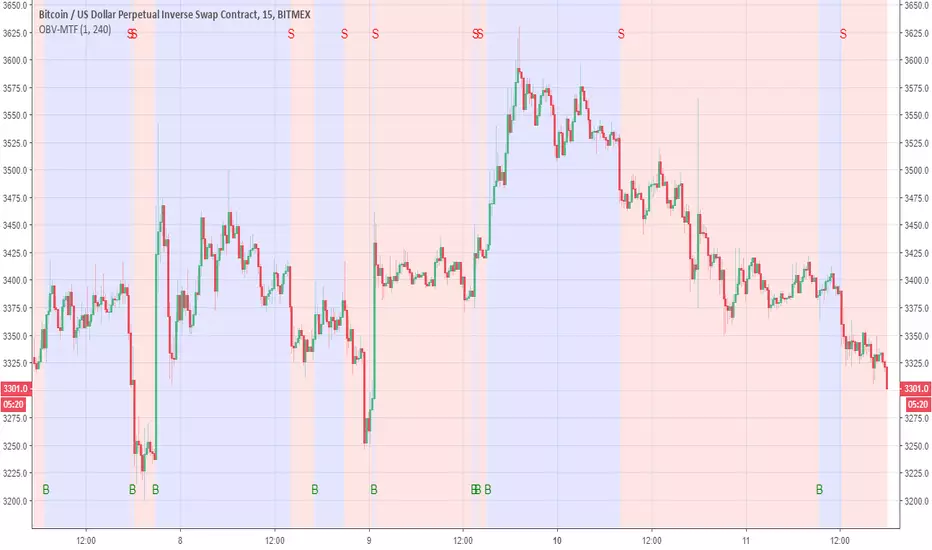
OBV-MTFUsing modified OBV volume equetion and using our modified MTF length (not need to use security so no repaint )
the Buy and Sell reresent in B and S and by the colors of bullish compare to bearish
You change the MTF by changing int2
in this example is set to 240 min MTF over 15 min charts
alerts inside
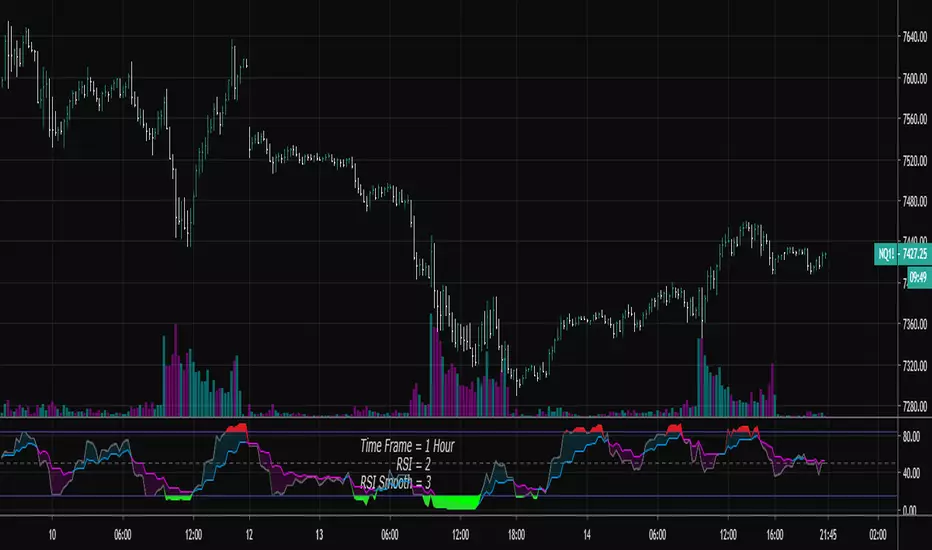
lsi (study about length and MTF) Here in this example I took lazy bear famous momentum squeeze indicator . the problem that there is lagging in the indicator so the buy and sell will be late . So instead the KC length that the original script had we put
int1=input(30)
int2=input(60)
lengthKC=isintraday and interval >= int1 ? int2/interval * 7 : isintraday and interval < 60 ? 60/interval * 24 * 7 : 7
this allow us to create a time and length related function to indicator and result in better output with no lagging
The second and most important thing is the ability to create indicator with time function as MTF without the security function that create repaint
all you need to do is to change int2 (to the time min of your choice ) and you can create an indicator with MTF function without the security function .And by this hopefully avoid the repainting issue
when you use this indicator change the setting of int1 and int 2 according to time frame that you use
lets say 15 min graph
make the int1 <15 min and the int2 at 15 min. if you want to see it as MTF just increase the int2 to the time set of your choice and play little with int1 to best setting

SMA Dow-Flow MTF (SAXO Logical Alert)This script is an advanced MTF (multi-timeframe) monitor that combines the concepts of Dow Theory and SMA (Single Moving Average) to capture the moment when trends align across multiple timeframes. It is particularly focused on visualizing when lower timeframes synchronize with the direction of higher timeframes, without being distracted by short-term noise. 1. Trend Determination Mechanism (Core Logic): Rather than the usual simple determination of whether a price is above or below a moving average, this is based on updates of "low lows and highs." Pivot Detection: Points where the SMA moves in a "V" or "inverted V" shape are recorded as reversal candidates ($lastH$, $lastL$). Trend Reversal Conditions: Uptrend: When the price clearly breaks above the most recent SMA high ($lastH$). Downtrend: When the price clearly breaks below the most recent SMA low ($lastL$). 2. Indicator Features ① Sync Hierarchy: This script counts the degree to which the direction of each time period matches that of the higher time period, starting from the lower time period. The 5-minute time period forms a trend. The 15-minute time period follows the same direction as the 5-minute time period. The 1-hour time period follows the same direction as the 15-minute time period... (continues up to the daily time period). This ensures that an alert is sent out when the larger trend (daily or 4-hourly) swallows up the smaller trend (5-minute or 15-minute). ② Set Selection: You can switch between the "Yen Set (AUDJPY, EURJPY, etc.)" and the "Dollar Set (EURUSD, GBPUSD, etc.)." This allows you to grasp the strength or weakness of a specific currency (e.g., a weak yen or a strong dollar) at a glance.
This script's alert function does not simply sound when the trends match, but is designed to pinpoint the moment when the number of trend synchronizations increases (i.e., when momentum increases).
Below, we will explain in detail how it works and the meaning of the notifications.
1. Alert Conditions
An alert will only be triggered when all three of the following conditions are met.
Increase in Sync Count: For example, if only two time frames, the 5-minute and 15-minute ones, were aligned (Sync: 2), and the 1-hour one also aligns in the same direction (Sync: 3), the alert will be triggered.
Above the set minimum count (alert_min): The default setting is "3." In this case, a notification will be triggered the moment three, four, or five time frames are synchronized.
Selected Set Only: If the "Yen Set" is displayed, an alert will not be triggered even if a currency pair in the Dollar Set is synchronized.
2. How to Read the Alert Message
When you receive a notification, the following message will be displayed.
USDJPY: 4-Bar Synchronization (Upward)
USDJPY: A Currency Pair Gaining Momentum
4-Bar Synchronization: Indicates that the direction of the four timeframes (5-minute, 15-minute, 1-hour, and 4-hour) is consistent, starting with the lowest timeframe.
Upward/Downward: The direction of the synchronization.
このスクリプトは、「ダウ理論」と「移動平均線(SMA)」の考え方を組み合わせ、複数の時間足でトレンドが揃った瞬間を捉えるための高度なMTF(マルチタイムフレーム)モニターです。特に、短期的なノイズに惑わされず、上位足の方向に下位足が同期したタイミングを視覚化することに特化しています。1. トレンド判断の仕組み(コアロジック)通常の「移動平均線より上か下か」という単純な判定ではなく、「押し安値・戻り高値」の更新をベースにしています。ピボットの検知: SMAが「V字」または「逆V字」に動いた地点を、反転の候補($lastH$, $lastL$)として記録します。トレンド転換の条件:上昇トレンド: 価格が直近のSMA高値($lastH$)を明確に上抜けたとき。下落トレンド: 価格が直近のSMA安値($lastL$)を明確に下抜けたとき。2. インジケーターの特徴① 同期(Sync)の階層構造このスクリプトは、下位足から順に「どれだけ上位足と方向が一致しているか」をカウントします。5分足がトレンドを形成。15分足が5分足と同じ方向。1時間足が15分足と同じ方向……(日足まで続く)これにより、「大きな流れ(日足・4時間足)に、小さな流れ(5分・15分)が飲み込まれた瞬間」を逃さずアラート通知します。② セット選択機能「円セット(AUDJPY, EURJPYなど)」と「ドルセット(EURUSD, GBPUSDなど)」を切り替えて表示できます。これにより、特定の通貨の強弱(円安・ドル高など)を一目で把握できるのが強みです。
このスクリプトのアラート機能は、単に「トレンドが一致した」ときに鳴るのではなく、**「トレンドの同期数が増加した瞬間(=勢いが増した瞬間)」**をピンポイントで通知するように設計されています。
以下に、その仕組みと通知内容の意味を詳しく解説します。
1. アラートが発生する条件
アラートは、以下の3つの条件がすべて揃った時にのみ発信されます。
同期数(Sync Count)の増加: 例えば、それまで「5分足と15分足」の2つしか揃っていなかった(Sync: 2)のが、新しく「1時間足」も同じ方向に揃った(Sync: 3)という変化の瞬間に鳴ります。
設定した最小数以上 (alert_min): 初期設定では「3」になっています。この場合、3つ、4つ、または5つの時間足が同期した瞬間に通知が飛びます。
選択中のセットのみ: 「円セット」を表示している時は、ドルセットの通貨ペアが同期してもアラートは鳴りません。
2. アラートメッセージの読み方
通知が来ると、以下のようなメッセージが表示されます。
USDJPY: 4足同期 (上昇)
USDJPY: 勢いが出た通貨ペア
4足同期: 下位足から順に「5分・15分・1時間・4時間」の4つの時間足で方向が一致したことを示します。
上昇 / 下落: その同期している方向です。

Daily Bias Panel (with MTF Toggle)Daily Bias Panel Documentation
Overview
The Daily Bias Panel is a TradingView indicator designed to provide a structured, multi factor assessment of market direction for intraday and swing traders. It consolidates several key bias components—Prior Day levels, VWAP, Overnight High/Low, Multi Timeframe Market Structure, and an Overall Bias—into a clean, compact table. A confidence meter summarizes the combined strength of all signals.
This document explains each line item, the rules behind it, and how to interpret the panel.
1. Prior Day Bias
Definition
Compares the current price to the previous day’s high and low.
Rules
• Bullish (1): Close > Prior Day High
• Bearish (-1): Close < Prior Day Low
• Neutral (0): Price is between the prior high and low
Interpretation
This bias reflects whether the market is breaking out above or below the previous day’s range. It is a foundational directional signal.
2. VWAP Bias
Definition
Measures whether price is trading above or below the Volume Weighted Average Price.
Rules
• Bullish (1): Close > VWAP
• Bearish (-1): Close < VWAP
• Neutral (0): Price is at VWAP
Interpretation
VWAP is a widely used institutional benchmark. Trading above VWAP suggests buyers are in control; below VWAP suggests sellers dominate.
3. ONH / ONL Bias (Overnight High / Low)
Definition
Tracks the overnight session’s high and low (18:00–09:30 ET) and compares current price to those levels.
Rules
• Bullish (1): Close > Overnight High
• Bearish (-1): Close < Overnight Low
• Neutral (0): Price is inside the overnight range
Interpretation
ONH/ONL is extremely important for index futures (ES/NQ). Breaking ONH/ONL often signals strong directional intent at the RTH open.
4. Struct MTF (Market Structure Bias)
Definition
A weighted blend of market structure trends across multiple timeframes.
Modes
Swing Mode
• 4H (50%)
• 1H (30%)
• 15M (20%)
Intraday Mode
• 1H (40%)
• 15M (35%)
• 5M (25%)
Rules
Each timeframe is classified as:
• Bullish (1): Higher High + Higher Low
• Bearish (-1): Lower High + Lower Low
• Neutral (0): No clear structure
The weighted average produces a final structure score.
Interpretation
This is your trend engine. It smooths noise and provides a stable directional backbone.
5. Overall Bias
Definition
A strict agreement filter between Prior Day Bias and VWAP Bias.
Rules
• Bullish (1): Both Prior Day and VWAP are bullish
• Bearish (-1): Both are bearish
• Neutral (0): Any disagreement
Interpretation
This prevents false positives by requiring alignment between two major bias components.
6. Confidence Score
Definition
A weighted blend of all bias components:
• Prior Day (25%)
• VWAP (25%)
• ONH/ONL (20%)
• MTF Structure (30%)
Output
A normalized score between -1.00 and +1.00.
Interpretation
• +1.00: Strong bullish alignment across all systems
• -1.00: Strong bearish alignment
• 0.00: Mixed or unclear conditions
7. Confidence Meter (10 Square Visual)
Definition
A visual representation of the confidence score.
Rules
• 0–10 squares filled based on absolute confidence
• Color reflects direction (green/red/yellow)
Interpretation
A quick glance gauge of trend strength.
8. Debug Mode (Optional)
Purpose
Displays all underlying levels and bias markers directly on the chart.
Includes
• Prior High / Low
• VWAP
• ONH / ONL
• Confidence Score line
• Bias markers (P, V, O, M)
Use Case
Great for verifying logic, backtesting visually, and understanding how each component behaves.
9. Panel Layout & Spacing
Top Left Spacer System
When the panel is placed in the top left corner, a 3 row spacer pushes it below the chart header and indicator dropdown.
Panel Size Options
• Small
• Medium
• Large
These adjust font sizes and meter padding.
______________________________________________________________________________
Summary
The Daily Bias Panel is a compact, multi factor decision tool that blends:
• Prior Day context
• VWAP positioning
• Overnight session dynamics
• Multi timeframe trend structure
• A strict overall bias filter
• A confidence scoring engine
Together, these components give traders a clear, structured view of market direction and strength.
This documentation should serve as a complete reference for understanding, using, and publishing the indicator.

Target Ladder Pro - MTF ATR + HIT ConfirmationTarget Ladder Pro is a volatility-based target framework that plots multi-timeframe ATR-derived upper and lower reference levels on the price chart and can optionally print HIT confirmations when a defined ATR target is reached.
This script is designed to provide structured volatility context (reach zones, range framing, and objective “target reached” tagging). It does not predict price direction, does not guarantee outcomes, and is not intended as a standalone signal generator.
What This Script Displays
1) Multi-Timeframe ATR Target Ladder (1H / 4H / 1D / 1W)
For each enabled timeframe, the script calculates ATR using higher-timeframe data via request.security() (no lookahead), then plots:
Upper level: Base + ATR × Multiplier
Lower level: Base − ATR × Multiplier
The “Base” can be set to:
the current chart price (for immediate relevance), or
the timeframe’s own close (for a strict MTF reference)
Each timeframe’s upper and lower levels are drawn as price-chart lines.
Last-Bar Target Balloons (per timeframe)
On the last bar, the script prints balloon labels for each timeframe’s upper and lower level. Horizontal x-offsets are configurable per timeframe to keep stacked labels readable.
2) ATR Target + Deviation Bands (Context Layer)
A separate ATR target module calculates a single ATR reference level for the current bar based on candle direction (up/down close relative to the prior close). It also optionally plots:
a mean line (moving average), and
up to four standard-deviation bands (mean ± N × deviation)
These bands provide statistical range context around price.
Target / HIT Labels (per bar)
When enabled:
a Target label marks the computed ATR target level
a HIT label appears when price reaches that target on the same bar (high/low touch rule)
An optional filter can require that the ATR target is inside the first deviation band before printing a HIT label, reducing HIT labels during extended conditions.
Label history can be limited to the most recent N labels or allowed to persist (with a safety cap).
How to Use
Enable the timeframes you want to display (e.g., 1H / 4H / 1D / 1W).
Adjust ATR length and multipliers per timeframe to match the asset’s volatility profile.
Choose whether MTF ladder levels are anchored to current price or the timeframe’s own close.
Use the ladder levels as volatility reach reference zones above and below price.
Use Target/HIT labels as objective “condition occurred” markers for review and journaling.
Notes and Limitations
ATR levels are volatility references, not forecasts or guarantees.
Targets may be reached frequently in high-volatility regimes and rarely in compressed markets.
HIT labels indicate that a defined volatility condition occurred; they do not imply reversal or continuation on their own.
This script is provided for informational and educational purposes only and does not constitute financial advice.

Automatic MTF PivotsAutomatic MTF Pivots plots horizontal lines at Daily, Weekly, and Monthly Pivots as well as Support and Resistance Levels. In the Input Panel, you can select which levels to be flagged on the chart as well as their colors.
It can be shown on any timeframes with any symbols and provide reliable support and resistance.
Automatic MTF Pivots can be used in isolation or work with any other trading systems. Especially when combined with the AccuTrade System, it can provide solid R/S Levels to further confirm the signals.

Apex Wallet - MTF Trend Monitor: Unified Indicator DashboardOverview The Apex Wallet MTF Trend Meter is a powerful Multi-Timeframe (MTF) dashboard designed to provide a bird's-eye view of market conditions across several time intervals simultaneously. Instead of switching between charts, this tool presents a clean, real-time table directly on your workspace, allowing you to identify high-probability trade setups through timeframe alignment.
Multi-Layered Analysis The dashboard monitors and categorizes technical data into actionable color-coded cells:
Timeframe Master Trend: Tracks the core market direction using EMA filters (adjustable for Scalping, Day, or Swing trading).
Oscillator Confluence: Instant status of Stochastic (STO), RSI, MACD, and TDI.
Andean Oscillator: Specialized tracking for market states including Bullish, Bearish, Consolidating, or Reversing.
Market Volume Delta: Real-time institutional flow tracking with customizable modes (Buy/Sell, Neutral, or Auto).
Key Features:
Fully Customizable Grid: Toggle individual timeframes (from 1m up to 4h) and specific indicators to match your trading strategy.
Smart Adaptive Presets: One-click selection for Scalping, Day-Trading, or Swing-Trading automatically updates all internal indicator periods for optimized performance.
Trend-Filtered Signals: Momentum indicators are filtered by the master trend EMA to ensure signals are displayed only when aligned with the broader market direction.
Compact UI: Designed for efficiency, the dashboard sits discreetly on your chart while providing maximum data density.
How to Use: Identify "Vertical Confluence" where multiple timeframes align with the same color, indicating a high-conviction trend continuation or breakout.

SOFT Speed & Linearity Strategy (MTF) LIVE & BACKTESTSOFT Speed × Linearity Strategy (MTF – LIVE & BACKTEST)
This strategy detects clean impulsive moves by combining real-time price speed with directional quality (linearity).
It is designed for intraday markets such as Gold (XAUUSD), Nasdaq, and Crypto (ETH, BTC), where acceleration quality matters more than raw indicators.
🔹 Core Concepts
1️⃣ Speed ($ per second)
Measures how fast price is moving
Expressed in $/second, not points or ticks
Two execution modes:
LIVE → real-time intra-candle speed using elapsed seconds
BACKTEST → historical approximation using (Close − Open) / candle duration
2️⃣ Linearity Score (1 → 5)
Evaluates movement quality inside the candle:
Net progress vs adverse excursion
Identifies one-way impulses vs noisy back-and-forth moves
Interpretation
1–2 → choppy / rotational
3 → acceptable
4–5 → clean impulse (higher continuation probability)
🔹 Visual Panel
Histogram bars = Speed × Linearity
Color reflects directional quality
Optional info label displays:
Execution mode (LIVE / BACKTEST)
Analysis timeframe
Linearity score
Direction
Speed ($/s)
No drawings are placed on candles.
🔹 Entry Logic
Configurable conditions:
Minimum linearity score
Minimum speed
Direction aligned with candle movement
Long / Short / Both modes
Optional cooldown between signals
⚠️ Speed thresholds are separated for LIVE and BACKTEST to reflect their different nature.
🔹 Exit Modes (Selectable)
A — Symmetric
Exit when entry conditions are no longer valid.
B — Hysteresis (default)
Exit only after controlled degradation:
Linearity falls below a lower threshold
Or speed drops below a lower threshold
C — Momentum
Exit when speed no longer supports the trade direction (speed ≤ 0).
Optional add-ons:
Exit on opposite signal
Exit on speed channel re-entry
🔹 Multi-Timeframe (MTF)
Default analysis timeframe: 15 minutes
Optional lock to chart timeframe
Safety rule for public use:
If chart timeframe < 15m, analysis remains on 15m
Prevents misleading ultra-fast recalculations
🔹 LIVE vs BACKTEST (Important)
LIVE mode uses true intra-candle acceleration
BACKTEST mode uses an approximation to allow reproducible historical testing
Results between LIVE and BACKTEST are not identical by design
This is intentional and clearly separated.
🔹 Alerts
Available alerts:
BUY
SELL
EXIT
Speed channel breakout
ALL events
Compatible with TradingView webhooks.
🔹 Intended Use
This is not a trend indicator.
This is not a prediction tool.
It is a momentum quality detector, useful to:
Validate breakouts
Filter false accelerations
Trade continuation, not anticipation
⚠️ Disclaimer
This script is for educational and research purposes only.
It does not constitute financial advice.
Always test, adapt parameters to your market, and manage risk.

Linear Regression Channel With Pearson's R (Multi Sigma & MTF)This indicator applies multi‑sigma linear regression across multiple institutional time horizons to quantify the line of best fit in equities and index markets. By combining multi‑timeframe presets with statistically derived deviation bands, it highlights trend structure, volatility expansion, and regime transitions with clarity.
What’s New in This Update
The original version of the indicator produced a linear regression channel with multiple deviation bands. However, the statistical values it displayed were not mathematically valid. The value labeled “r” was not Pearson’s correlation coefficient and could not be used to derive R² or any formal regression diagnostics.
This update introduces a fully correct statistical engine based on ordinary least squares (OLS).
NEW STATISTICAL OUTPUTS
• True Pearson’s r
• True R² (coefficient of determination)
• RSS (Residual Sum of Squares)
• TSS (Total Sum of Squares)
These values are mathematically valid, bounded, and directly tied to the regression line.
KEY IMPROVEMENTS
• Correct OLS intercept (removes the erroneous +slope term)
• Proper predicted values using ŷ = b₀ + b₁x
• Correct centering around the actual mean of the data
• Removal of correlation logic from the deviation engine
• Clean separation between statistical computation and volatility computation
• Regression channel visuals remain identical, but the underlying math is now fully accurate
These changes ensure that r and R² reflect true trend strength and model fit, enabling more reliable interpretation of long‑term and short‑term trend regimes.
CORE FEATURES (UNCHANGED)
• Auto‑Multi‑Timeframe presets aligned with institutional trend horizons
• Multi‑Sigma bands (+/‑1σ, +/‑2σ, +/‑3σ) for volatility structure and statistical extremes
• True least‑squares regression recalculated each bar
• Deviation mode toggle (Standard Deviation vs. Max Deviation)
• Full documentation and institutional use‑case examples available on GitHub
More information can be found here:
github.com

Ripster EMA Clouds with MTFCredits & Origins:
This script is a modification of the widely popular EMA Clouds system originally created by @Ripster47. Full credit goes to him for the strategy and original concept. This version simply adds a quality-of-life feature for traders who use multi-timeframe analysis.
What is this Indicator?
The Ripster EMA Clouds system uses overlapping Exponential Moving Averages (EMAs) to visualize trends, momentum, and dynamic support/resistance zones. The "clouds" differ in color to indicate bullish or bearish trends, acting as a visual guide for keeping you on the right side of the trade.
What is New in This Version? (MTF Capability)
The standard version of this indicator calculates EMAs based on your current chart timeframe. If you switch from a 10-minute chart to a 1-minute chart, the clouds change completely.
I have added a "Fixed Timeframe" variable/input that allows you to "lock" the clouds to a specific timeframe, regardless of what chart you are viewing.
Why is this useful? This allows for true Multi-Timeframe (MTF) scalping.
Example: You can set the clouds to look at the 10-minute trend (identifying major support levels) but execute your entries on a 1-minute chart.
The clouds will remain locked to the 10-minute data, giving you the "big picture" view while you trade the micro-movements.
How to Use
Open the indicator settings.
Go to the Inputs tab.
Find the "Fixed Timeframe" option at the top.
Leave Empty (Default): The indicator behaves exactly like the original (adjusts to your chart).
Select a Timeframe (e.g., 10 Minutes): The clouds will lock to the 10-minute EMAs, even if you switch your chart to 1-minute or 5-seconds.
Note on Visuals When viewing Higher Timeframe (HTF) clouds on a Lower Timeframe (LTF) chart, the clouds will appear to have a "stepped" or "ladder-like" appearance. This is normal and accurate. It represents the single EMA value holding constant for that entire higher-timeframe period. This helps you see the true support level rather than a smoothed, repainted line.

VWAP MTF 5-BandVWAP MTF Suite
Overview
The MTF Institutional VWAP Suite is a high-performance, multi-timeframe analysis tool designed for professional traders who require precise structural anchors. Built on the latest Pine Script v6 engine, this indicator allows for the simultaneous tracking of up to five independent VWAPs, each with its own volatility bands and customizable reset logic.
Unlike standard VWAP indicators that are limited to daily sessions, this suite provides institutional "magnets" across multiple horizons, allowing you to visualize where high-volume participants are positioned on a Daily, Weekly, Monthly, or Intraday basis.
Key Features
5 Independent VWAP Engines: Run up to five unique VWAPs concurrently without chart lag.
Multi-Timeframe Anchoring: Choose from hard-coded institutional pivots: Month, Week, Day, 12-Hour, 4-Hour, and 1-Hour.
Institutional Volatility Bands: Each VWAP includes an optional 1-Standard Deviation band calculated using cumulative variance logic for maximum precision.
Advanced UI Controls: Granular toggles for each instance allow you to display only the center line, only the bands, or the full shaded "value area" for any specific timeframe.
Modern Pine v6 Architecture: Utilizes the latest 2026 Pine Script optimizations, including method chaining and global-scope plot execution for a bug-free experience.
How to Use
Identify Value Clusters: When multiple VWAPs (e.g., Daily and Weekly) converge at a single price point, it creates a high-probability "Institutional Pivot" zone.
Mean Reversion: Use the 1-Standard Deviation bands to identify overextended price action. Institutional algorithms often mean-revert toward the VWAP when price reaches the exterior bands in a low-volatility environment.
Trend Confirmation: Use the slope and position of the 4-Hour or Daily VWAP to determine intraday bias. Trading above a rising VWAP confirms a "Long Gamma" or bullish trend.
Settings
Anchor Selection: Defines the starting point of the volume-weighted calculation.
Bands & Fill Toggles: Quickly clean up your chart by hiding the volatility bands or the background shading for specific timeframes.
Visual Customization: Full control over center line colors, global band colors, and label offsets to prevent text overlap on the right-hand scale.
Developer Notes
This script was optimized for the 2026 TradingView environment. It uses a custom variance-tracking function rather than the basic built-in ta.vwap to ensure that standard deviation bands remain mathematically accurate even when crossing multiple sessions or weekend gaps.
