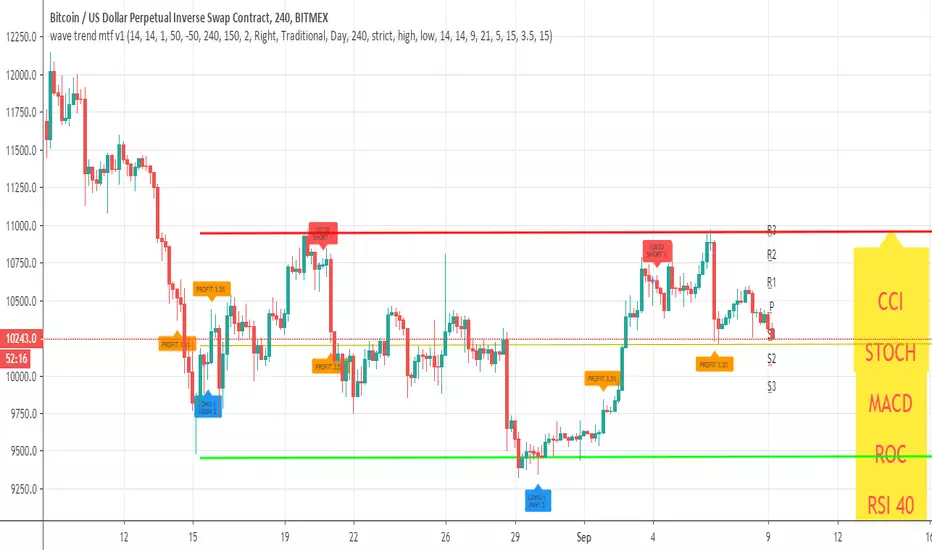
wave trend mtf v1This Lazy Bear wave trend in MTF version with take profit and stop loss rebuy
you can change the MTF using the security call
and many nice option to see insid3e
so you can play with it, modify it or make it better
Cari dalam skrip untuk "mtf"
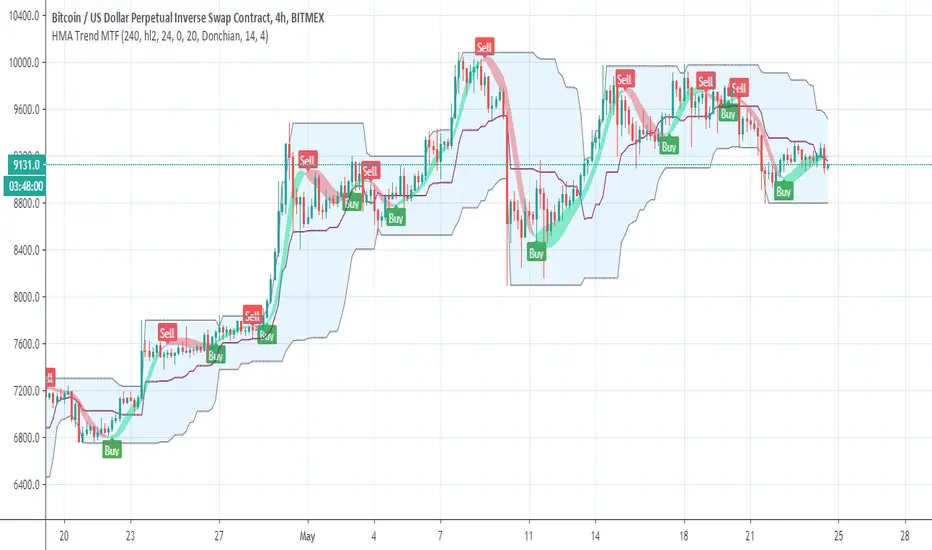
Hull Trend MTFhull trend taken from
So add MTF function and alert for the buy and sell (in the MTF shift set to 0 , if repaint then set shift to 1)
the blue line is linear regression trend
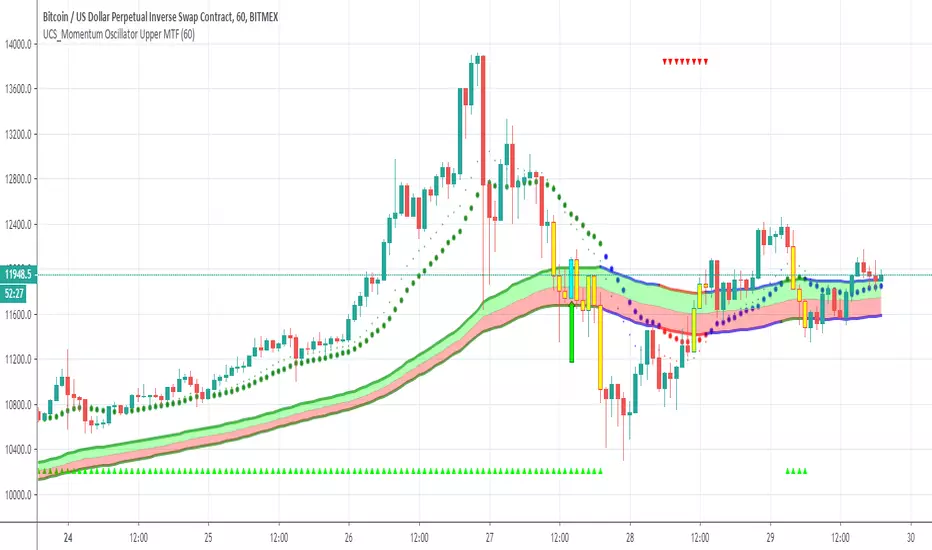
UCS_Momentum Oscillator Upper MTFby request of a freind I just made him this famous oscilator of chris mody in MTF format
so it a sling shot and MTF
HullDEMA MTFThis indicator based on non repaint HULL 720 min and dema MTF
i suugest to keep the Dema MTF on the time frame of your graph
using the HULL 720 min we can see how the signal of DEMA and the crossing of the hull 720 either by DEMA or by the candels
this enable us to detect trends more easy

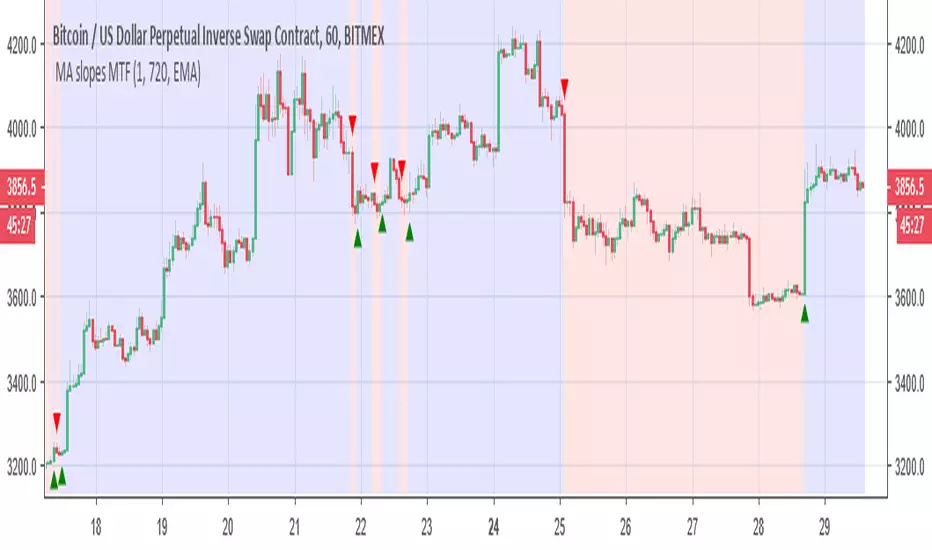
MA slopes MTF this is the original script. its nice as I love slopes of different MA
add MTF +colors of bullish and bearish
add alerts and signals
This can be a very good base indicator if one want to add extra things to it to make it better
or can used as a good filter
here on 15 min 1000min MTF
VPT and Heiken Ashi Candles MTFThe volume price trend indicator is used to determine the balance between a security’s demand and supply. The percentage change in the share price trend shows the relative supply or demand of a particular security, while volume indicates the force behind the trend. The VPT indicator is similar to the on-balance volume (OBV) indicator in that it measures cumulative volume and provides traders with information about a security’s money flow
So we put the VPT and add HA candles with non repainting MTF , the crossing up or down of the VPT over candles create the signals
since VPT tend to overshoot you can smooth it with Leni..(just give the smoothing of the length this stupid name:) )
alerts inside
just example of play with MTF and the smooth of VPT
DEMA-MTF with alerts This model based on DEMA with non repainting MTF
if you want to change the MTF use int2
buy and sell show in triangke signals
alerts included
you can smooth the signal with len1 if needed

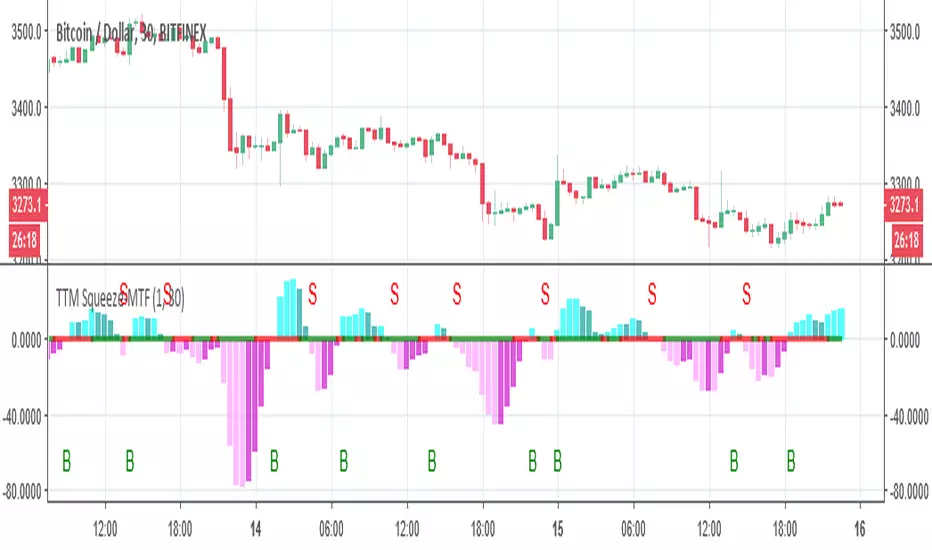
TTM Squeeze-MTFthe script based on
I just change it to be non repainting MTF and add signals
you can change the MTF by changing int2
Heiken Ashi Candles MTFThis script allow you to get the HA candles in different MTF settings (MTF calculated as length not as time) . since we do not use security fuction we do not have repaint issue
Use the int2 to change the time frame
Up/Down Range Momentum MTFSo using the script of
and adding non repainting MTF function to it we create this momentum model
You can enter either at cross of blue line or at cross of 0 and vice versa at red line.
since it has MTF function you can look it on different time frames just set int 2 to the TF of your desire

RCI3Short MTFFor RCI lover.
We are facing a timeout problem on smart phone apps of TV.
It looks like a staircase, but It frees us from timeout problems.
default MTF: 60 / 120 / 240
MTF line as middle/long lines
MA Study: Different Types and More [NeoButane]A study of moving averages that utilizes different tricks I've learned to optimize them. Included is Bollinger Bands, Guppy (GMMA) and Super Guppy.
The method used to make it MtF should be more precise and smoother than regular MtF methods that use the security function. For intraday timeframes, each number represents each hour, with 24 equal to 1 day. For daily, 3 is 3 day, for weekly, 4 is the 4 weekly, etc. If you're on a higher timeframe than the one selected, the length will not change.
Log-space is used to make calculations work on many cryptos. The rules for color changing Guppy is changed to make it not as choppy on MAs other than EMA. Note that length does not affect SWMA and VWAP and source does not affect VWAP.
A short summary of each moving average can be found here: medium.com
List of included MAs:
ALMA: Arnaud Legoux
Double EMA
EMA: Exponential
Hull MA
KAMA: Kaufman Adaptive
Linear Regression Curve
LSMA: Least Squares
SMA: Simple
SMMA/RMA: Smoothed/Running
SWMA: Symm. Weighted
TMA: Triangular
Triple EMA
VWMA: Volume Weighted
WMA: Weighted
ZLEMA: Zero Lag
VWAP: Vol Weighted Average
Welles Wilder MA

ADX-DI MTF trend indication - JD version 2Version 2 added support for MTF, to see the trend direction on the lower or higher timeframe.
As an example to see the difference, the indicator is added three times, one time for the current TF, one set at the higher and one at the lower TF.
Cudo's to Chris Moody for the MTF-switching-code!!
JD.

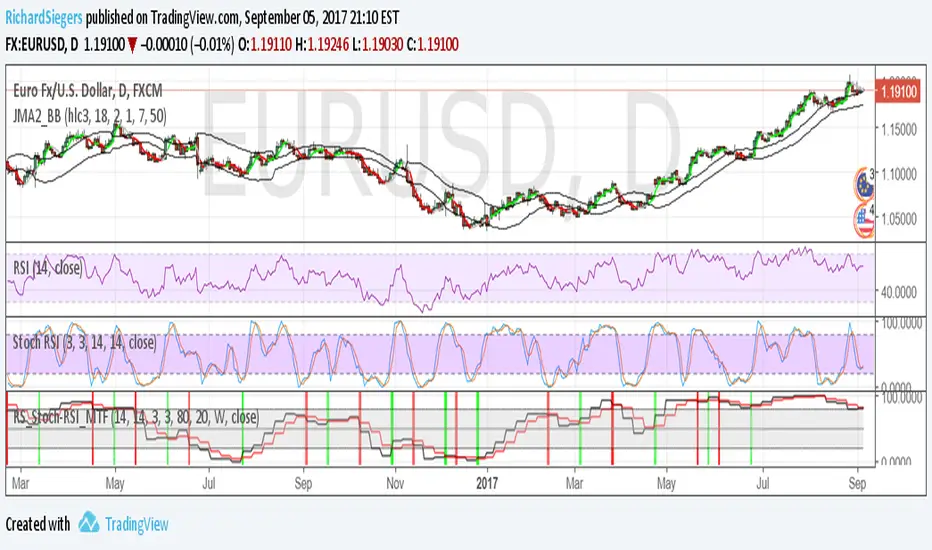
RS_Stoch-RSI_MTFmodification by Richard Siegers that turned stochastic mtf from ChrisMoody into stochastic-rsi mtf
B3 Bar Cycle MTF (fix)Apologies, there was an error in printing for the thick gray boxes, happened when MTF was switched on. All better, and here is the details from before:
This is an interesting study that can be used as a tool for determining trend direction, and also could be a trailing stop setter. I use it as a gauge on MTF settings. If on, you can look at the bar cycle of the 1h while on the 15m giving you a lot of information in one tool. If a line is missing high or low, it is because it was broken, if both exist you are trading in range and cloud appears. If both sides break you get thick gray boxes above and below bar.
Get used to editing the inputs to suit your liking. Often 3-5 length and always looking at different resolutions to get a big picture story. You could put multiple instances of the study up to see them simultaneously. I based the idea off of Krausz's 3 day cycle which you can read about in his teachings. I tend to find it looking better using Heikin Ashi bar-style.

True Strength Indicator MTFHere is an example of a script showing a multi-time frame of TSI.
Chart below compares FX EURUSD Daily TSI to 1H TSI
Here is an updated version
study("True Strength Indicator MTF", shorttitle="TSI MTF")
resCustom = input(title="Timeframe", type=resolution, defval="60" )
long = input(title="Long Length", type=integer, defval=25)
short = input(title="Short Length", type=integer, defval=13)
signal = input(title="Signal Length", type=integer, defval=13)
price = close
double_smooth(src, long, short) =>
fist_smooth = ema(src, long)
ema(fist_smooth, short)
pc = change(price)
double_smoothed_pc = double_smooth(pc, long, short)
double_smoothed_abs_pc = double_smooth(abs(pc), long, short)
tsi_value = 100 * (double_smoothed_pc / double_smoothed_abs_pc)
tsi = security(tickerid, resCustom,tsi_value)
plot(tsi, color=black)
plot(ema(tsi, signal), color=red)
hline(0, title="Zero")

CRT Master 974 par GUIROA Stephane [ULTIMATE MTF + HTF SWEEP]"CRT Master Blueprint ". This indicator is designed to display multi-timeframe levels from user-defined timeframes and highlight certain trading signals within a specified session.
Multi-Timeframe Configuration
1.Input Timeframes: Users can input three separate timeframes (e.g., 30 minutes, 60 minutes, 240 minutes).Each timeframe is assigned an option to be displayed or hidden, along with a customizable color.
2.Display Options: Each timeframe can be toggled on or off, with corresponding colors set in the input parameters.
Level Retrieval Function
3.Getting Levels: The get_crt_levels function retrieves high, low, and close values from the previous bar of a specified timeframe.pinescript
Drawing Levels
4.Drawing Levels Function: The draw_levels function visuals the high, low, and mid levels with different styles (dashed and dotted lines) and labels on the chart based on whether the respective timeframes' options are enabled.
6.Dashboard: A small table displays the status of the indicator (active or inactive) and the primary timeframe on the chart.
Summary
In summary, this indicator is helpful for traders who want to visually analyze multiple timeframe levels and receive signals based on specific price action within a defined session. The use of customizable parameters allows for flexibility in adapting to different trading strategies or preferences.

Support and Resistance Levels with Breaks (MTF + Alerts FIXED) Support and Resistance Levels with Breaks
Added MTF and FIXED Alarm for Support and Resistance line

Robert Miner DTOsc MTF - v6Below is the implementation of the MTF Momentum (DTOsc) with Miner's specific Buy Stop / Sell Stop entry logic. This ensures you only enter when the market breaks the high/low of the signal bar, confirming the reversal.

Weekly Regime Filter - Trend + Momentum + Structure (MTF)A multi-timeframe weekly regime indicator that classifies market conditions into BULL , BEAR , or CHOP using three components: trend, momentum, and market structure.
Works on any timeframe while always referencing weekly data — no repainting.
━━━━━━━━━━━━━━━━━━━━━━━━━━━━━━
🎯 WHAT IT DOES
Answers one question: What is the weekly regime?
• Trend — EMA hierarchy (Price > EMA Fast > EMA Slow)
• Momentum — DI+ vs DI- with optional ADX filter
• Structure — Break of Structure (BOS) and Change of Character (CHOCH)
BULL = All three bullish
BEAR = All three bearish
CHOP = Mixed signals
━━━━━━━━━━━━━━━━━━━━━━━━━━━━━━
⚡ KEY FEATURES
• Multi-Timeframe (MTF) — View on 1H, 4H, Daily; regime stays consistent
• Auto-Detect Asset Type — Automatically applies optimized settings for Crypto, Stocks, Forex, Gold, Silver, Oil, Commodities
• BOS/CHOCH Labels — Visual market structure breaks on chart
• Live Status Panel — Shows regime, components, and active parameters
• Non-Repainting — Uses confirmed weekly closes only
━━━━━━━━━━━━━━━━━━━━━━━━━━━━━━
📊 ASSET PRESETS
• Crypto — EMA 50/200, ADX Off, Pivot 2
• Stocks/Indices — EMA 50/200, ADX >20, Pivot 3
• Forex — EMA 30/100, ADX >25, Pivot 2
• Gold — EMA 40/150, ADX >20, Pivot 3
• Silver — EMA 40/150, ADX >22, Pivot 3
• Oil — EMA 30/100, ADX >25, Pivot 2
• Commodities — EMA 40/120, ADX >20, Pivot 3
Select "Custom" to use your own values.
━━━━━━━━━━━━━━━━━━━━━━━━━━━━━━
📈 HOW TO USE
For Swing Trading:
• Set chart to Daily
• Use Auto-Detect or select preset
• Long only when BULL, short only when BEAR
• Reduce size or avoid when CHOP
Structure Signals:
• CHOCH ↑ after bear regime = Early reversal signal
• CHOCH ↓ after bull regime = Tighten stops
• BOS in regime direction = Trend continuation
━━━━━━━━━━━━━━━━━━━━━━━━━━━━━━
🔔 ALERTS
• Regime → BULL
• Regime → BEAR
• CHOCH → Bull
• CHOCH → Bear
━━━━━━━━━━━━━━━━━━━━━━━━━━━━━━
⚙️ SETTINGS
Preset: Auto-Detect, Crypto, Stocks, Forex, Gold, Silver, Oil, Commodities, Custom
Custom Settings (when Custom selected):
• EMA Fast/Slow lengths
• ADX Length & Threshold
• ADX Filter toggle
• Pivot Left/Right
Display:
• Plot Weekly EMAs
• Show BOS/CHOCH Labels
• Show Regime Background
• Background Opacity
• Show Status Label
━━━━━━━━━━━━━━━━━━━━━━━━━━━━━━
📝 NOTES
• Needs ~200 weeks of history for full calculation
• Weekly signals are slower by design — filters noise
• Not a standalone system — combine with entries and risk management
• When using presets, Custom input fields won't visually update (Pine limitation) — status label shows actual values

VDUB Bands - MTF WMA+ATR Volatility Lanes (6 Alerts)VDUB Bands draws volatility-scaled “trend lanes” around a Weighted Moving Average (WMA) using ATR (or a WMA of True Range). It can display up to four tiers (L1–L4), with higher tiers sourced from higher timeframes to show local structure → higher-timeframe structure on a single chart.
────────────────────────────────────────
1. What it does (plain English)
────────────────────────────────────────
Think of each tier as a lane system around the trend:
• Inner rails = “normal volatility lane” around the WMA
• Outer rails = “extension / extreme zone” for that tier
• Higher tiers (L3/L4) show bigger structure
• Lower tiers (L1/L2) show active lane behavior
Typical interpretation:
• Price inside inner rails → normal variance around the trend lane
• Between inner and outer → stretched, but not extreme
• Outside outer rails → extended vs that tier’s volatility band
────────────────────────────────────────
2) Why it’s useful (and why it’s not a mashup)
────────────────────────────────────────
This is not a bundle of unrelated indicators. Everything serves one cohesive purpose:
• Visualize trend + volatility lanes across multiple time horizons
• Keep rails consistent and readable (levels, fills, outlines)
• Optional multi-timeframe aggregation for structure context
• A compact 6-alert set to catch key transitions without alert spam
────────────────────────────────────────
3) What you see on the chart
────────────────────────────────────────
For each level (L1–L4), you can show:
• Upper/Lower Inner rails
• Upper/Lower Outer rails
• Optional center fill (between outer rails) = operating range
• Optional MA line per tier (off by default to reduce clutter)
• Base WMA line (L1 MA) if enabled
Suggested workflow:
• Start with L1 + L2 only
• Add L3/L4 once you like the structure view
• Use Dynamic Opacity if the chart feels crowded
────────────────────────────────────────
4) How it works (transparent formula)
────────────────────────────────────────
For each tier:
• MA = WMA(source, baseLen × levelMultiplier)
• ATR_like = Wilder ATR (default)
OR WMA(TrueRange, atrLen × levelMultiplier)
Inner rails:
• upperInner = MA + ATR_like × innerMult
• lowerInner = MA - ATR_like × innerMult
Outer rails:
• upperOuter = MA + ATR_like × outerMult
• lowerOuter = MA - ATR_like × outerMult
Tier behavior:
• L1 uses the chart timeframe
• L2–L4 can use user-selected HTFs (defaults: 4H / D / W)
or optional auto-selection
────────────────────────────────────────
5) Multi-timeframe behavior + interpolation
────────────────────────────────────────
• L2–L4 use request.security() with lookahead OFF (no future data).
• HTF bands naturally “step” when the HTF candle confirms.
• Interpolate HTF Bands (optional): visually blends from the prior confirmed HTF value to the current confirmed HTF value to reduce stepping. This is display smoothing, not prediction.
Repaint note:
• If Live Interp (Repaints) is enabled, the HTF lines can update intrabar and may repaint. Keep it OFF for strict non-repainting behavior.
────────────────────────────────────────
6) Auto-select L2/L3/L4 (optional)
────────────────────────────────────────
Two modes:
A) Ladder (deterministic)
• Picks “bigger” timeframes relative to the chart (simple and fast).
B) Score (data-driven)
• Tests candidate timeframes and scores them using:
• Coverage: % of closes inside the OUTER band over Score Lookback
• Width: average outer-band width as a fraction of MA
• Targets: Target Coverage + Target Width
• Weights: Coverage Weight + Width Weight
Performance notes:
• Score mode is heavier (many candidates).
• “Lock auto-select after first pick” is recommended to reduce load and avoid platform limits.
────────────────────────────────────────
7) Alerts (6 total, aggregated across L1–L4)
────────────────────────────────────────
Alerts trigger if ANY tier meets the condition:
• Cross ABOVE an OUTER band
• Cross BELOW an OUTER band
• Cross ABOVE an INNER band
• Cross BELOW an INNER band
• Price is OUTSIDE ABOVE an OUTER band
• Price is OUTSIDE BELOW an OUTER band
These are intentionally aggregated to keep the alert count small while catching meaningful transitions.
────────────────────────────────────────
8) Limitations & transparency
────────────────────────────────────────
• Indicator only (not a strategy). No performance claims.
• MTF values update when the higher timeframe candle confirms.
• Interpolation is visual smoothing; it does not forecast.
• Non-standard chart types (Heikin Ashi/Renko/etc) may behave differently from standard candles.
• If you enable repainting options, signals/levels may change intrabar.
────────────────────────────────────────
9) Credits/reuse disclosure
────────────────────────────────────────
• Conceptual inspiration: VDUB and the community “VDUB_BINARY_PRO_3_V2” idea of WMA ± TR/ATR × multipliers.
• This version is a reimplementation + extension, adding:
o Multi-tier architecture (L1–L4)
o Higher-timeframe sourcing + optional interpolation
o Optional scoring-based timeframe selection
o Dynamic opacity + streamlined plotting
o Aggregated 6-alert set
No code was copied directly from the older script; this is a rewritten implementation with additional features and different structure.
www.tradingview.com

Auto Fibo Pivot [Ultimate MTF]Stocks: Locks lines during market hours (09:00-15:30) and switches to "Preview Mode" (Next Day) after market close.
Forex/Crypto: Always Fixed Mode (24h).
Multi-Timeframe (MTF): Select between Auto Daily, Weekly, Monthly, or Yearly pivots.
Fully Customizable: Easily change Fibonacci ratios and colors in the settings.
No Repaint: Stable lines on 1-minute charts.
自動判別・マルチタイムフレーム対応のフィボナッチピボット
株・為替を自動判別し、最適なモードで動作する実戦向けインジケーターです。
主な機能:
自動判別機能:
日本株: ザラ場中はラインを完全固定。15:30以降は自動で「明日の予習モード」に切り替わります。
為替・仮想通貨: 24時間常時固定モードで動作します。

LiquidityPulse MTF Intrabar Micro-Structure Absorption DetectorLiquidityPulse MTF Intrabar Micro-Structure Absorption Detector
Non-repainting: Markers appear on bar close and do not change.
Important (if you can’t see any markers)
This indicator measures intrabar micro-structure and it can use seconds-based micro data on lower timeframes.
If you load it and don’t see anything:
Go to 15m or higher, or
In settings, change Micro feed (inside HTF bar) from Auto to 1m / 5m / 15m.
Auto will often choose a “micro” feed that’s very small when your HTF is small, which can affect what you see.
What this indicator does
This script is designed to highlight absorption-like conditions by analysing what happens inside each higher-timeframe (HTF) candle — not just the candle’s OHLC.
It looks for candles where:
price moves a lot internally (high intrabar activity),
the candle structure shows churn / rejection (wick dominates body),
and participation is elevated (relative high volume).
When those conditions align, the indicator prints a marker line at the wick extreme:
LW (Lower-wick marker) = printed at the candle’s low
UW (Upper-wick marker) = printed at the candle’s high
Each marker is then extended to the right (so it can be treated like a potential level).
Image shows a wick-dominant candle with an absorption marker: Markers appear when price shows strong intrabar movement, a wick-dominant candle structure, and elevated participation — a combination often associated with absorption-like behaviour.
How it works
A marker is created only when all three filters pass on a confirmed candle close:
1) Intrabar micro-speed (internal activity)
The script pulls intrabar closes from a lower timeframe (“micro feed”) and sums the absolute internal price changes inside the HTF candle.
It then converts this to a Z-score and checks it against the Speed-z threshold.
Higher threshold = fewer, stronger events.
2) Wick vs body (churn / rejection structure)
This measures how the HTF candle’s internal range compares to its net close-to-open movement using:
Churn ratio = (HTF range) / (HTF body)
If the candle has a large range but a relatively small body, it indicates that price moved extensively during the candle but made limited net progress by the close — a structure often associated with active two-sided participation and absorption-like behaviour.
3) Relative HTF volume (participation filter)
The script also Z-scores HTF volume and requires it to exceed the Volume z-score threshold.
This helps filter out candles that show apparent activity but occur on relatively low participation.
Multi-timeframe + micro-structure analysis: Image shows a 15 minute chart marker on the 1 minute timeframe. The indicator can analyse higher-timeframe candles (15 minute) while using lower-timeframe micro data inside each bar (1 minute). This allows absorption-style markers to be plotted with higher-timeframe context and intrabar detail.
Composite Intensity
When a marker triggers, the script calculates a Composite Intensity number (CI):
It’s a combined score based on how strongly each of the three conditions exceeded its threshold.
Higher CI = stronger absorption-style event
Higher CI = brighter chart marker
The table shows:
HTF and Micro timeframes being used
the last marker type (LW or UW)
the last CI value
Micro feed & multi-timeframe behaviour
This indicator always works as a two-layer system:
HTF candle (context) → the candle you’re analysing
Micro feed (inside HTF bar) → the intrabar data used to measure micro-speed
Higher-TF source
Chart timeframe = uses your chart timeframe as HTF
Manual = choose any HTF (example: chart = 1m, HTF = 15m → prints 15m absorption markers onto a 1m chart)
Micro feed options
Auto (recommended) picks a sensible micro feed based on HTF
Or choose 1s / 1m / 5m / 15m manually for performance/clarity
HTF direction filter (optional)
When enabled:
LW markers only print when the HTF candle closes bullish
UW markers only print when the HTF candle closes bearish
This is optional and is designed to reduce noise by aligning markers with the directional bias of the higher-timeframe candle.
Traders can use the absorption markers to:
Identify potential areas of interest where price showed unusually high intrabar activity but limited net progress by the close.
Mark reference levels where price may react again later, reflecting prior elevated participation and extensive intrabar movement areas.
Add structural context to existing analysis such as trend structure, support/resistance, session highs/lows, or other volume-based tools.
Compare behaviour across timeframes, by observing how absorption-style events on a higher timeframe align with lower-timeframe price action.
Image shows price reacting to a previous absorption markers level (Lines/ levels can be extended in the settings): Extended LW / UW markers can be observed as areas of prior absorption-like activity. Traders may watch how price behaves around these levels (reaction, acceptance, or rejection) alongside their own structure, liquidity, or risk management tools.
Key settings (what they change)
Higher-TF source / Higher-TF bar (manual): which candle timeframe is analysed
Micro feed (inside HTF bar): what intrabar resolution is used to calculate micro-speed
Speed-z threshold: how unusual intrabar activity must be
Wick/Body threshold: how large the candle’s total range must be compared to its body
Volume z-score threshold: how elevated HTF volume must be
Z-score look-back: how far back the indicator normalises speed/volume
Line extension (bars): raise if you want markers to behave more like extended levels
Max markers: how many markers remain on the chart at once
Alerts
Alerts trigger on candle close when an absorption marker is detected.
Disclaimer
This indicator does not measure true order flow or the full limit order book. It uses intrabar price activity, candle structure, and relative participation as interpretive tools to highlight absorption-like behaviour. It is not a buy/sell system, and all signals should be used with traders own confirmation and risk management.
