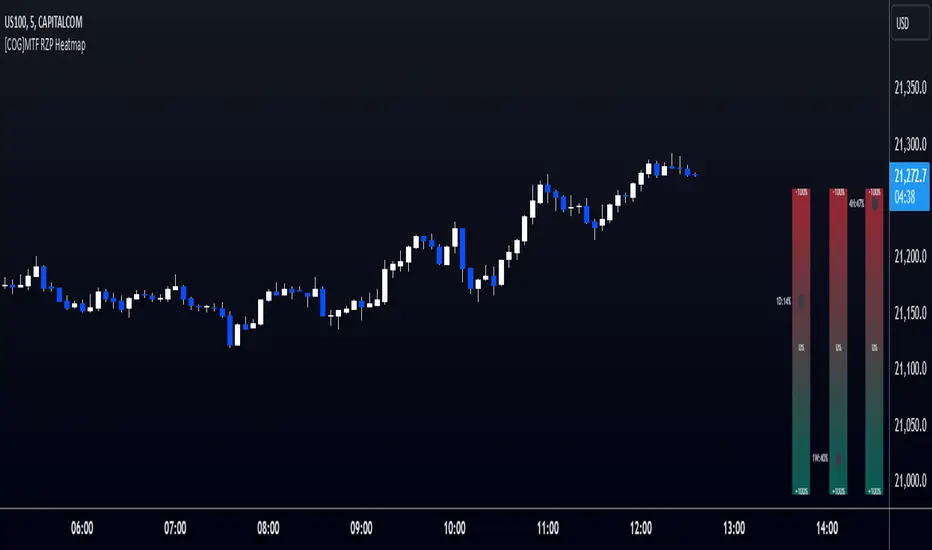
[COG]MTF RZP Heatmap MTF RZP Heatmap (Range Zone Pulse)
What It Does
This indicator creates three visual heatmaps that show how current price movement compares to the average range of different timeframes. It helps traders:
Identify when price moves are overextended
Compare momentum across different timeframes
Spot potential reversal points
Understand the relative strength of price movements
How It Works
Range Calculation:
For each selected timeframe, it calculates an average range based on the specified number of periods
The range is measured from high to low for each period
A moving average of these ranges creates a dynamic "normal" range for that timeframe
Position Calculation:
Measures how far price has moved from the period's opening price
Compares this movement to the average range
Converts the movement into a percentage (-100% to +100%)
Visual Display:
Shows three vertical heatmaps, one for each timeframe
Colors graduate from bearish (typically red) to bullish (typically green)
A dot indicator shows the current position within each range
Percentage labels show exact movement relative to average range
Trading Applications
Trend Trading:
Multiple timeframes aligned in the same color suggest strong trend
Use larger timeframes (Daily/Weekly) for trend direction
Use smaller timeframes (4H/1H) for entry timing
Mean Reversion:
Extreme readings (near +100% or -100%) suggest overextended moves
Look for divergences between timeframes
Use when shorter timeframes show extremes but larger timeframes don't
Volatility Trading:
Compare current moves to average ranges
Identify when markets are more volatile than usual
Adjust position sizes based on range expansion/contraction
Multi-Timeframe Analysis:
Compare price action across different time horizons
Identify conflicting signals between timeframes
Use for timeframe alignment in trading decisions
Best Practices for Usage
Timeframe Selection:
Set the first timeframe to your trading timeframe
Set the second timeframe to your trend timeframe
Set the third timeframe to your entry timeframe
Range Period Settings:
Default is 5 periods
Increase for more stable readings
Decrease for more responsive readings
Color Interpretation:
Darker colors indicate stronger moves
Look for alignment across timeframes
Watch for extremes in any timeframe
Trading Setups:
Wait for alignment in multiple timeframes
Use extreme readings for counter-trend trades
Combine with other indicators for confirmation
Cari dalam skrip untuk "mtf"
Fibonacci Cloud MTF [TrendX_]The Fibonacci Cloud MTF Indicator is an innovative trading tool crafted to assist traders in dynamically identifying key Fibonacci retracement levels. Unlike traditional methods that depend on static pivot points, this indicator effectively plots the Fibonacci golden zone - ranging from 0.382 to 0.618 - using the most recent highs and lows. This dynamic approach provides a more nuanced and responsive analysis of price movements, allowing traders to observe real-time reactions to significant Fibonacci levels. Furthermore, the indicator functions as a trend-following mechanism, signaling potential uptrends when the price crosses above the 0.618 fibonacci retracement level and indicating downtrends when it dips below.
💎 KEY FEATURES
Dynamic Fibonacci Levels: The indicator calculates Fibonacci retracement levels based on the latest highs and lows, providing a more relevant framework for current market conditions.
Golden Zone Focus: It emphasizes the Fibonacci golden zone (0.382 - 0.618), which is widely regarded as a critical area for potential reversals or continuations.
Multi-timeframe Analysis: The ability to view Fibonacci levels across multiple timeframes allows traders to identify trends and potential entry points more effectively.
Trend-Following Signals: Clear trend directions relative to the 0.618 level.
⚙️ USAGES
Identifying Key Retracement Levels: Traders can use the plotted Fibonacci levels to determine potential pullback or throwback at the key Fibonacci areas.
Trend Confirmation: By observing price interactions with the 0.618 level, traders can confirm ongoing trends and make more informed decisions about entering or exiting positions.
Multi-timeframe Strategies: The indicator allows traders to align strategies across different timeframes, improving overall trading effectiveness.
🔎 BREAKDOWN
Dynamic Fibonacci Levels: By calculating Fibonacci retracement levels from the latest highs and lows, traders receive a more accurate representation of current market sentiment. This dynamic approach ensures that the levels adapt to changing market conditions, making them more relevant for decision-making.
Golden Zone Focus: This highlights the Fibonacci golden zone, particularly the range between 0.382 and 0.618. This zone is widely regarded as a pivotal area for potential price reversals or continuations, serving as key support and resistance levels. Prices often react strongly at these points, making them crucial for pinpointing potential entry and exit opportunities in your trading strategy.
Multi-timeframe Analysis: Incorporating multi-timeframe analysis allows traders to observe how Fibonacci levels behave across different timeframes. This feature helps traders identify broader trends while also pinpointing short-term opportunities.
Trend-Following Strategies: Uptrend trigger - When the price crosses above the 0.618 level, it triggers uptrend, conversely, when the price crosses below the 0.618 level, it triggers a downtrend.
DISCLAIMER
This indicator is not financial advice, it can only help traders make better decisions. There are many factors and uncertainties that can affect the outcome of any endeavor, and no one can guarantee or predict with certainty what will occur. Therefore, one should always exercise caution and judgment when making decisions based on past performance.

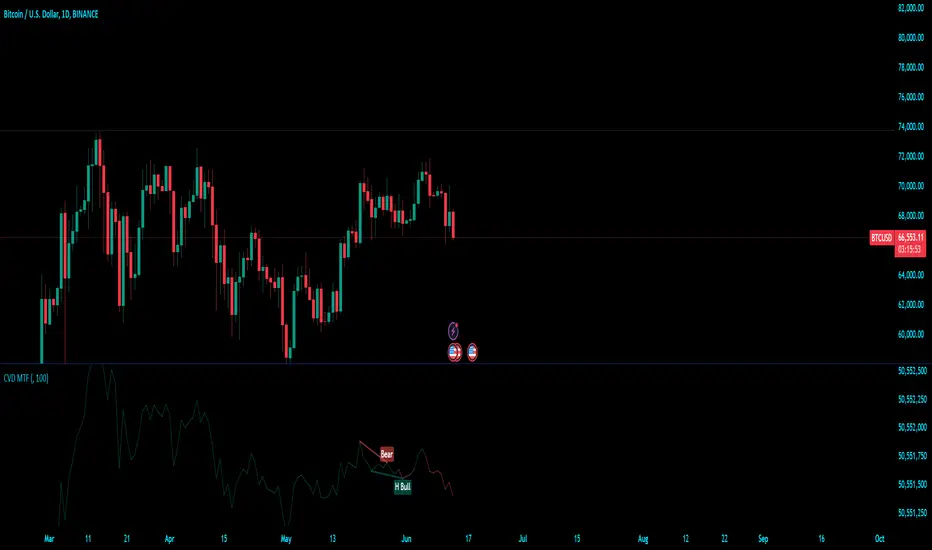
Cumulative Volume Delta (MTF)Cumulative Volume Delta (CVD) Indicator
The Cumulative Volume Delta (CVD) indicator is a powerful analytical tool used to understand the behavior and dynamics of market participants through volume analysis. It tracks the net difference between buying and selling pressure, providing insights into market trends and potential reversals. Here's a detailed description of this indicator and its components:
The Cumulative Volume Delta (CVD) indicator calculates the cumulative net difference between buying and selling volume over a specified period. By analyzing this net difference, traders can gain insights into the underlying strength or weakness of a price movement, helping to identify trends, reversals, and potential breakout points.
Key Components:
Bull & Bear Power Calculation:
Bull Power: Represents the strength of buyers in the market. It is calculated based on the relationship between the current and previous price bars. A higher Bull Power indicates stronger buying pressure.
Bear Power: Represents the strength of sellers in the market. It is also calculated based on the relationship between the current and previous price bars. A higher Bear Power indicates stronger selling pressure.
Bull & Bear Volume Calculation:
Bull Volume: The volume attributed to buying pressure. It is calculated by taking the proportion of Bull Power relative to the total of Bull Power and Bear Power, multiplied by the total volume.
Bear Volume: The volume attributed to selling pressure. It is calculated similarly to Bull Volume but using Bear Power.
Delta Calculation:
Delta: The net difference between Bull Volume and Bear Volume for each bar. A positive Delta indicates more buying pressure, while a negative Delta indicates more selling pressure.
Cumulative Volume Delta (CVD):
CVD: The running total of the Delta values over time. It accumulates the net buying and selling pressure to provide a visual representation of the market's cumulative sentiment.
Moving Average of CVD (CVD MA):
CVD MA: A simple moving average of the CVD, used to smooth out fluctuations and help identify the overall trend. It provides a baseline to compare the current CVD value against, highlighting divergences or convergences.
Multi-Timeframe Functionality:
The enhanced version of the CVD indicator includes multi-timeframe (MTF) capabilities, allowing users to select and analyze data from different timeframes. This feature enhances the versatility of the indicator by providing a broader perspective on market dynamics across various time intervals.
Practical Applications:
Trend Identification: By tracking the CVD and its moving average, traders can identify the prevailing trend. An upward-sloping CVD indicates sustained buying pressure, while a downward-sloping CVD indicates sustained selling pressure.
Divergences: Divergences between the CVD and price can signal potential reversals. For example, if the price is making new highs but the CVD is not, it may indicate weakening buying pressure and a potential reversal.
Breakout Confirmation: Significant changes in the CVD can confirm breakouts. A sharp increase in the CVD during a price breakout indicates strong buying support, adding confidence to the breakout.
Support and Resistance Levels: The CVD can help identify significant support and resistance levels based on changes in volume dynamics. For instance, a notable increase in buying volume at a support level can reinforce its strength.
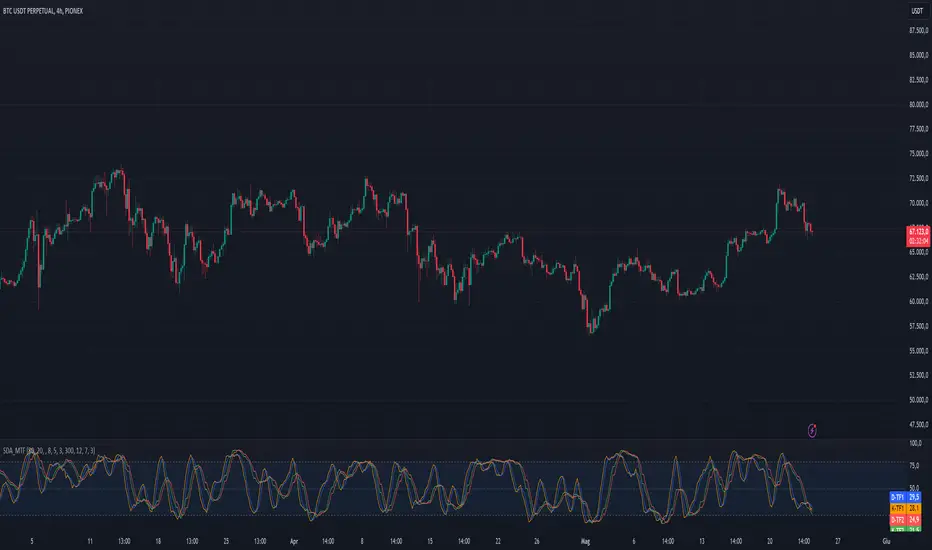
Stoch Double Analysis MTFThis indicator utilizes the Stochastic Oscillator on two different timeframes and generates alerts for potential long and short conditions based on the crossovers of the %K and %D lines of the Stochastic Oscillator. Here's a detailed breakdown of the code:
Inputs
Overbought and Oversold Levels:
ob_stc: Overbought level (default 80).
os_stc: Oversold level (default 20).
Timeframe 1 Configuration:
tf_stoch_1: The first timeframe for analysis.
length: Stochastic length (default 8).
smoothK: Smoothing for %K line (default 5).
smoothD: Smoothing for %D line (default 3).
Timeframe 2 Configuration:
tf_stoch_2: The second timeframe for analysis.
length_another: Stochastic length for the second timeframe (default 12).
smoothK_another: Smoothing for %K line for the second timeframe (default 7).
smoothD_another: Smoothing for %D line for the second timeframe (default 3).
Calculations
Volume Trend Calculation:
For both timeframes, the script calculates the volume trend. It determines up days and down days based on whether the closing price is higher or lower than the opening price and accumulates the volume accordingly.
Cumulative Volume:
Calculates the cumulative volume for up days and down days using the average of the high prices and the respective volumes.
Stochastic Oscillator Calculation:
Computes the %K and %D lines of the Stochastic Oscillator for both timeframes using the given lengths and smoothing factors.
Alerts
The script generates alerts for potential long and short conditions based on the crossovers of the %K and %D lines for both timeframes:
Long Condition: When %K crosses above %D.
Short Condition: When %D crosses above %K.
Plotting
Stochastic Lines:
Plots the %K and %D lines for both timeframes with different colors (orange and blue for the first timeframe, green and red for the second timeframe).
Overbought/Oversold Bands:
Adds horizontal lines at the overbought and oversold levels and a middle band at 50.
Fills the background between the overbought and oversold levels with a semi-transparent color.
Code Structure
Inputs Definition:
Defines all input variables for customization.
Volume Trend and Cumulative Volume Calculation:
Computes volume trends and cumulative volumes for both timeframes.
Stochastic Oscillator Calculation:
Calculates the %K and %D lines using the request.security function to get data from the specified timeframes and apply the smoothing functions.
Alert Conditions:
Checks for crossovers between the %K and %D lines to generate alerts for potential trading signals.
Plotting:
Plots the %K and %D lines for both timeframes and adds visual elements for overbought and oversold levels.
This indicator helps traders analyze market trends using the Stochastic Oscillator on multiple timeframes, providing potential buy and sell signals based on the interaction of the %K and %D lines.
The alerts generated by the "Stoch Double Analysis MTF" indicator can be viewed as part of a broader educational and training path for traders!
dashboard MTF,EMA User Guide: Dashboard MTF EMA
Script Installation:
Copy the script code.
Go to the script window (Pine Editor) on TradingView.
Paste the code into the script window.
Save the script.
Adding the Script to the Chart:
Return to your chart on TradingView.
Look for the script in the list of available scripts.
Add the script to the chart.
Interpreting the Table:
On the right side of the chart, you will see a table labeled "EMA" with arrows.
The rows correspond to different timeframes: 5 minutes (5M), 15 minutes (15M), 1 hour (1H), 4 hours (4H), and 1 day (1D).
Understanding the Arrows:
Each row of the table has two columns: "EMA" and an arrow.
"EMA" indicates the trend of the Exponential Moving Average (EMA) for the specified period.
The arrow indicates the direction of the trend: ▲ for bullish, ▼ for bearish.
Table Colors:
The colors of the table reflect the current trend based on the comparison between fast and slow EMAs.
Blue (▲) indicates a bullish trend.
Red (▼) indicates a bearish trend.
Table Theme:
The table has a dark (Dark) or light (Light) theme according to your preference.
The background, frame, and colors are adjusted based on the selected theme.
Usage:
Use the table as a quick indicator of trends on different timeframes.
The arrows help you quickly identify trends without navigating between different time units.
Designed to simplify analysis and avoid cluttering the chart with multiple indicators.

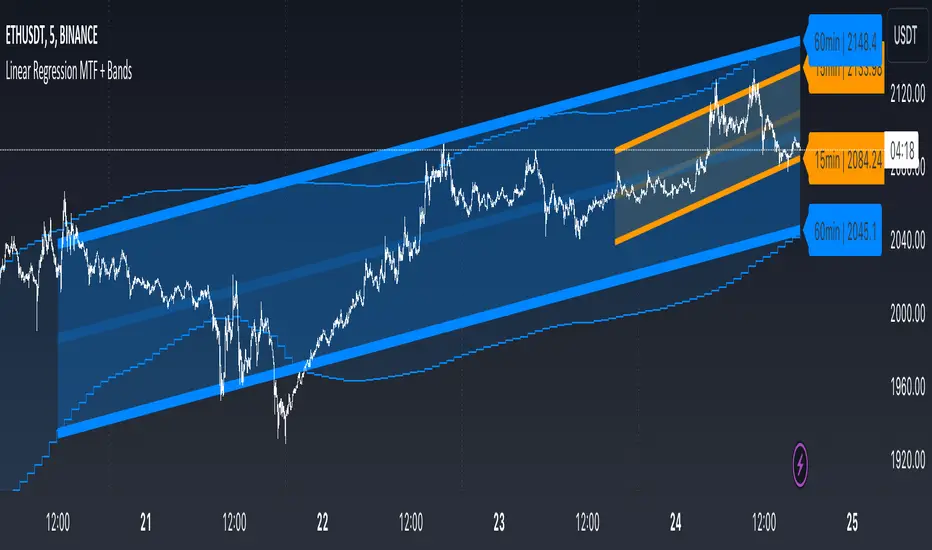
Linear Regression MTF + Bands
Multiple Time Frames (MTFs): The indicator allows you to view linear regression trends over three different time frames (TF1, TF2, TF3) simultaneously. This means a trader can observe short, medium, and long-term trends on a single chart, which is valuable for understanding overall market direction and making cross-timeframe comparisons.
Linear Regression Bands: For each time frame, the indicator calculates linear regression bands. These bands represent the expected price range based on past prices. The middle line is the linear regression line, and the upper and lower lines are set at a specified deviation from this line. Traders can use these bands to spot potential overbought or oversold conditions, or to anticipate future price movements.
History Bands: Looking at linear regression channels can be deceiving if the user does not understand the calculation. In order to see where the channel was at in history the user can display the history bands to see where price actual was in a non-repainting fashion.
Customization Options: Traders can customize various aspects of the indicator, such as whether to display each time frame, the length of the linear regression (how many past data points it considers), and the deviation for the bands. This flexibility allows traders to adapt the indicator to their specific trading style and the asset they are analyzing.
Alerts: The script includes functionality to set alerts based on the price crossing the upper or lower bands of any time frame. This feature helps traders to be notified of potential trading opportunities or risks without constantly monitoring the chart.
Examples
The 15minute linear regression is overlayed onto a 5 minute chart. We are able to see higher timeframe average and extremes. The average is the middle of the channel and the extremes are the outer edges of the bands. The bands are non-repainting meaning that is the actual value of the channel at that place in time.
Here multiple channels are shown at once. We have a linear regression for the 5, 15, and 60 minute charts. If your strategy uses those timeframes you can see the average and overbought/oversold areas without having to flip through charts.
In this example we show just the history bands. The bands could be thought of as a "don't diddle in the middle" area if your strategy is looking for reversals
You can extend the channel into the future via the various input settings.
Breakout Detector (Previous MTF High Low Levels) [LuxAlgo]The Breakout Detector (Previous MTF High Low Levels) indicator highlights breakouts of previous high/low levels from a higher timeframe.
The indicator is able to: display take-profit/stop-loss levels based on a user selected Win/Loss ratio, detect false breakouts, and display a dashboard with various useful statistics.
Do note that previous high/low levels are subject to backpainting, that is they are drawn retrospectively in their corresponding location. Other elements in the script are not subject to backpainting.
🔶 USAGE
Breakouts occur when the price closes above a previous Higher Timeframe (HTF) High or below a previous HTF Low.
On the advent of a breakout, the closing price acts as an entry level at which a Take Profit (TP) and Stop Loss (SL) are placed. When a TP or SL level is reached, the SL/TP box border is highlighted.
When there is a breakout in the opposite direction of an active breakout, previous breakout levels stop being updated. Not reaching an SL/TP level will result in a partial loss/win,
which will result in the box being highlighted with a dotted border (default). This can also be set as a dashed or solid border.
Detection of False Breakouts (default on) can be helpful to avoid false positives, these can also be indicative of potential trend reversals.
This indicator contains visualization when a new HTF interval begins (thick vertical grey line) and a dashboard for reviewing the breakout results (both defaults enabled; and can be disabled).
As seen in the example above, the active, open breakout is colored green/red.
You can enable the setting ' Cancel TP/SL at the end of HTF ', which will stop updating previous TP/SL levels on the occurrence of a new HTF interval.
🔶 DETAILS
🔹 Principles
Every time a new timeframe period starts, the previous high and low are detected of the higher timeframe. On that bar only there won't be a breakout detection.
A breakout is confirmed when the close price breaks the previous HTF high/low
A breakout in the same direction as the active breakout is ignored.
A breakout in the opposite direction stops previous breakout levels from being updated.
Take Profit/Stop Loss, partially or not, will be highlighted in an easily interpretable manner.
🔹 Set Higher Timeframe
There are 2 options for choosing a higher timeframe:
• Choose a specific higher timeframe (in this example, Weekly higher TF on a 4h chart)
• Choose a multiple of the current timeframe (in this example, 75 minutes TF on a 15 min chart - 15 x 5)
Do mind, that when using this option, non-standard TFs can give less desired timeframe changes.
🔹 Setting Win/Loss Levels
The Stop Loss (SL) / Take Profit (TP) setting has 2 options:
W%:L% : A fixed percentage is chosen, for TP and SL.
W:L : In this case L (Loss-part) is set through Loss Settings , W (Win-part) is calculated by multiplying L , for example W : L = 2 : 1, W will be twice as large as the L .
🔹 Loss Settings
The last drawing at the right is still active (colored green/red)
The Loss part can be:
A multiple of the Average True Range (ATR) of the last 200 bars.
A multiple of the Range Cumulative Mean (RCM).
The Latest Swing (with Length setting)
Range Cumulative Mean is the sum of the Candle Range (high - low) divided by its bar index.
🔹 False Breakouts
A False Breakout is confirmed when the price of the bar immediately after the breakout bar returns above/below the breakout level.
🔹 Dashboard
🔶 ALERTS
This publication provides several alerts
Bullish/Bearish Breakout: A new Breakout.
Bullish/Bearish False Breakout: False Breakout detected, 1 bar after the Breakout.
Bullish/Bearish TP: When the TP/profit level has been reached.
Bullish/Bearish Fail: When the SL/stop-loss level has been reached.
Note that when a new Breakout causes the previous Breakout to stop being updated, only an alert is provided of the new Breakout.
🔶 SETTINGS
🔹 Set Higher Timeframe
Option : HTF/Mult
HTF : When HTF is chosen as Option , set the Higher Timeframe (higher than current TF)
Mult : When Mult is chosen as Option , set the multiple of current TF (for example 3, curr. TF 15min -> 45min)
🔹 Set Win/Loss Level
SL/TP : W:L or W%:L%: Set the Win/Loss Ratio (Take Profit/Stop Loss)
• W : L : Set the Ratio of Win (TP) against Loss (SL) . The L level is set at Loss Settings
• W% : L% : Set a fixed percentage of breakout price as SL/TP
🔹 Loss Settings
When W : L is chosen as SL/TP Option, this sets the Loss part (L)
Base :
• RCM : Range Cumulative Mean
• ATR : Average True Range of last 200 bars
• Last Swing : Last Swing Low when bullish breakout, last Swing High when bearish breakout
Multiple : x times RCM/ATR
Swing Length : Sets the 'left' period ('right' period is always 1)
Colours : colour of TP/SL box and border
Borders : Style border when breakout levels stop being updated, but TP/SL is not reached. (Default dotted dot , other option is dashed dsh or solid sol )
🔹 Extra
Show Timeframe Change : Show a grey vertical line when a new Higher Timeframe interval begins
Detect False Outbreak
Cancel TP/SL at end of HTF
🔹 Show Dashboard
Location: Location of the dashboard (Top Right or Bottom Right/Left)
Size: Text size (Tiny, Small, Normal)
See USAGE/DETAILS for more information

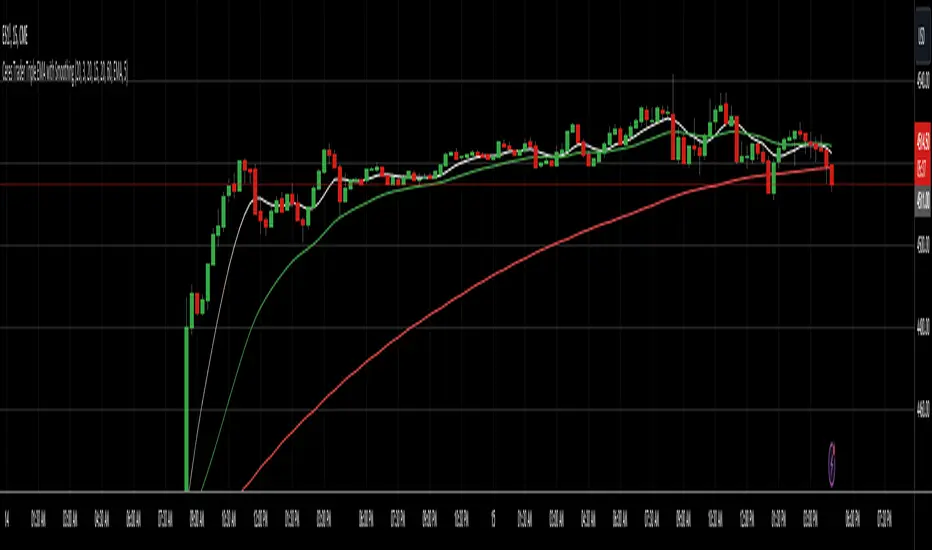
Ceres Trader MTF Triple EMA with SmoothingDescription:
The "Ceres Trader MTF EMA with Smoothing" indicator is a versatile tool designed for traders who rely on Exponential Moving Averages (EMAs) for their technical analysis. This indicator uniquely blends the concept of EMAs with customizable smoothing techniques, enhancing the clarity and interpretability of moving average lines on your charts.
Features:
Triple EMA Visualization: Visualize three distinct EMAs on your chart, each customizable in terms of length, timeframe, and color. This triple-layer approach allows for a comprehensive view of price trends across different time periods.
User-defined EMA Lengths: Set the lengths of all three EMAs according to your trading strategy. The default length is set at 20 bars, but this can be easily adjusted to suit different trading styles and timeframes.
Flexible Timeframes: Each EMA can be plotted based on different timeframes, providing a multi-timeframe analysis within a single chart view.
Smoothing Techniques: Choose from five different smoothing methods (SMA, EMA, SMMA, WMA, VWMA) to refine the EMA lines. This feature reduces market “noise” and helps in identifying the true underlying trends.
Enhanced Smoothing for Longer Timeframes: The indicator applies an advanced double smoothing technique to the EMA of the longest timeframe, offering an even smoother line that is beneficial for long-term trend analysis.
Customizable Aesthetics: Personalize the appearance of each EMA line with a selection of colors, enhancing visual differentiation and readability.
Benefits:
Versatility: Suitable for various trading styles, including swing trading, day trading, and long-term trend following.
Clarity in Trend Analysis: The smoothing techniques help in filtering out market noise, making it easier to identify meaningful trends.
Multi-Timeframe Analysis: The ability to view EMAs from different timeframes simultaneously offers a comprehensive analysis, saving time and enhancing decision-making.
Ideal for: Traders looking for a customizable and insightful way to use EMAs in their market analysis. Whether you are a beginner or an experienced trader, this indicator's flexibility and depth can add significant value to your technical analysis toolkit.
RSI MTF Panel [xdecow]This indicator shows the RSI of up to 10 different timeframes with various customization options:
Panel position
Panel orientation (vertical/horizontal)
Border width and color
Choose up to 10 time frames with RSI length and source
Background and text colors
Thresholds of overbought, oversold, uptrend, downtrend and no-trend zones to change the color of the RSI
Color debug mode

DSS Bressert Stochastic MTFDouble Smoothed Stochastics – DSS Bressert is an oscillator introduced by William Blau and Walter Bressert shortly after each other in two slightly different versions. The calculation of DSS Bressert values is similar to the stochastic indicator. The difference is the use of double exponential smoothing. The advantages over the classic stochastic oscillators are the fast response to price changes in a still very smooth pattern. In addition, the extreme zones at the other end of the scale are reached quite frequently, even in strong trends, resulting in many trend conforming signals. Double Smoothed Stochastics – DSS The Bressert values are the same as the stochastics – values above 80 indicate an overbought condition of the market, values below 20 indicate an oversold condition of the market.
This is a full implementation of the original Stochastic Calulation with Multi-Time-Frame options. Other available scrips are lagging here and messing MTF up...
This Scrip will plot 2 lines for the double smoothed Stochastic based on the original exponential calculation from Blau/Bressert. Whilst the original stochastic is only simple moving average.
If you are a daytrader or scalper, the script is able to show a slow line and a fast line pair. Preferred Settings are embedded as screenshot.

DojiCandle body size RSI-SMMA filter MTF
DojiCandle body size RSI-SMMA filter MTF
Hi. I was inspired by a public script written by @ahmedirshad419, .
I thank him for his idea and hard work.
His script is the combination of RSI and Engulfing Pattern.
//------------------------------------------------------------
I decided to tweak it a bit with Open IA.
I have changed:
1) candle pattern to DojiCandle Pattern;
2) I added the ability for the user to change the size of the candlestick body;
3) Added SMMA 200;
4) Changed the colour of SMMA 200 depending on price direction;
5) Added a change in the colour of candlesticks, depending on the colour of the SMMA 200;
6) Added buy and sell signals with indicator name, ticker and close price;
7) Added ability to use indicator on multi time frame.
How it works
1. when RSI > 70 > SMMA 200 and form the bullish DojiCandle Pattern. It gives sell signal
2. when RSI < 30 < SMMA 200 and form the bearish DojiCandle Pattern. It gives buy signal
settings:
basic setting for RSI, SMMA 200 has been enabled in the script to set the levels accordingly to your trades
Enjoy

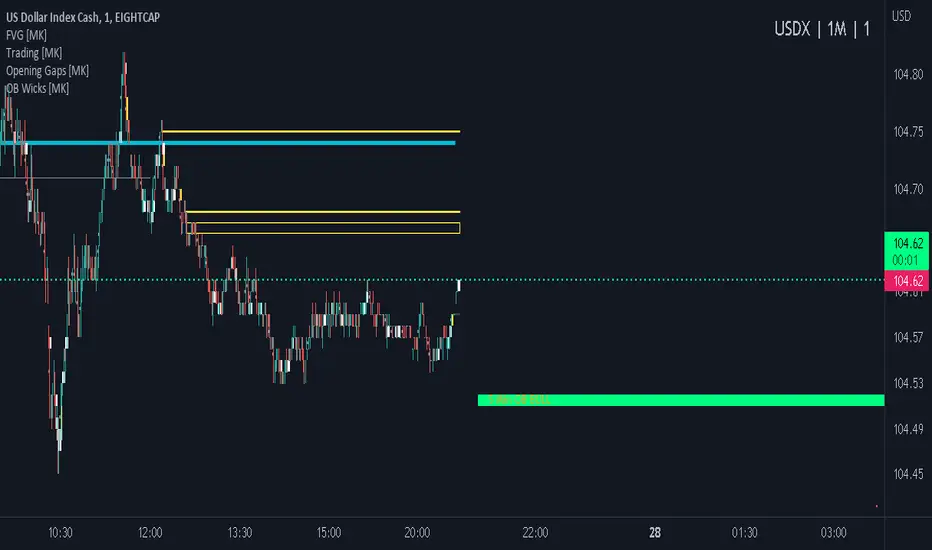
ICT MTF FVG [MK]FVGs (Fair Value Gaps) are significant levels that may act as support or resistance to price. The script finds FVGs as per ICT trading system, then plots the full FVG to the right side of the chart. FVG boxes do not change size when they are semi-mitigated as its important to know where the original FVG midpoint lies. Plotting to the right side of price allows for a cleaner chart. The script is MTF and can display FVG boxes for the following timeframes. Chart, 5,10,15,30,1hr,4hr,8hr,12hr,D,W,M.
Below shows 1hr FVGs marked out. NOTE: this is not what the script does, this is for explanation only.
Below shows what the script will do. 1hr FVGs shown on 15min chart

ICT MTF Order Block Wicks [MK]Order Blocks are significant levels that may act as support or resistance to price. Often the wick area is where price may react. The script finds order blocks as per ICT trading system, then plots either the top or bottom wick area to the right side of price. Plotting to the right side of price allows for a cleaner chart. The script is MTF and can display order block boxes for the following timeframes. 5,10,15,30,1hr,4hr,8hr,12hr,D,W,M. Only order blocks of a higher timeframe than the current chart can be shown.
Below shows how order block wicks should be drawn on a 1hr chart NOTE: this is not what the indicator does, its only for explanation.
Below shows the same 1hr order blocks, but shown on a 15min chart NOTE: this is the function of this indicator.
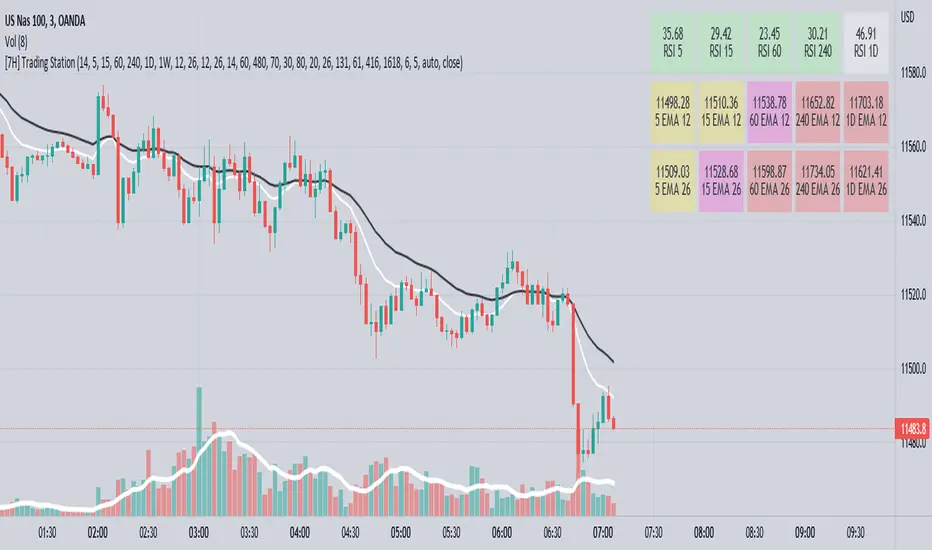
[7H] Trading HUD - MTF EMAs and RSIThis is a MTF HUD built around Chartguy Dan's trading style of 12/26 EMAs and RSI levels from multiple time frames. The HUD is configurable, allowing you to change the time frame of RSI levels and EMAs. The EMAs can be displayed at their current price or a percentage distance away. The HUD values will change color.
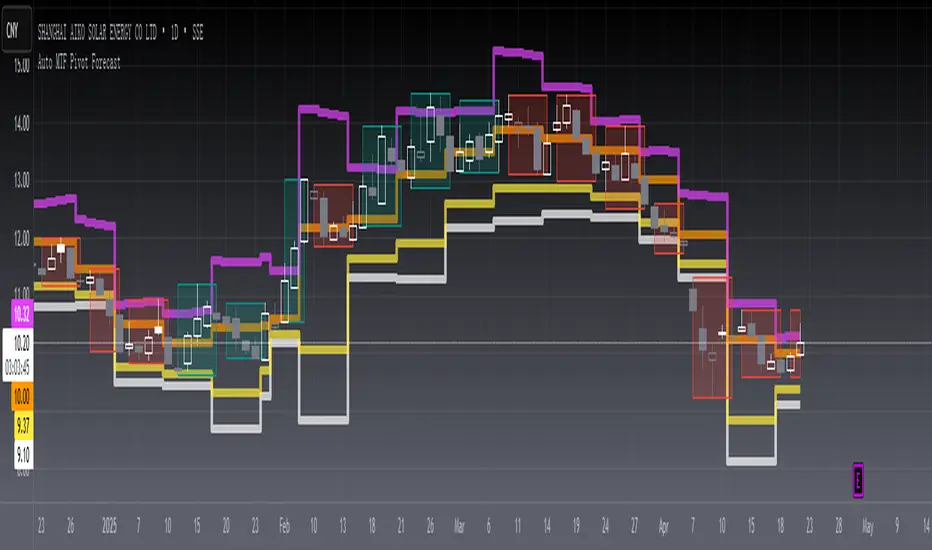
[blackcat] L2 Auto MTF Pivot Forecast Level 2
Background
A algo for pivot points forecast for each bar of automatic multiple timeframe (MTF) data.
Function
In financial markets, a pivot point is a price level that is used by traders as an indicator of market movement. Pivot points are averaged from important prices (highest, lowest, closing) based on the market performance of the previous time period. There are many ways to calculate the pivot point. The pivot point is calculated using the highest price (H), the lowest price (L) and the closing price (C) of the previous time period, and sometimes the opening price of the current time period Valence (O) was added to it.
S1 yellow
S2 white
R1 Orange
R2 fuchsia
The smoothing parameter default to 55
The pivot point indicator can be used in two ways. First, the pivot point can be used as a price trend confirmation. It is generally believed that if the price is above the pivot point in the latter period of time, the market is considered to be in a bull market sentiment, otherwise it is considered to be in a bear market sentiment. Second, support and resistance levels are mainly used as exit positions. For example, R1 and R2 can be used as trade targets if the market price breaks above a pivot point. If the market effectively breaks R1 and R2, traders may consider adding to their long positions.
Remarks
Feedbacks are appreciated.
DB CCI Breakout MTFDB CCI Breakout MTF
What does the indicator do?
The indicator will display crypto breakout and fallouts based on 4 timeframe CCI values. By default the current chart timeframe is used and the user may chose 3 other timeframes in the settings. Additionally, the symbol may be configured in the indicator settings. Default is Coinbase:ETHUSD.
The indicator will monitor the CCI levels on 4 timeframes and will alert to any CCI activity over 100 or under -100 which would indicate a breakout or fallout is present.
A green diamond is displayed when a breakout is detected on one or more of the timeframes for the selected symbol.
How should this indicator be used?
The indicator is a secondary alert system for the presence of breakouts or fallout conditions as under those scenarios position exit or entry strategies may be different.
Does the indicator include any alerts?
Not in this version. But I could add some if desired.
Use at your own risk and do your own diligence.
Enjoy!

STD Stepped Ehlers Optimal Tracking Filter MTF w/ Alerts [Loxx]STD Stepped Ehlers Optimal Tracking Filter MTF w/ Alerts is the traditional Ehlers Optimal Tracking Filter but with stepped price levels, access to multiple time frames, and alerts.
What is Ehlers Optimal Tracking Filter?
From "OPTIMAL TRACKING FILTERS" by John Ehlers:
"Dr. R.E. Kalman introduced his concept of optimum estimation in 1960. Since that time, his technique has proven to be a powerful and practical tool. The approach is particularly well suited for optimizing the performance of modern terrestrial and space navigation systems. Many traders not directly involved in system analysis have heard about Kalman filtering and have expressed an interest in learning more about it for market applications. Although attempts have been made to provide simple, intuitive explanations, none has been completely successful. Almost without exception, descriptions have become mired in the jargon and state-space notation of the “cult”.
Surprisingly, in spite of the obscure-looking mathematics (the most impenetrable of which can be found in Dr. Kalman’s original paper), Kalman filtering is a fairly direct and simple concept. In the spirit of being pragmatic, we will not deal with the full-blown matrix equations in this description and we will be less than rigorous in the application to trading. Rigorous application requires knowledge of the probability distributions of the statistics. Nonetheless we end with practically useful results. We will depart from the classical approach by working backwards from Exponential Moving Averages. In this process, we introduce a way to create a nearly zero lag moving average. From there, we will use the concept of a Tracking Index that optimizes the filter tracking for the given uncertainty in price movement and the uncertainty in our ability to measure it."
Included:
-Standard deviation stepping filter, price is required to exceed XX deviations before the moving average line shifts direction
-Selection of filtering based on source price, the moving average, or both; you can also set the Filter deviations to 0 for no filtering at all
-Toggle on/off bar coloring
-Toggle on/off signals
-Long/Short alerts

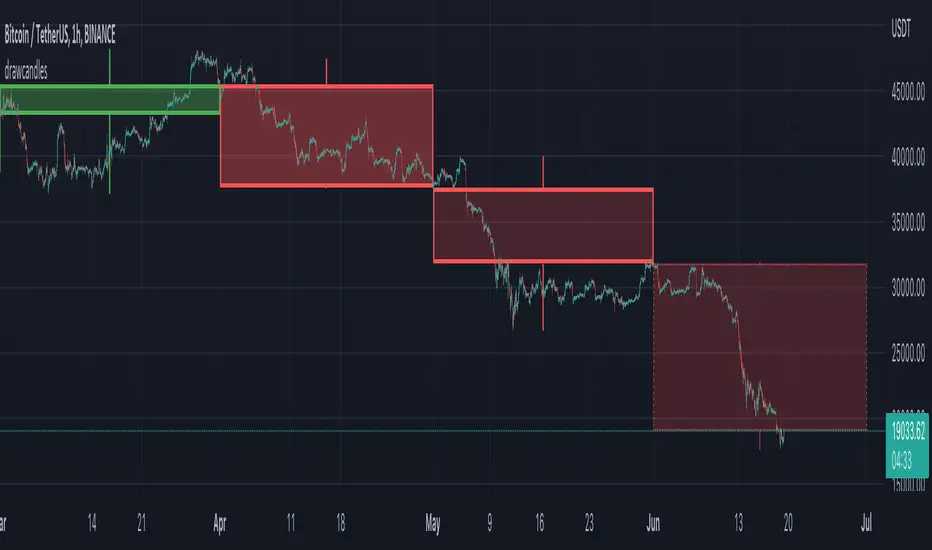
drawcandlesLibrary "drawcandles"
simple utility to draw different candles using box and lines. Quite useful for drawing candles such as zigzag candles or MTF candles
draw(o, h, l, c, oBar, cBar)
draws candles based on ohlc values
Parameters:
o : Open Price
h : High Price
l : Low Price
c : Close Price
oBar : Open Time
cBar : Close Time
Returns: void
Moving Average Multipliers MTF (Mescu)Includes 4 customizable Moving Average with multipliers and multi-timeframe (MTF).
Tweaks the parameters to your liking, it should be pretty simple to understand
Used here with BTC/USD (1W) to identify good sell and buy zone for Bitcoin.
Got the idea from the 2-year MA Multiplier indicator, but didn't find something of my liking on TradingView, so I made my own.
Drop me a comment if you have any questions, suggestions, improvements.
Mescu
www.tradingview.com

CCI MTF Ob+OsHello Traders,
This is a simple Commodity Channel Index (CCI) indicator with multi-timeframe (MTF) overbought and oversold level.
It can detect overbought and oversold level up to 5 timeframes, which help traders spot potential reversal point more easily.
There are options to select 1-5 timeframes to detect overbought and oversold.
Green Background is "Oversold" , looking for "Long".
Red Background is "Overbought" , looking for "Short".
Have fun :)

Ichimoku Buy/Sell Signals of manual MTF Tenkan crossing KijunIchimoku Buy/Sell Signals based on fast, small time frame Tenkans crossing longer timeframes Kijuns - Manual MTF Analysis
This code marks the potential change of direction based on the input of one timeframe's Ichimoku Tenkan (conversion) line crossing over a higher, longer timeframe's Ichimoku Kijun (base) line.
Feel free to change the inputs if need be and to hide the yellow box. Use Ichimoku rules of Tenkan, Kijun, Lagging Span, and Cloud for Take profit/Stop Losses. It is best to wait 3-5 minutes after the signal to enter to confirm the trend and to confirm if the Lagging Span has broken key levels. I refer to the book Trading with Ichimoku - A Practical Guide to Low-Risk Ichimoku Strategies by Karen Peloille as the Ichimoku rulebook. Good luck.
For day trading/scalping/intraday - 1min/3min/5min
Tenkan Line Timeframe = 1min
Kijun Line Timeframe = 5min
For swing trading - multiple days/weeks - 4HR/Daily/Weekly Charts
Tenkan Line Timeframe = day
Kijun Line Timeframe = week

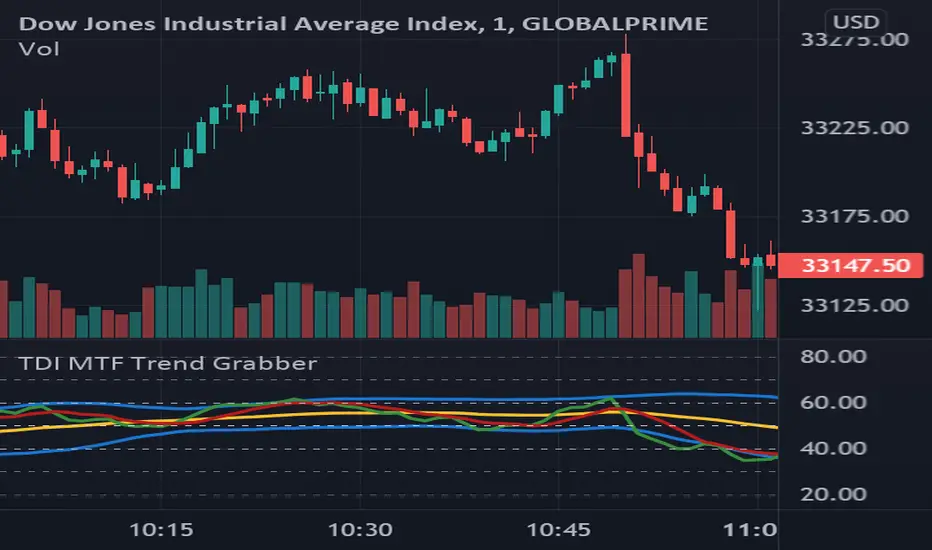
TDI MTF Trend GrabberWork in progress!
I like using the TDI, but getting more interested in the confluence of when several timeframes all turn bullish or bearish , etc.
However I actually could use some help getting the MTF / request.security working properly.
Currently the idea is to be able to switch between the current timeframe, and at this point 2 other timeframes.
Change the timeframe using the "Plot_tf" input.
Thanks community.
[Sextan] Dark Cloud Density MTFNOTE: Sextan Bactest version which support MTF
Level:1
Background
Go long through the buy and sell tags, and determine the size of the buy position by observing the density of the dark cloud or the thickness of the dark cloud.
Function
This is a buying and selling system that strives for simplicity and clarity, and position control is determined by the trend. The dark cloud here is the standard of this measurement. If there are many dark clouds, it means that the short-selling power is relatively strong, and the long-buying signal can be given up or bought with a small position. If the density of the dark clouds is sparse, it means that the long and short positions are weak, and the long positions can be appropriately increased.
The specific function is to follow the label prompts to buy and sell, and to decide how much to buy according to the density of the dark clouds.
Remarks
Free and Open Source
Alerts are added.
