RSI + EMA+ MTF Stop-LossThis is a simple RSI with multiple MTF (No security) to help with direction short and long-term.
The rsi for the current chart has a noise reduction, while the rest are based on ma's.
I have supplied an extra flexible mtf rsi ma for potential adjustable/long-term stop-loss or direction identification.
Enjoy
Cari dalam skrip untuk "mtf"

Bollinger MTFSo this is a Bollinger resistance and support map, I just convert it to v4 and add info for current upper and lower levels
The length is 60 (instead of regular 20) and we make it to be MTF
Ok , so how this system work
we choose TF and I normaly use 3x or 4X of the MTF (you can choose your own)
then we need to decide if we want to long or short
if we go long then the buy point will be the lower value and TP will be TP in green -
If we go short then our entry value will be upper and TP (take profit) will be in red
so one can put few tweeks and make this system to be more automatic , but I just show this as a easy concept for trade system
the main issue in such system is properly to decide when to go short or when to go long
that why you need to add other indicators in order to make this call and make this system effective

EMA/SMA Forecast MTF with BB and KC5 x EMA with future forecast values (5 periods)
4 x SMA with future forecast values (5 periods)
2 x MTF EMA
2 x MTF SMA
Bollinger Bands
Keltner Channels
Enjoy!
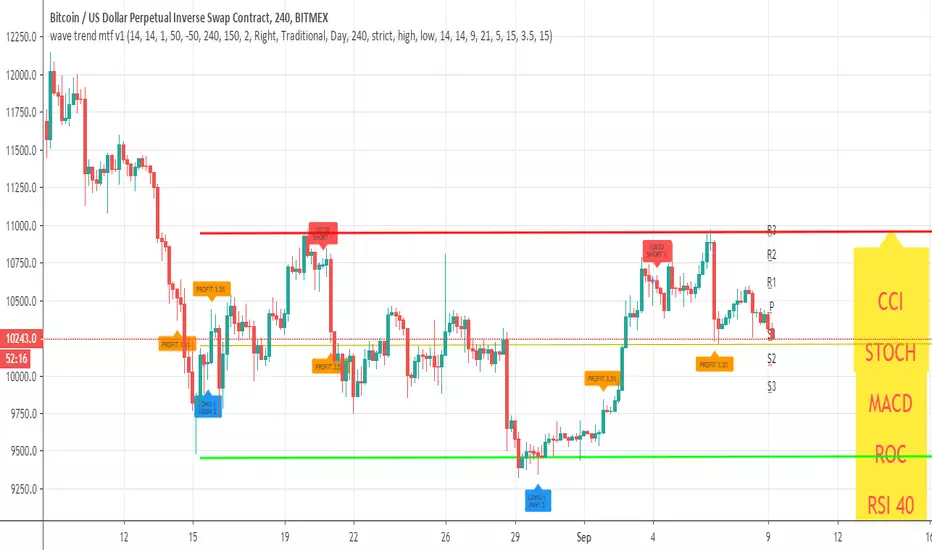
wave trend mtf v1This Lazy Bear wave trend in MTF version with take profit and stop loss rebuy
you can change the MTF using the security call
and many nice option to see insid3e
so you can play with it, modify it or make it better
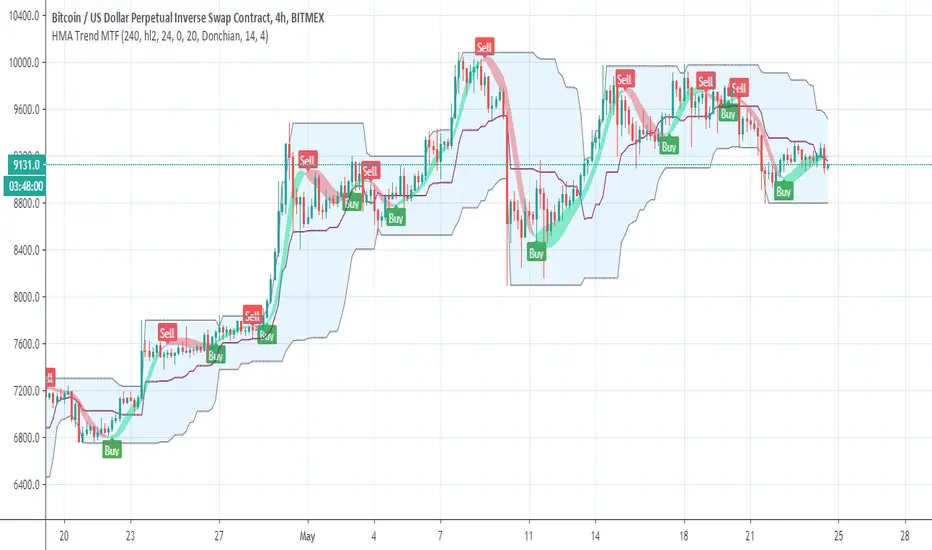
Hull Trend MTFhull trend taken from
So add MTF function and alert for the buy and sell (in the MTF shift set to 0 , if repaint then set shift to 1)
the blue line is linear regression trend
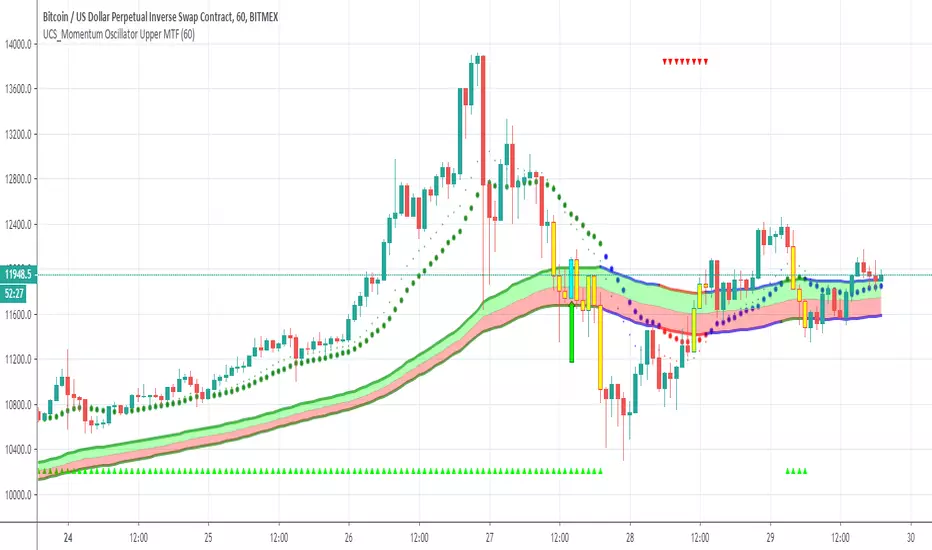
UCS_Momentum Oscillator Upper MTFby request of a freind I just made him this famous oscilator of chris mody in MTF format
so it a sling shot and MTF
HullDEMA MTFThis indicator based on non repaint HULL 720 min and dema MTF
i suugest to keep the Dema MTF on the time frame of your graph
using the HULL 720 min we can see how the signal of DEMA and the crossing of the hull 720 either by DEMA or by the candels
this enable us to detect trends more easy

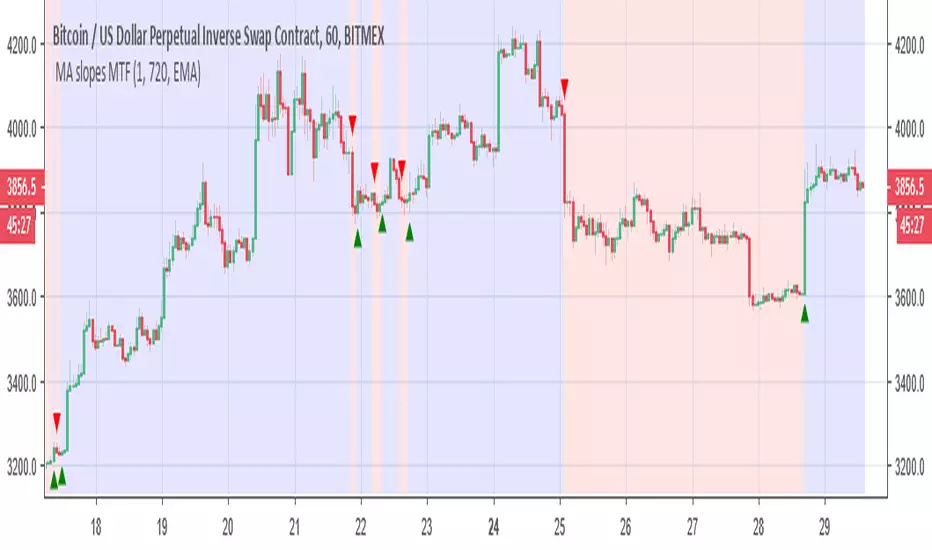
MA slopes MTF this is the original script. its nice as I love slopes of different MA
add MTF +colors of bullish and bearish
add alerts and signals
This can be a very good base indicator if one want to add extra things to it to make it better
or can used as a good filter
here on 15 min 1000min MTF
VPT and Heiken Ashi Candles MTFThe volume price trend indicator is used to determine the balance between a security’s demand and supply. The percentage change in the share price trend shows the relative supply or demand of a particular security, while volume indicates the force behind the trend. The VPT indicator is similar to the on-balance volume (OBV) indicator in that it measures cumulative volume and provides traders with information about a security’s money flow
So we put the VPT and add HA candles with non repainting MTF , the crossing up or down of the VPT over candles create the signals
since VPT tend to overshoot you can smooth it with Leni..(just give the smoothing of the length this stupid name:) )
alerts inside
just example of play with MTF and the smooth of VPT
DEMA-MTF with alerts This model based on DEMA with non repainting MTF
if you want to change the MTF use int2
buy and sell show in triangke signals
alerts included
you can smooth the signal with len1 if needed

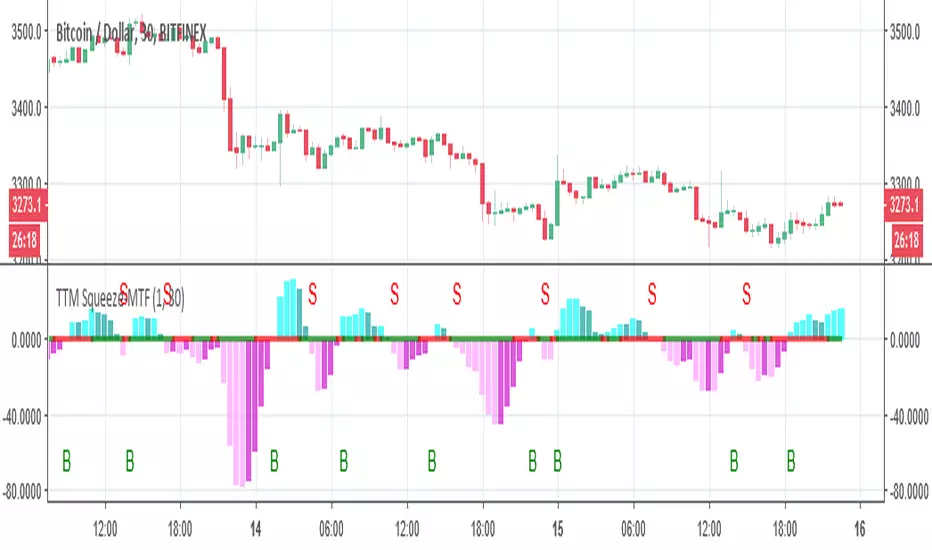
TTM Squeeze-MTFthe script based on
I just change it to be non repainting MTF and add signals
you can change the MTF by changing int2
Heiken Ashi Candles MTFThis script allow you to get the HA candles in different MTF settings (MTF calculated as length not as time) . since we do not use security fuction we do not have repaint issue
Use the int2 to change the time frame
Up/Down Range Momentum MTFSo using the script of
and adding non repainting MTF function to it we create this momentum model
You can enter either at cross of blue line or at cross of 0 and vice versa at red line.
since it has MTF function you can look it on different time frames just set int 2 to the TF of your desire

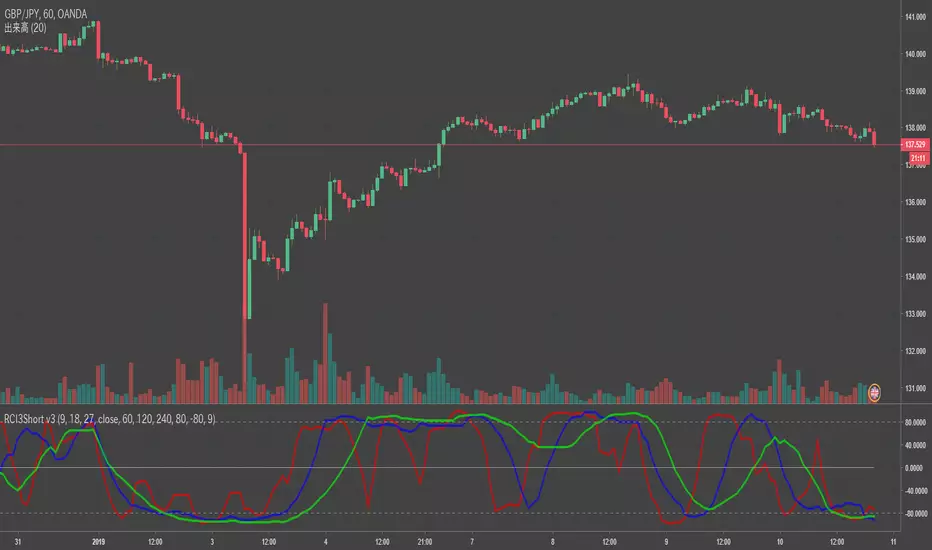
RCI3Short MTFFor RCI lover.
We are facing a timeout problem on smart phone apps of TV.
It looks like a staircase, but It frees us from timeout problems.
default MTF: 60 / 120 / 240
MTF line as middle/long lines
MA Study: Different Types and More [NeoButane]A study of moving averages that utilizes different tricks I've learned to optimize them. Included is Bollinger Bands, Guppy (GMMA) and Super Guppy.
The method used to make it MtF should be more precise and smoother than regular MtF methods that use the security function. For intraday timeframes, each number represents each hour, with 24 equal to 1 day. For daily, 3 is 3 day, for weekly, 4 is the 4 weekly, etc. If you're on a higher timeframe than the one selected, the length will not change.
Log-space is used to make calculations work on many cryptos. The rules for color changing Guppy is changed to make it not as choppy on MAs other than EMA. Note that length does not affect SWMA and VWAP and source does not affect VWAP.
A short summary of each moving average can be found here: medium.com
List of included MAs:
ALMA: Arnaud Legoux
Double EMA
EMA: Exponential
Hull MA
KAMA: Kaufman Adaptive
Linear Regression Curve
LSMA: Least Squares
SMA: Simple
SMMA/RMA: Smoothed/Running
SWMA: Symm. Weighted
TMA: Triangular
Triple EMA
VWMA: Volume Weighted
WMA: Weighted
ZLEMA: Zero Lag
VWAP: Vol Weighted Average
Welles Wilder MA

BottomFinder MTF Madness - 5x MTF Grid IndicatorsHello Again Trading View!
Bottom Finder Team here bringing another delicious indicator, this time to help spot those trends! This version is closed for Beta Testing with our subscribers only for the next few weeks. After beta improvements it will be released free to anyone who signs up as a free member on our site.
This is meant to be used on the 15m timeframe, and it looks up into higher TF's. It is meant to be maximized, so have this open in one tab and the chart on another. Dual Monitors are best. All options and Time frames are fully configurable inputs.
Indicators from top to bottom are:
1.)Polarity Filtration - 6 Timeframes
2.)Price Volume Trend - 4 Timeframes
3.)Stochastic RSI - 4 Timeframe Grid, and Current Timeframe in lines/ribbons
4.)MACD Crossovers - 8 Timeframes
5.)SuperTrend - 4 Timeframes
And last...
6.)Background Color indicator is up/down (green/red) price on 1 Hour Heiken Ashi candle chart.
No more swapping back and forth between timeframes!
For access to this and many other exclusive indicators - you can visit our telegram and ask about becoming a subscriber. All our paid indicators have a reasonable lifetime cap price. Once you reach it, indicator is yours for life - no more subscription.
ADX-DI MTF trend indication - JD version 2Version 2 added support for MTF, to see the trend direction on the lower or higher timeframe.
As an example to see the difference, the indicator is added three times, one time for the current TF, one set at the higher and one at the lower TF.
Cudo's to Chris Moody for the MTF-switching-code!!
JD.

BrainTrend MTF(Multi Time Frame ) No Repaint version
This is the NO REPAINT version with new algorithm, it also comes with alert.
In the original version, signal on current bar will always change until the Close price is fixed.
With this MTF version BrainTrend, you can apply any time frame of BrainTrend to your current chart.
As long as the selected MTF time frame is greater than the chart time frame.
BrainTrade is ideal for both day trading and position trading. BrainTrade help you to focus on the most essential information on markets. BrainTrade indicators provide market directions, provide trend and stops, provide buy and sell signals. With BrainTrade you now have immediate access to the river of information about the major trend changes, buy and sell signals, and stops for large number of market symbols. BrainTrade is revolutionizing the very nature of trading. People have lived for so long without information at their fingertips that they don’t realize what they’re missing.
Parameters available for you to adjust the BrainTrend Indicator.
timeframe: choos your desired timeframe.
stoch_period
stoch_max
stoch_min
atr_current_norm_factor
atr_before_norm_factor
atr_period
atr_before_step
Since there already are many explaination and details about this indicator, we don't repeat it here.
It works on all time frame and all markets(Stocks, Futures, Forex, Options,ETF, etc.)

RS_Stoch-RSI_MTFmodification by Richard Siegers that turned stochastic mtf from ChrisMoody into stochastic-rsi mtf
B3 Bar Cycle MTF (fix)Apologies, there was an error in printing for the thick gray boxes, happened when MTF was switched on. All better, and here is the details from before:
This is an interesting study that can be used as a tool for determining trend direction, and also could be a trailing stop setter. I use it as a gauge on MTF settings. If on, you can look at the bar cycle of the 1h while on the 15m giving you a lot of information in one tool. If a line is missing high or low, it is because it was broken, if both exist you are trading in range and cloud appears. If both sides break you get thick gray boxes above and below bar.
Get used to editing the inputs to suit your liking. Often 3-5 length and always looking at different resolutions to get a big picture story. You could put multiple instances of the study up to see them simultaneously. I based the idea off of Krausz's 3 day cycle which you can read about in his teachings. I tend to find it looking better using Heikin Ashi bar-style.

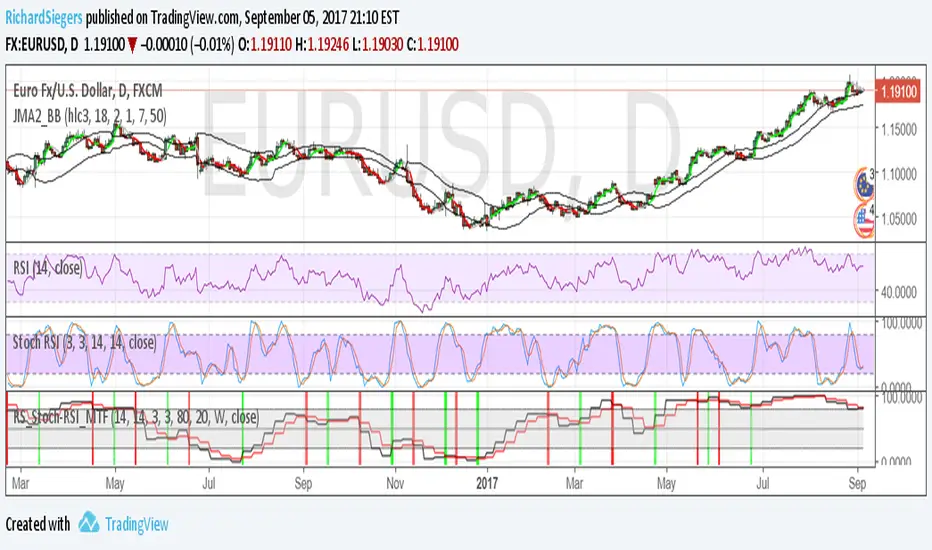
True Strength Indicator MTFHere is an example of a script showing a multi-time frame of TSI.
Chart below compares FX EURUSD Daily TSI to 1H TSI
Here is an updated version
study("True Strength Indicator MTF", shorttitle="TSI MTF")
resCustom = input(title="Timeframe", type=resolution, defval="60" )
long = input(title="Long Length", type=integer, defval=25)
short = input(title="Short Length", type=integer, defval=13)
signal = input(title="Signal Length", type=integer, defval=13)
price = close
double_smooth(src, long, short) =>
fist_smooth = ema(src, long)
ema(fist_smooth, short)
pc = change(price)
double_smoothed_pc = double_smooth(pc, long, short)
double_smoothed_abs_pc = double_smooth(abs(pc), long, short)
tsi_value = 100 * (double_smoothed_pc / double_smoothed_abs_pc)
tsi = security(tickerid, resCustom,tsi_value)
plot(tsi, color=black)
plot(ema(tsi, signal), color=red)
hline(0, title="Zero")

Valuation Multi-Asset [MTF]Description This indicator is a specialized Intermarket Analysis tool designed to determine the relative valuation of an asset by comparing its performance against key global benchmarks (Currency, Commodities, Bonds, and Sector ETFs).
Unlike standard oscillators (like RSI) that only look at the asset's own price, this script calculates a Relative Value Index.
Underlying Concepts & Methodology The script operates on the principle of asset correlation and mean reversion ratios. The calculation logic follows these steps:
Ratio Calculation: It computes the price ratio between the Chart Asset and a Benchmark Asset (e.g., Symbol / DXY).
Smoothing: It applies a double smoothing method using Exponential Moving Averages (EMAs) to filter out short-term noise from the ratio.
Historical Normalization: Based on valuation theories (inspired by concepts like Larry Williams' valuation window), the script normalizes the smoothed ratio over a user-defined lookback period (default is 3 years/156 weeks). This ranks the current relative value between 0 and 100.
Key Features
Multi-Benchmark Comparison: Automatically compares the asset against the Dollar Index (DXY), Gold (GC1!), Bonds (ZB1!), and Sector ETFs.
MTF Dashboard: Includes a Multi-Timeframe table to see valuation status across Daily, Weekly, and Monthly views simultaneously.
ETF Reference: A built-in reference table to help you quickly find the correct Sector ETF for stock correlation.
How to Use
Undervalued Zone (< 15): When the line turns Green (or enters the bottom zone), the asset is historically cheap relative to the benchmark. This often indicates a potential accumulation or reversal point.
Overvalued Zone (> 85): When the line turns Red (or enters the top zone), the asset is historically expensive relative to the benchmark, suggesting potential distribution.
Divergences: Watch for divergences between the asset price and the Valuation Index (e.g., Price makes a new high, but the Valuation Index against Gold makes a lower high).
Settings
You can toggle individual benchmark lines (Asset 1 to 4).
Adjust the "Lookback Period" to change the historical normalization window.
Customize the Overbought/Oversold thresholds.

LHAMA MTF Structure & Fibs [LTS]Overview
LHAMA MTF Structure & Fibs is a multi-purpose market structure toolkit that combines current-timeframe structure, higher-timeframe structure, Imbalance/FVG-based order blocks, and automatic Fibonacci retracements into a single chart overlay.
Current-Timeframe Structure
The indicator first maps current-timeframe market structure using swing highs and lows based on a user-defined pivot length (“Time-Horizon”):
Labels swing points as HH , HL , LH , and LL .
Draws BOS (Break of Structure) when price breaks beyond a prior swing.
Optionally identifies CHoCH (Change of Character) when a break occurs against the previous direction.
Lets you choose whether BOS/CHoCH confirmation uses closes or wicks .
Provides options to show/hide swing labels, choose line style (solid/dashed/dotted), and configure bullish/bearish colors.
Higher-Timeframe (HTF) Structure
On top of the local structure, the script builds a higher-timeframe structure map and projects it onto your active chart:
Aggregates price into HTF “bars” (e.g., 4h structure on a 5m chart).
Detects HTF pivots with their own pivot length setting.
Draws HTF BOS/CHoCH lines and labels back on the lower timeframe.
Lets you choose wick vs close confirmation for HTF breaks.
Optional “ pending ” HTF levels: lines extended from the latest HTF swing highs/lows that remain “waiting” until price breaks them.
This is designed to make it easier to see how intraday price is moving relative to the dominant higher-timeframe trend.
Order Blocks (Imbalance/FVG-Based)
The indicator detects simple bullish and bearish order blocks based on fair value gaps and prior sweeps:
Identifies bullish/bearish FVGs together with a sweep of a previous low/high.
Creates colored boxes anchored to an “anchor” candle and extends them forward.
Marks boxes as “broken” when price trades inside or through the opposite side.
Broken blocks can have reduced emphasis (more transparent, dashed border) and can optionally be deleted.
Show Nearest Only mode highlights only the closest active bullish and bearish blocks to reduce chart clutter.
Periodic cleanup removes very old boxes to maintain chart responsiveness.
Automatic Fibonacci Levels
The script can draw up to five customizable Fibonacci retracement levels using the HTF structure logic:
Measures swings using HTF pivots and extremes.
Historical mode : measures between two confirmed pivots in one direction.
Live mode : starts from the last confirmed pivot and tracks the evolving extreme; if price reverses through that pivot, measurement can flip to track the new leg.
Each Fib level has its own on/off toggle, ratio value, and color.
Draws a main swing line plus retracement lines projected slightly into the future.
Key Inputs & Customization
Market Structure (Current TF)
Pivot length (“Time-Horizon”).
BOS confirmation: candle close or wicks.
BOS/CHoCH line style and width.
Swing labels on/off and global label size.
Bullish/bearish colors.
Market Structure (HTF)
HTF timeframe selection.
Separate pivot length for HTF swings.
Close vs wick confirmation for HTF breaks.
HTF swing labels and CHoCH labels on/off.
Pending HTF levels: style, color, and visibility.
Order Block Settings
Bullish/bearish box colors and border width.
Maximum number of boxes to display.
Optional deletion of broken blocks.
“Show Nearest Only” filter to highlight the closest active zones.
Max bars to backscan for the anchor candle.
Cleanup frequency for removing very old boxes.
Fibonacci Settings
Show/hide auto Fibs.
Historical vs Live tracking mode.
Five user-defined ratios with individual toggles and colors.
