Improved Multi-Timeframe (MTF) 21 EMA - plots same as live dataThis multi-timeframe 21-period exponential moving average uses an improved calculation to accurately calculate the indicator's value with every new bar on the time frame your chart is set to. Previously the indicator only recalculated with every new update on the timeframe used in its security function. This means that this improved script plots the real, current value of your indicator across your chosen timeframes on your chart's resolution and no longer only plots only the indicator's monthly/weekly/daily/4 hour/ect closing value on the your chart.
Input values are fixed to their default (close,21) configuration to make this indicator's improved calculation possible.
When using "Plot Higher Timeframe?" the script will set the indicator to only plot its value in closest larger timeframe. This option overrides the two following options. For example, when using the daily resolution, only the weekly value will plot, or when using the one hour (60m) resolution, only the 4 hour (240m) value will plot.
The "Omit Higher Timeframes?" option will set the indicator to only plot starting from the 1/2/3/4/5/6/7th closest larger timeframe. For example, when using the daily resolution and this option set to 0, all values from the weekly resolution and up will plot, but if set to 1, all values from the monthly resolution and up will plot instead.
The "Plot Yearly/Quarterly/Monthly/Weekly/Daily/4 Hour/1 Hour/15 Minute/5 Minute?" options allow enabling/disabling a specific timeframe. All are enabled by default. For example, if you do not want the yearly value of the indicator to ever plot, you can disable the "Plot Yearly?" option.
Cari dalam skrip untuk "mtf"

Improved Multi-Timeframe (MTF) MACD - plots same as live dataThis multi-timeframe MACD uses an improved calculation to accurately calculate the indicator's value with every new bar on the time frame your chart is set to. Previously the indicator only recalculated with every new update on the timeframe used in its security function. This means that this improved script plots the real, current value of your indicator across your chosen timeframes on your chart's resolution and no longer only plots only the indicator's monthly/weekly/daily/4 hour/ect closing value on the your chart.
Input values are fixed to their default (close,12,26) configuration to make this indicator's improved calculation possible.
When using "Plot Higher Timeframe?" the script will set the indicator to only plot its value in closest larger timeframe. This option overrides the two following options. For example, when using the daily resolution, only the weekly value will plot, or when using the one hour (60m) resolution, only the 4 hour (240m) value will plot.
The "Omit Higher Timeframes?" option will set the indicator to only plot starting from the 1/2/3/4/5/6/7th closest larger timeframe. For example, when using the daily resolution and this option set to 0, all values from the weekly resolution and up will plot, but if set to 1, all values from the monthly resolution and up will plot instead.
The "Plot Yearly/Quarterly/Monthly/Weekly/Daily/4 Hour/1 Hour/15 Minute/5 Minute?" options allow enabling/disabling a specific timeframe. All are enabled by default. For example, if you do not want the yearly value of the indicator to ever plot, you can disable the "Plot Yearly?" option.
Cuban's MTF FisherA multi-timeframe Fisher indicator that has been updated to Pine version 3, added linear regression and RMA lines with up down colour coding, alert conditions for ease and autoview automatic trading, and a few other little tricks.
This indicator will no longer repaint and will provide more accurate signals. I've also added a backtester to allow you to find something that works for you. Just search 'Cuban's MTF Fisher Backtester'.
If you would like any features added, DM me on Tradingview or Twitter.

Heikin Ashi MTFHikin Ashi MTF
The Heikin-Ashi technique – meaning "average bar" in Japanese – can be used in conjunction with candlestick charts to spot trends and to predict future prices. ... Heikin-Ashi charts can also be used to keep traders in trades while a trend persists but get them out when the trend pauses or reverses.

Multiple EMA MTF by ZekisA simple but effective strategy with multiple time frames for EMA.
Very useful so you don't have to change chart resolution to check it, you have direct confirmation.
I put 6 time frames for one EMA as bricks, sometimes is hard to see if a line is above or below the price and you need to zoom and zoom, so with this way of view, it will be easier.
Green = EMA is below price = bullish
Red = EMA is above price = bearish
Multi time frames as default (you can change it for your needs) - 5m, 15m, 30m, 1H, 2H and 4H.
Enjoy!
@Zekis

MACD Enhanced System MTF with optional TSL and Alerts [LTB]This script is developed to analyse MACD, MACD Signal, MACD Histogram movements by using current and higher time frame. Script calculates higher time frame automatically, no manuel entry. there is trailing stop loss line that is optional.
You can change the parameters as you wish.
btw. you should know that MACD is more successful when there is a trend.
I already shared this as a strategy script. Some ppl wanted to see the code.
You might want to see strategy test =>
by LonesomeTheBlue


RSI ST MTFUsing this script with some changes
I try to build the RSI SUPERTREND model with MTF function
I think its need more work to refine it but as idea its nice

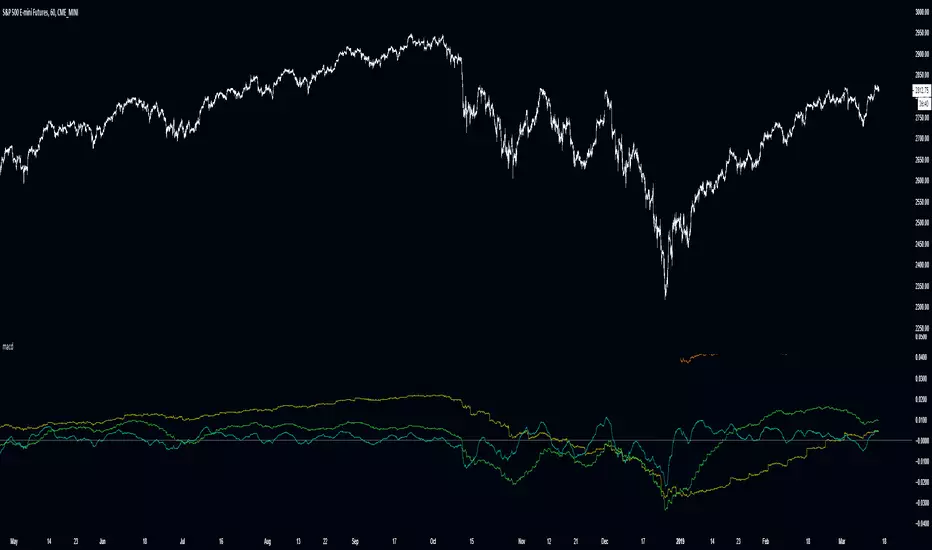
MACD MTF Indicator with Alerting v2.1 [priceactionguru]The MACD MTF is a trend-following momentum indicator that works across multiple timeframes.
It can be used as low as 1 minute or as high as 1 month.
The user can select the multiple time frames they wish to alert on as well as whether to alert on the histogram or MACD Line.
If you are a trend-following trader, this indicator will assist you in always entering with the trend across multiple timeframes, thus ensuring you minimize the maximum adverse excursion in price movement against your entry.

Bollinger Bands MTF [LonesomeTheBlue]With this script you can follow Bollinger Bands for current and higher time frame together. Higher time frame is calculated by script.
if current period
1m => higher period=5m
3m => higher period=5m
5m => higher period=15m
15m => higher period=1h
30m => higher period=1h
45m => higher period=1h
1h => higher period=4h
2h => higher period=4h
3h => higher period=4h
4h => higher period=1day
1day => higher period=1week

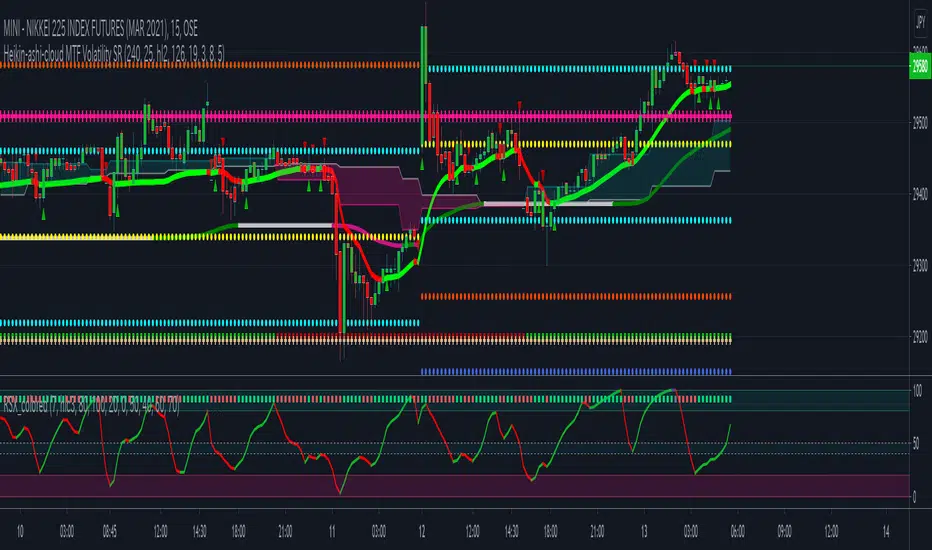
Heikin-ashi-cloud-MTFNK225M1!
Draw "Heikin-ashi-smoothed" in upper time frame as a cloud
Visualize trends
※Heikin-ashi-smoothed
Calculate average of candlestick of the past 3
Trend turnover timing is slower than "Heikin-Ashi"
Reduce the sign of "Heikin-Ashi" fake
------------------------------------------------------------------------------------------------
平均足クラウド(MTF)
上位時間軸の平均足(スムージング)を雲として描画するインジケーターです。
上位時間軸のトレンド確認に使用します。
※平均足(スムージング)
過去3本のローソク足から平均足を計算します。
トレンド転換のタイミングは遅れますが通常の平均足よりもダマシが減少しています。
Heikin Color MTF [Eric]This is a very useful tools that can project the MTF heikin color on the normal chart.

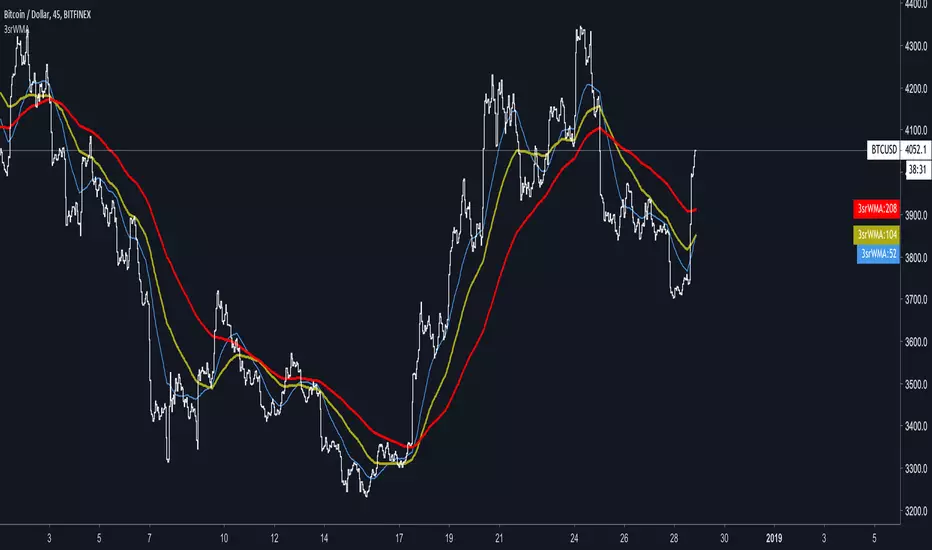
SuperRadu's 3EMA MTF It's EMAx3 using 52,104 and 208 values using 4H lookback candle data to make them more smoothed,clean and easy to understand the trend.

Trader Set - MTF Reversal Bar SignalsThis is Multi Tile Frame signalling of reversal bar strategy. Using this, you can easily Identify if you had a reversal bar signal in 1,2,3,4,5,10,15, and 30 minute based renko charts.
The more time frames get in sync with each other, the higher possibility for a more powerful signal.
The least you would need is for 1,2 and 3 minutes to have 2 out of 3 of them showing same signal.
Please don't ask for getting access, the licensing will be available for purchase soon in the website and I will announce it in the comment section.

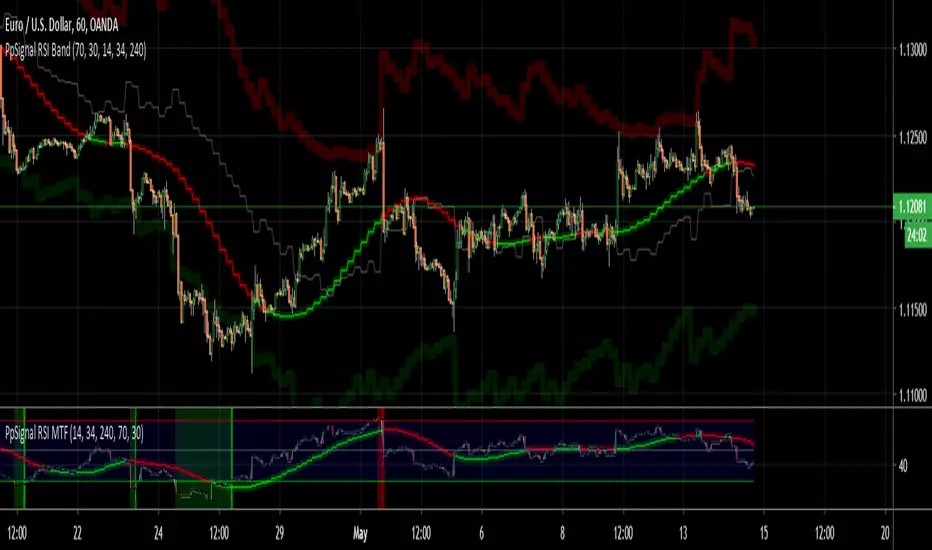
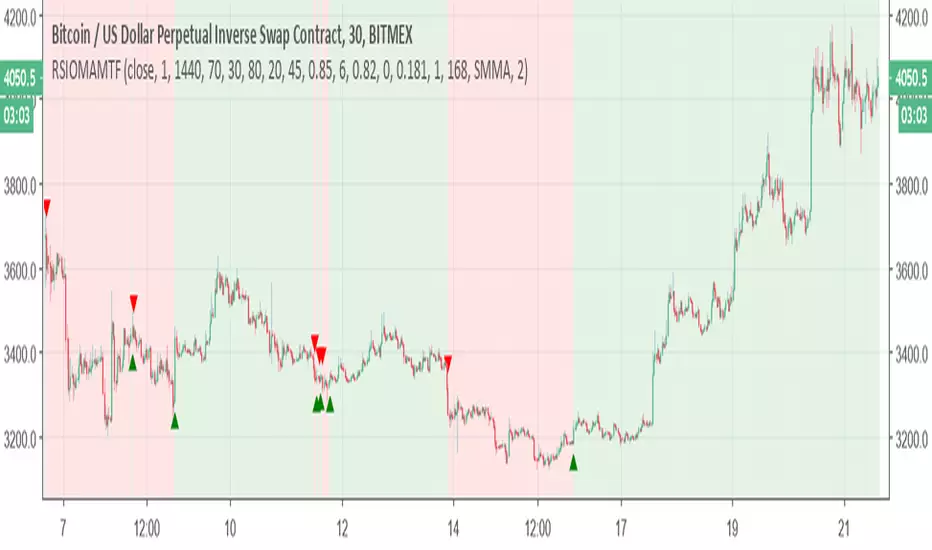
Relative Strength Index of Moving Average MTF alertsAll credit to this study is for chris jhoncic , this is MTF version with alert of his study
basic idea is hybrid of RSI and different MA
You can choose which MA from the following list:
Tillson Moving Average (T3)
Double Exponential Moving Average ( DEMA )
Arnaud Legoux Moving Average ( ALMA )
Least Squares Moving Average ( LSMA )
Simple Moving Average ( SMA )
Exponential Moving Average ( EMA )
Weighted Moving Average ( WMA )
Smoothed Moving Average ( SMMA )
Triple Exponential Moving Average ( TEMA )
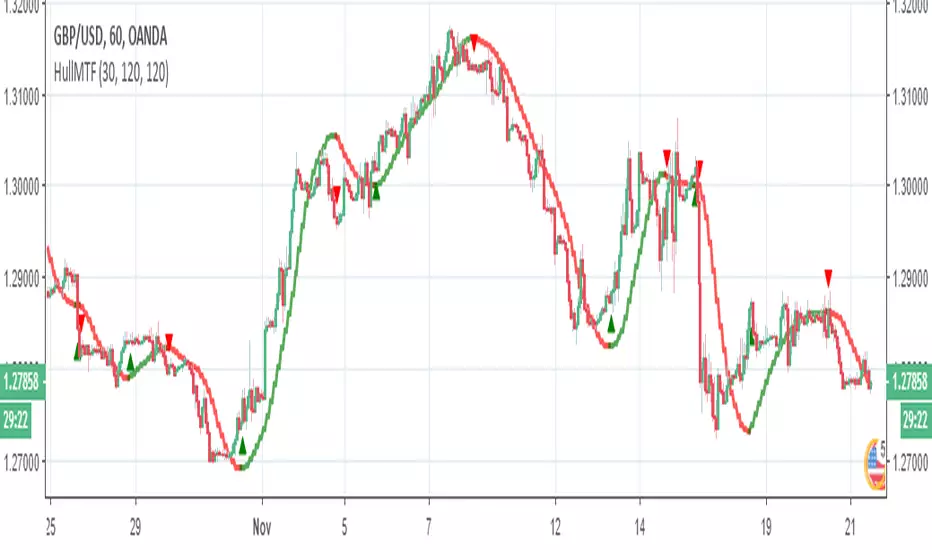
Hull Moving Average ( HMA )
Adaptive moving average (AMA)
Fractal Adaptive Moving Average (FAMA)
Variable Index Dynamic Average ( VIDYA )
Triangular Moving Average (TRIMA)
to change the time frame change int2 to what you desire
SMA over-MTF (Tsma=time SMA)not something fancy but easy tool to see where the coin exist
I create MTF SMA line (tsma) blue color line -you can change the length by using int2 to any min frame that you want (here its 240 min tsma over 30 min graph)
and crossing of regular speed SMA will make us the color signals
easy to help you to see where the coin exist and to avoid stupid longs or shorts

[CR] BTCLONG_SHORT MTF RSI DIVComparing BTCLONG and BTCSHORTS RSI on BITFINEX
+MTF
+RSI
+Difference
Simple indicator to show long/short contract association, including relative difference.

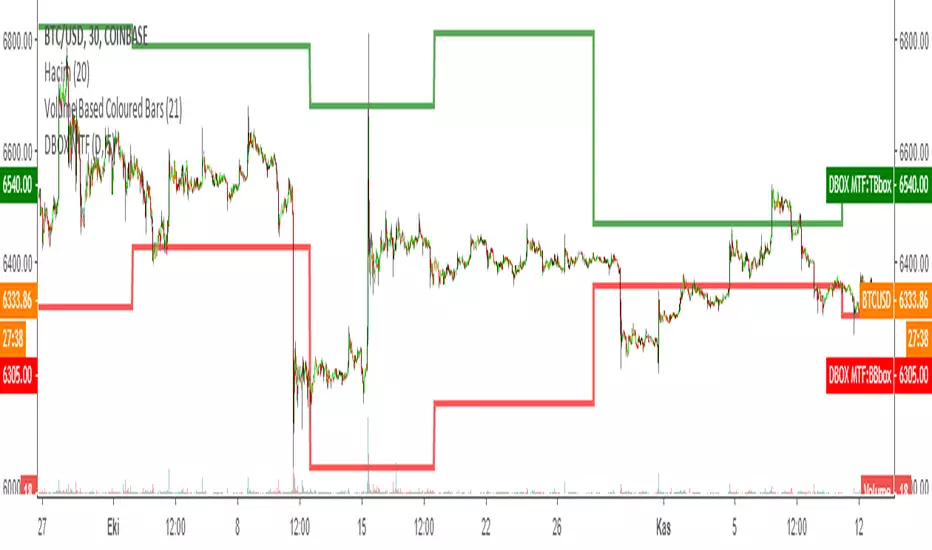
MOST MTFMULTIPLE TIME FRAME version of MOST indicator.
You can view various time frame levels on one chart with MTF.
MOST : Moving Stop Loss Indicator
Developed by economist Anıl ÖZEKŞİ for MATRİKS TRADER platform.
This indicator is like a trailing stop indicator but differs in two ways.
First, trailing stops often uses price bars to determine the stop level, but MOST uses an adjustable percent of the Exponential Moving Average of the price which smooths the sudden price moves.
The second thing is that MOST gives BUY and SELL signals instead of giving one way signals for price action.
MOST has an EMA and a trailing percent stop level of EMA that can be adjusted by changing the length of the EMA and %percent of the stop level.
BUY when ExMoV crosses above MOST
LONG CONDITION when ExMov is above MOST
SELL whenExMov crosses below MOST
SHORT CONDITION when ExMov is below MOST
Developed by Anıl ÖZEKŞİ teknikanalizsanati.com
İndikatörü geliştiren: Anıl ÖZEKŞİ teknikanalizsanati.com

ICHIMOKU MTFMultiple Time Frame Version of Ichimoku Kinko Hyo Indicator.
Created in 1940's by Goichi Hosoda withe the help of University students in Japan.
Ichimoku is one of the best trend following indicators that works nearly perfect in all markets and time frames.
Ichimoku is originally an built in indicator in Tradingview but there are some problems like:
the indicator hast 5 lines but you can change only 4 parameters in the settings menu of Tradingview Charts which you could only control 3 of the lines effectively. A second problem is that Tradingview preferred to use English titles for the ICHIMOKU lines instead of giving them the most common original Japanese ones. (So I rewrite the indicator)
Kijun Sen (blue line): Also called standard line or base line, this is calculated by averaging the highest high and the lowest low for the past 26 periods.
Tenkan Sen (red line): This is also known as the turning line and is derived by averaging the highest high and the lowest low for the past nine periods.
Chikou Span (Plum line): This is called the lagging line. It is today’s closing price plotted 26 periods behind.
Senkou SpanA (green line): The first Senkou line is calculated by averaging the Tenkan Sen and the Kijun Sen and plotted 26 periods ahead.
Senkou SpanB (purple line):
The second Senkou line is determined by averaging the highest high and the lowest low for the past 52 periods and plotted 26 periods ahead.
PERSONALLY I ADVISE YOU TO USE ICHIMOKU WITH DEAFULT LENGTHS (9,26,26,52,26) IN ORDER FOR STOCK MARKETS AND FOREX MARKETS
FOR CRYPTO YOU'D BETTER USE:
10,30,30,60,30 OR 20,60,60,120,60
THE TRICKY THING IS THAT KEEPING THE 1-3-3-6-3 RATIO CONSTANT IS NECESSARY
Here's a link of my Youtube video explaining ICHIMOKU but unfortunately only in TURKISH:
www.youtube.com
Developed by: Goichi Hosoda
Here's the link to a complete list of all my indicators:
tr.tradingview.com
Ichimoku kullanımı anlattığım detaylı video serisini linkten izleyebilirsiniz:
www.youtube.com
İndikatörü geliştiren: Goichi Hosoda

DARVAS BOX MTFMULTIPLE TIME FRAME VERSION OF DARVAS BOX:
You can view different time frame values of Darvas Box levels on any chart
What Is the Darvas Box?
The Darvas Box strategy was developed by Nicholas Darvas. Aside from being a well known dancer, he began trading stock in the 1950s. Based on his success in trading, he was approached to write a book on his strategy. The book, “How I Made $2,000,000 in the Stock Market,” outlines his rather simple approach … simple once you understand the basic concepts and rationale of the strategy.
Darvas Box is an indicator that simply draws lines along highs and lows, and then adjusts them as new highs and lows form. The indicator is available on many trading platforms, such as Thinkorswim. Traders may wish to draw their own boxes though, based on recent highs and lows; Darvas was able to do so (based on telegram quotes) more than half a century ago.
Darvas Box Rules
I shall not follow advisory services.
I shall be cautious of broker advice.
I shall ignore Wall Street sayings or truisms, no matter how ancient or revered.
I shall only trade stocks on major exchanges with adequate volume .
I shall not listen to (or trade off of) rumors or tips, no matter how well researched they may sound.
I will use a sound strategy instead of gamble…I must study this strategy (originally this approach was fundamental analysis , which didn’t work for him, so he developed his Darvas Box trading method).
I will hold one position for longer, as opposed to juggling a bunch of positions for a short period of time.
Darvas looked for increasing volume when selecting stocks to trade; this alerted him to stocks that were being accumulated and were likely to see strong trends.
Darvas believed in buying stocks that presented an upper box limit breakout, but also had an upward Earnings trend. This was especially the case when the major indexes had experienced a decline.
When an upper box limit is broken, buy. From his book, the entry price was usually about 1 to 2% above the upper box limit.
If you enter a trade and the price proceeds to drop out of the new box, and back into the old box, exit the trade.
Entry and stop loss orders should be set in advance, so trades aren’t missed and risk is controlled.
Place, and trail the stop loss order to below the low of the most recent box. This initial stop loss was pretty tight, because Darvas assumed when a price broke out of an old box, it was entering a new box. Therefore, the stop was placed just below the high of old box which was just broken (low of new box).
Record trades, including reasons why you entered and exited.
General conditions of the market must favor buying. Don’t buy stocks when the major indexes are in a bear market, or when volume is flat or declining.
If you are stopped out, but the price moves back into the higher box again providing another buy signal, buy again, using the same stop loss location.
Since the stop is being trailed up, more funds can be added on each consecutive breakout.
The Bottom Line
Nicholas Darvas was a dancer, but committed a great deal of time to developing and then mastering his stock trading method. It’s a trend following method based on breakouts to higher boxes. Risk is controlled by placing a stop below new higher boxes as they form. During choppy conditions the strategy won’t be profitable. This is why Darvas also attempted to only trade stocks with increasing volume and rising Earnings . Trading his method requires a lot of discipline, but can produce big profits when strong trends develop.
source: traderhq.com
Creator: Nicholas DARVAS
Here's the link to a complete list of all my indicators:
tr.tradingview.com
Şimdiye kadar paylaştığım indikatörlerin tam listesi için: tr.tradingview.com