Multi Time Frame Supporting Candles (with EMA/VWAP)Overview
This script provides a clean and, most importantly, correctly-scaled Multi-Time-Frame (MTF) analysis panel. It displays the candles of a higher timeframe (e.g., 1-hour candles while you are on a 5-minute chart) in a separate pane below your main chart.
Crucially, it solves a common Pine Script scaling issue, allowing you to plot indicators like EMA and VWAP from the higher timeframe alongside the candles without distorting the display. This tool is essential for traders who practice Multi-Time-Frame Analysis, helping you stay aware of the larger trend context while executing trades on a lower timeframe.
Cari dalam skrip untuk "mtf"

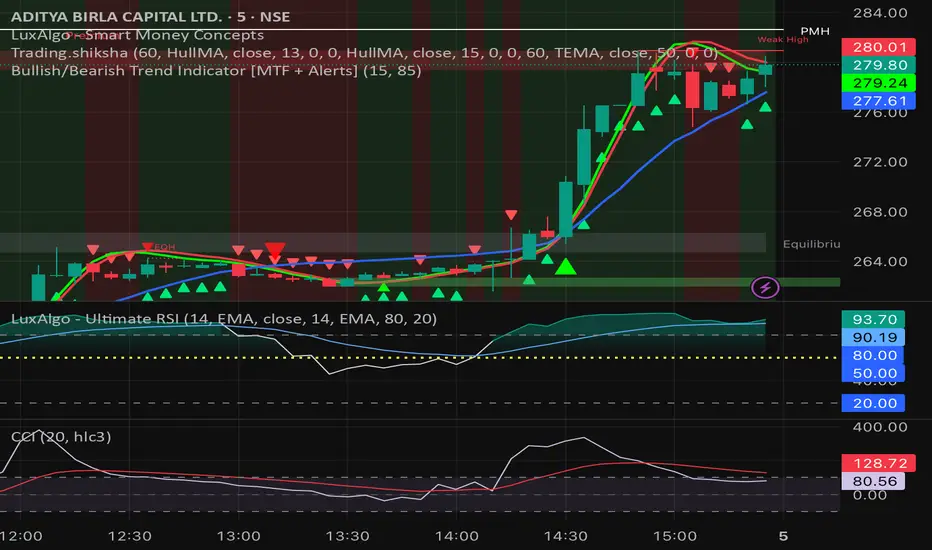
Bullish/Bearish Trend Indicator [MTF + Alerts] by Dow theory Summary of Logic:
✅ Bullish Trend:
Setup Bar: High > Previous High AND Low ≥ Previous Low
Confirmation Bar: High > Highest High of last 3 candles, Low ≥ Setup Bar Low
Trend Continues Until: Latest candle breaks 2nd last candle’s low → then trend becomes Bearish
🔻 Bearish Trend:
Setup Bar: Low < Previous Low AND High ≤ Previous High
Confirmation Bar: Low < Lowest Low of last 3 candles, High ≤ Setup Bar High
Trend Continues Until: Latest candle breaks 2nd last candle’s high → then trend becomes Bullish
SITFX_FuturesSpec_v17SITFX_FuturesSpec_v17 – Universal Futures Contract Library
Full-scale futures contract specification library for Pine Script v6. Covers CME, CBOT, NYMEX, COMEX, CFE, Eurex, ICE, and more – including minis, micros, metals, energies, FX, and bonds.
Key Features:
✅ Instrument‑agnostic: ES/MES, NQ/MNQ, YM/MYM, RTY/M2K, metals, energies, FX, bonds
✅ Full contract data: Tick size, tick value, point value, margins
✅ Continuation‑safe: Single‑line logic, no arrays or continuation errors
✅ Foundation for SITFX tools: Gann, Fibs, structure, and risk modules
Usage example:
import SITFX_FuturesSpec_v17/1 as fs
spec = fs.get(syminfo.root)
label.new(bar_index, high, str.format("{0}: Tick={1}, Value=${2}", spec.name, spec.tickSize, spec.tickValue))

MACD H4 on M15 ChartThis script displays the MACD from the H4 (4-hour) timeframe while viewing the chart in M15 (15-minute). It shows the H4 MACD line, signal line, and histogram for multi-timeframe (MTF) analysis. Use it to anticipate trend shifts on lower timeframes with confirmation from the higher timeframe MACD structure.

Swing Strategy MTF with Auto SL/TP + Weekly Pivotsested and Working Notes:
Works on any intraday chart (like 1H or 4H)
Uses Daily trend for confirmation by default
Adjust trend EMAs or pivot TF if needed
Wait for a signal label after candle close
Targets and SL are drawn automatically
—

Advanced ICT Theory - A-ICT📊 Advanced ICT Theory (A-ICT): The Institutional Manipulation Detector
Are you tired of being the liquidity? Stop chasing shadows and start tracking the architects of price movement.
This is not another lagging indicator. This is a complete framework for viewing the market through the lens of institutional traders. Advanced ICT Theory (A-ICT) is an all-in-one, military-grade analysis engine designed to decode the complex language of "Smart Money." It automates the core tenets of Inner Circle Trader (ICT) methodology, moving beyond simple patterns to build a dynamic, real-time narrative of market manipulation, liquidity engineering, and institutional order flow.
AIT provides a living blueprint of the market, identifying high-probability zones, tracking structural shifts, and scoring the quality of setups with a sophisticated, multi-factor algorithm. This is your X-ray into the market's true intentions.
🔬 THE CORE ENGINE: DECODING THE THEORY & FORMULAS
A-ICT is built upon a sophisticated, multi-layered logic system that interprets price action as a story of cause and effect. It does not guess; it confirms. Here is the foundational theory that drives the engine:
1. Market Structure: The Blueprint of Trend
The script first establishes a deep understanding of the market's skeleton through multi-level pivot analysis. It uses ta.pivothigh and ta.pivotlow to identify significant swing points.
Internal Structure (iBOS): Minor swings that show the short-term order flow. A break of internal structure is the first whisper of a potential shift.
External Structure (eBOS): Major swing points that define the primary trend. A confirmed break of external structure is a powerful statement of trend continuation. AIT validates this with optional Volume Confirmation (volume > volumeSMA * 1.2) and Candle Confirmation to ensure the break is driven by institutional force, not just a random spike.
Change of Character (CHoCH): This is the earthquake. A CHoCH occurs when a confirmed eBOS happens against the prevailing trend (e.g., a bearish eBOS in a clear uptrend). A-ICT flags this immediately, as it is the strongest signal that the primary trend is under threat of reversal.
2. Liquidity Engineering: The Fuel of the Market
Institutions don't buy into strength; they buy into weakness. They need liquidity. A-ICT maps these liquidity pools with forensic precision:
Buyside & Sellside Liquidity (BSL/SSL): Using ta.highest and ta.lowest, AIT identifies recent highs and lows where clusters of stop-loss orders (liquidity) are resting. These are institutional targets.
Liquidity Sweeps: This is the "manipulation" part of the detector. AIT has a specific formula to detect a sweep: high > bsl and close < bsl . This signifies that institutions pushed price just high enough to trigger buy-stops before aggressively selling—a classic "stop hunt." This event dramatically increases the quality score of subsequent patterns.
3. The Element Lifecycle: From Potential to Power
This is the revolutionary heart of A-ICT. Zones are not static; they have a lifecycle. AIT tracks this with its dynamic classification engine.
Phase 1: PENDING (Yellow): The script identifies a potential zone of interest based on a specific candle formation (a "displacement"). It is marked as "Pending" because its true nature is unknown. It is a question.
Phase 2: CLASSIFICATION: After the zone is created, AIT watches what happens next. The zone's identity is defined by its actions:
ORDER BLOCK (Blue): The highest-grade element. A zone is classified as an Order Block if it directly causes a Break of Structure (BOS) . This is the footprint of institutions entering the market with enough force to validate the new trend direction.
TRAP ZONE (Orange): A zone is classified as a Trap Zone if it is directly involved in a Liquidity Sweep . This indicates the zone was used to engineer liquidity, setting a "trap" for retail traders before a reversal.
REVERSAL / S&R ZONE (Green): If a zone is not powerful enough to cause a BOS or a major sweep, but still serves as a pivot point, it's classified as a general support/resistance or reversal zone.
4. Market Inefficiencies: Gaps in the Matrix
Fair Value Gaps (FVG): AIT detects FVGs—a 3-bar pattern indicating an imbalance—with a strict formula: low > high (for a bullish FVG) and gapSize > atr14 * 0.5. This ensures only significant, volatile gaps are shown. An FVG co-located with an Order Block is a high-confluence setup.
5. Premium & Discount: The Law of Value
Institutions buy at wholesale (Discount) and sell at retail (Premium). AIT uses a pdLookback to define the current dealing range and divides it into three zones: Premium (sell zone), Discount (buy zone), and Equilibrium. An element's quality score is massively boosted if it aligns with this principle (e.g., a bullish Order Block in a Discount zone).
⚙️ THE CONTROL PANEL: A COMPLETE GUIDE TO THE INPUTS MENU
Every setting is a lever, allowing you to tune the AIT engine to your exact specifications. Master these to unlock the script's full potential.
🎯 A-ICT Detection Engine
Min Displacement Candles: Controls the sensitivity of element detection. How it works: It defines the number of subsequent candles that must be "inside" a large parent candle. Best practice: Use 2-3 for a balanced view on most timeframes. A higher number (4-5) will find only major, more significant zones, ideal for swing trading. A lower number (1) is highly sensitive, suitable for scalping.
Mitigation Method: Defines when a zone is considered "used up" or mitigated. How it works: Cross triggers as soon as price touches the zone's boundary. Close requires a candle to fully close beyond it. Best practice: Cross is more responsive for fast-moving markets. Close is more conservative and helps filter out fake-outs caused by wicks, making it safer for confirmations.
Min Element Size (ATR): A crucial noise filter. How it works: It requires a detected zone to be at least this multiple of the Average True Range (ATR). Best practice: Keep this around 0.5. If you see too many tiny, irrelevant zones, increase this value to 0.8 or 1.0. If you feel the script is missing smaller but valid zones, decrease it to 0.3.
Age Threshold & Pending Timeout: These manage visual clutter. How they work: Age Threshold removes old, mitigated elements after a set number of bars. Pending Timeout removes a "Pending" element if it isn't classified within a certain window. Best practice: The default settings are optimized. If your chart feels cluttered, reduce the Age Threshold. If pending zones disappear too quickly, increase the Pending Timeout.
Min Quality Threshold: Your primary visual filter. How it works: It hides all elements (boxes, lines, labels) that do not meet this minimum quality score (0-100). Best practice: Start with the default 30. To see only A- or B-grade setups, increase this to 60 or 70 for an exceptionally clean, high-probability view.
🏗️ Market Structure
Lookbacks (Internal, External, Major): These define the sensitivity of the trend analysis. How they work: They set the number of bars to the left and right for pivot detection. Best practice: Use smaller values for Internal (e.g., 3) to see minor structure and larger values for External (e.g., 10-15) to map the main trend. For a macro, long-term view, increase the Major Swing Lookback.
Require Volume/Candle Confirmation: Toggles for quality control on BOS/CHoCH signals. Best practice: It is highly recommended to keep these enabled. Disabling them will result in more structure signals, but many will be false alarms. They are your filter against market noise.
... (Continue this detailed breakdown for every single input group: Display Configuration, Zones Style, Levels Appearance, Colors, Dashboards, MTF, Liquidity, Premium/Discount, Sessions, and IPDA).
📊 THE INTELLIGENCE DASHBOARDS: YOUR COMMAND CENTER
The dashboards synthesize all the complex analysis into a simple, actionable intelligence briefing.
Main Dashboard (Bottom Right)
ICT Metrics & Breakdown: This is your statistical overview. Total Elements shows how much structure the script is tracking. High Quality instantly tells you if there are any A/B grade setups nearby. Unmitigated vs. Mitigated shows the balance of fresh opportunities versus resolved price action. The breakdown by Order Blocks, Trap Zones, etc., gives you a quick read on the market's recent character.
Structure & Market Context: This is your core bias. Order Flow tells you the current script-determined trend. Last BOS shows you the most recent structural event. CHoCH Active is a critical warning. HTF Bias shows if you are aligned with the higher timeframe—the checkmark (✓) for alignment is one of the most important confluence factors.
Smart Money Flow: A volume-based sentiment gauge. Net Flow shows the raw buying vs. selling pressure, while the Bias provides an interpretation (e.g., "STRONG BULLISH FLOW").
Key Guide (Large Dashboard only): A built-in legend so you never have to guess. It defines every pattern, structure type, and special level visually.
📖 Narrative Dashboard (Bottom Left)
This is the "story" of the market, updated in real-time. It's designed to build your trading thesis.
Recent Elements Table: A live list of the most recent, high-quality setups. It displays the Type , its Narrative Role (e.g., "Bullish OB caused BOS"), its raw Quality percentage, and its final Trade Score grade. This is your at-a-glance opportunity scanner.
Market Narrative Section: This is the soul of A-ICT. It combines all data points into a human-readable story:
📍 Current Phase: Tells you if you are in a high-volatility Killzone or a consolidation phase like the Asian Range.
🎯 Bias & Alignment: Your primary direction, with a clear indicator of HTF alignment or conflict.
🔗 Events: A causal sequence of recent events, like "💧 Sell-side liquidity swept →
📊 Bullish BOS → 🎯 Active Order Block".
🎯 Next Expectation: The script's logical conclusion. It provides a specific, forward-looking hypothesis, such as "📉 Pullback expected to bullish OB at 1.2345 before continuation up."
🎨 READING THE BATTLEFIELD: A VISUAL INTERPRETATION GUIDE
Every color and line is a piece of information. Learn to read them together to see the full picture.
The Core Zones (Boxes):
Blue Box (Order Block): Highest probability zone for trend continuation. Look for entries here.
Orange Box (Trap Zone): A manipulation footprint. Expect a potential reversal after price interacts with this zone.
Green Box (Reversal/S&R): A standard pivot area. A good reference point but requires more confluence.
Purple Box (FVG): A market imbalance. Acts as a magnet for price. An FVG inside an Order Block is an A+ confluence.
The Structural Lines:
Green/Red Line (eBOS): Confirms the trend direction. A break above the green line is bullish; a break below the red line is bearish.
Thick Orange Line (CHoCH): WARNING. The previous trend is now in question. The market character has changed.
Blue/Red Lines (BSL/SSL): Liquidity targets. Expect price to gravitate towards these lines. A dotted line with a checkmark (✓) means the liquidity has been "swept" or "purged."
How to Synthesize: The magic is in the confluence. A perfect setup might look like this: Price sweeps below a red SSL line , enters a green Discount Zone during the NY Killzone , and forms a blue Order Block which then causes a green eBOS . This sequence, visible at a glance, is the story of a high-probability long setup.
🔧 THE ARCHITECT'S VISION: THE DEVELOPMENT JOURNEY
A-ICT was forged from the frustration of using lagging indicators in a market that is forward-looking. Traditional tools are reactive; they tell you what happened. The vision for A-ICT was to create a proactive engine that could anticipate institutional behavior by understanding their objectives: liquidity and efficiency. The development process was centered on creating a "lifecycle" for price patterns—the idea that a zone's true meaning is only revealed by its consequence. This led to the post-breakout classification system and the narrative-building engine. It's designed not just to show you patterns, but to tell you their story.
⚠️ RISK DISCLAIMER & BEST PRACTICES
Advanced ICT Theory (A-ICT) is a professional-grade analytical tool and does not provide financial advice or direct buy/sell signals. Its analysis is based on historical price action and probabilities. All forms of trading involve substantial risk. Past performance is not indicative of future results. Always use this tool as part of a comprehensive trading plan that includes your own analysis and a robust risk management strategy. Do not trade based on this indicator alone.
観の目つよく、見の目よわく
"Kan no me tsuyoku, ken no me yowaku"
— Miyamoto Musashi, The Book of Five Rings
English: "Perceive that which cannot be seen with the eye."
— Dskyz, Trade with insight. Trade with anticipation.

Combined Predictive Indicator### Combined Predictive Zones & Levels
This indicator is a powerful hybrid tool designed to provide a comprehensive map of potential future price action. It merges two distinct predictive models into a single, cohesive view, helping traders identify key levels of support, resistance, and areas of high confluence.
#### How It Works: Two Models in One
This script is built on two core components that you can use together or analyze separately:
**Part 1: Classic Range & Fibonacci Prediction**
This model uses classic technical analysis principles to project a potential range for the upcoming price action.
* **Highest High / Lowest Low:** It identifies the significant trading range over a user-defined lookback period.
* **Fibonacci Levels:** It automatically plots key Fibonacci retracement levels (e.g., 38.2% and 61.8%) within this range, which often act as critical support or resistance.
* **ATR & Average Range:** It calculates a "predicted" upper and lower boundary based on the average historical range and current volatility (ATR).
**Part 2: Advanced Predictive Ranges (Self-Adjusting Channels)**
This is a dynamic model that creates adaptive support and resistance zones based on a smoothed average price and volatility.
* **Dynamic Average:** It uses a unique moving average that only adjusts when the price moves significantly, creating a stable baseline.
* **ATR-Based Zones:** It projects multiple levels of support (S1, S2) and resistance (R1, R2) around this average, which widen and narrow based on market volatility. These zones often signal areas where price might stall or reverse.
#### Key Features:
* **Hybrid Model for Confluence:** The true power of this indicator lies in finding where the levels from both models overlap. A Fibonacci level aligning with a Predictive Range support zone is a much stronger signal.
* **Comprehensive Data Table:** A clean, on-chart table displays the precise values of all key predictive levels, allowing for quick reference and precise trade planning.
* **Multi-Timeframe (MTF) Capability:** The Advanced Predictive Ranges can be calculated on a higher timeframe, giving you a broader market context.
* **Fully Customizable:** All lengths, multipliers, and levels for both models are fully adjustable in the settings to fit any asset or trading style.
* **Clear Visuals:** All zones and levels are color-coded for intuitive and easy-to-read analysis.
#### How to Use:
1. Look for areas of **confluence** where multiple levels from both models cluster together. These are high-probability zones for price reactions.
2. Use the Predictive Range zones (S1/S2 and R1/R2) as potential targets for trades or as areas to watch for entries and exits.
3. Pay attention to the on-chart table for exact price levels to set limit orders or stop-losses.
**Disclaimer:** This script is an analytical tool for educational purposes and should not be considered financial advice. All trading involves risk. Past performance is not indicative of future results. Always use this indicator as part of a comprehensive trading strategy with proper risk management.
Feedback is welcome! If you find this tool useful, please leave a like.

Advanced Trend Panel v3.1This is a comprehensive dashboard indicator designed to give traders a multi-faceted view of the market at a single glance. It combines key indicators across multiple timeframes, calculates trend duration, and presents all information in a clean, color-coded table. This tool is perfect for confirming trade ideas, identifying trend alignment, and understanding the underlying market dynamics.
#### Key Features:
* **All-in-One Dashboard:** A convenient on-chart table summarizes the state of multiple key indicators, saving you screen space and time.
* **Multi-Timeframe (MTF) Forecast:** Analyzes the long-term trend on a higher timeframe (e.g., Daily) to provide context for the current chart's trend.
* **Trend Analysis:** Uses dual sets of EMAs (long-term and short-term) to define the primary and immediate trend directions.
* **Trend Duration:** A unique feature that calculates how long the current short-term and long-term trends have been active, helping you gauge trend maturity.
* **Core Indicators Included:**
* **ADX:** Measures trend strength to differentiate between strong trends and weak or sideways markets.
* **RSI:** Identifies overbought and oversold conditions.
* **Point of Control (POC):** Shows the price level with the highest traded volume over a lookback period, acting as a key level of support/resistance.
* **Volume:** Compares current volume to its moving average to spot unusual activity.
* **Customizable Alerts:** Set up alerts for trend changes (long-term or short-term), RSI crossing into overbought/oversold zones, or shifts in ADX trend strength.
#### How to Use:
1. Apply the indicator to your chart.
2. In the settings, configure the timeframes, indicator lengths, and display options to match your trading style.
3. Use the table to quickly assess if the long-term trend, short-term trend, and momentum are aligned.
4. Enable alerts to be notified of key changes in market conditions without having to watch the chart constantly.
**Disclaimer:** This script is for educational purposes only and should not be considered financial advice. All trading involves risk. Past performance is not indicative of future results. Please backtest and use this tool as part of a comprehensive trading plan with proper risk management.
Feedback is always welcome! If you find this indicator useful, please leave a like.

EMA+ATR Band MTF Trend EntryThis is a Multi-Timeframe Trend Trading indicator strategy adapted from Sahil Rohmehtra’s Mentorship programme. The trading decision is made by first accessing the trend in higher timeframe (say Monthly) by using TWO EMAs. If the faster EMA (say 20 period) is above Slower EMA (say 50 period) and the price is above slower EMA then the trend is suitable for buyers. Similarly if faster EMA is below slow EMA and the price is below that then trend is suitable for sellers.
Once we access the trend in the higher timeframe we move to the lower timeframe (say Weekly) and access the 5-period RSI value. If RSI is below 30 then we can prepare for possible buy entry in lower (Daily) timeframe if entry conditions are met in daily timeframe. Similarly sell bias can be initiated when the higher timeframe EMA trend is down, daily RSI is above 70 and sell entry condition is met in daily timeframe. The RSI thresholds can be changed by the user.
Once we identified the RSI bias then wait for the confirmation candle in the lower timeframe (say 1 hour). In the entry timeframe we plot a band of 20 EMA of LOWs ± 1 ATR lines. Here,we wait for a candle to close above the 20 EMA of LOWs + 1 ATR for a buy signal with an increase in On Balance Volume (OBV) value. Similarly for sell signal we should get a candle close below the 20 EMA of LOWs - 1 ATR with corresponding change in OBV. This candle is the signal candle.
Once we get a Buy or Sell signal the corresponding stop loss is the nearest LOW - 1 ATR or HIGH + 1 ATR. The ATR scaling may be changed by the user. Now if another candle closes above the high of the buy signal candle then enter on buy. If the low of the buy signal candle is broken then it is a potential short-term sell entry. Similarly if another candle closes below the sell signal candle then enter short and if there is a close above high of the signal candle then it is a potential buy entry.

Futures Trade Entry Indicator (MTF)Work in Progress with the help of Claude. Not ready for active trading. Public for help improving. This will be a multi-timeframe futures trading indicator with supply/demand zones, Fair Value Gaps (FVGs), and sophisticated entry/exit logic.I've created a comprehensive Pine Script v6 indicator that matches all your specifications! Here's what the script includes:
## **Key Features Implemented:**
### **🔄 Multi-Timeframe Logic**
- **1H Chart Data**: Detects Supply Zones, Demand Zones, and Fair Value Gaps
- **Current Timeframe**: Monitors for re-entry and confirmation signals
### **📊 Zone Detection**
- **Supply Zones**: Identified using pivot highs with configurable strength
- **Demand Zones**: Identified using pivot lows with touch validation
- **Fair Value Gaps**: Both bullish and bearish FVGs detected automatically
- **Auto-Expiry**: Zones expire after 24 hours (configurable)
### **⚡ Entry Logic**
- **Dual Confirmation Required**:
- ✅ Engulfing candle pattern (bullish/bearish)
- ✅ Market structure shift (HH→LL or LL→HH)
- **Zone Re-entry**: Price must be within identified zones/FVGs
### **🎯 Probability System**
- **Smart Scoring**: Based on zone age, strength, and risk/reward ratio
- **Color-Coded**: Green (High), Yellow (Medium), Red (Low)
- **Real-time Calculation**: Updates with each potential entry
### **🎨 Visual Elements**
- **Colored Zones**: Supply (red), Demand (green), FVGs (blue/orange)
- **Entry Labels**: 🟩 LONG / 🟥 SHORT markers
- **Probability Labels**: Display confidence levels
- **Confirmation Shapes**: Triangle indicators for pattern completion
### **⚙️ Manual Controls**
All the requested toggles are available in the settings panel:
- Show/Hide Supply Zones
- Show/Hide Demand Zones
- Show/Hide FVGs
- Show/Hide Labels
- Show/Hide Probability
- Zone strength and expiry settings
- Custom colors for all elements
### **🔔 Alert System**
- Entry opportunity alerts
- Includes probability assessment
- Ticker symbol identification
## **Usage Instructions:**
1. **Apply to 15m chart** for active trading signals
2. **Configure settings** based on your preferences
3. **Set up alerts** for automated notifications
4. **Monitor probability levels** for trade quality assessment
The script automatically handles the complex multi-timeframe analysis while keeping the interface clean and user-friendly. All zones update dynamically and expire appropriately to avoid clutter.
Would you like me to adjust any specific parameters or add additional features?

Smart Deviation Trend Bands PRO + MTF Filter📌 Purpose
This indicator combines multi-level Deviation Bands (±1, ±2, ±3 standard deviations from SMA) with a Higher Timeframe (HTF) Trend Filter.
It helps traders identify potential bounce and breakout setups aligned with the dominant market trend.
🧠 How It Works
1. Deviation Bands
SMA(Length) is calculated as the centerline.
Standard deviations (±1, ±2, ±3) define multiple dynamic support and resistance zones.
Outer bands (±3) often mark overextended zones; inner bands (±1, ±2) show active trading areas.
2. HTF Trend Filter
A higher timeframe SMA (HTF SMA) acts as a trend confirmation tool.
Default filter timeframe: 1 Day.
Trend Up: Price > HTF SMA
Trend Down: Price < HTF SMA
3. Entry Signals
Long Signal: Price crosses above lower deviation band (+1) when HTF trend is UP.
Short Signal: Price crosses below upper deviation band (−1) when HTF trend is DOWN.
4. Visuals & Alerts
Bands plotted in red (upper) and green (lower).
Centerline = SMA in blue.
HTF SMA in orange.
Circles on chart mark entry points; alerts trigger automatically.
📈 How to Use
In trending markets: Trade with the HTF direction, using band touches for entries.
In mean-reversion setups: Outer bands can be used to spot potential overbought/oversold zones.
Combine with volume or price action for confirmation.
Recommended Timeframes: 1h, 4h, D.
Markets: Forex, Crypto, Stocks.
⚙️ Inputs
SMA Length
StdDev Multiplier 1 / 2 / 3
HTF Timeframe (default: D1)
⚠️ Disclaimer
This script is for educational purposes only. It does not constitute financial advice.
Always test thoroughly before live trading.

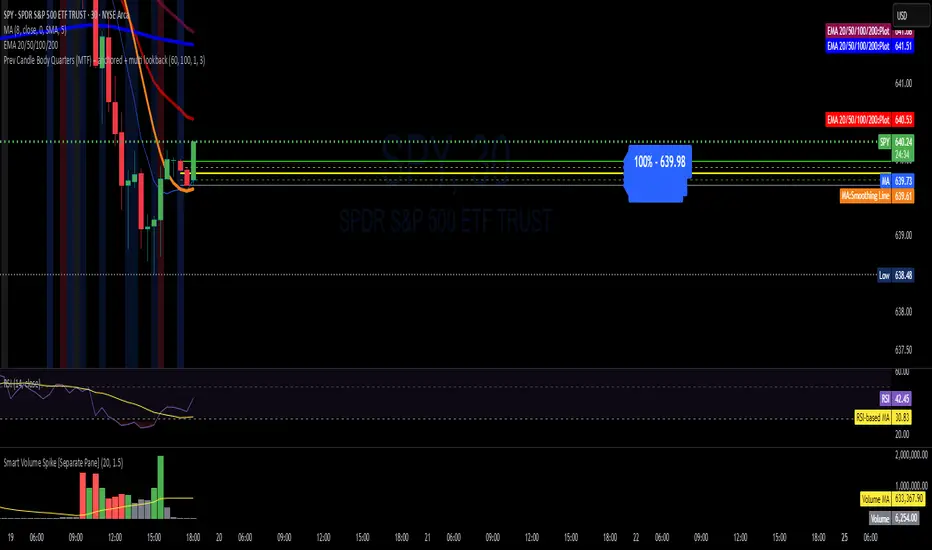
Prev Candle Quarters (MTF) – % + PriceThis TradingView indicator visualizes quarter levels (25%, 50%, 75%, 100%) of the previous candle body from a user-selected higher timeframe, helping traders identify key reaction zones within a candle’s structure.
ulti-Timeframe Input: Choose between 15m, 1H, or 2H candles for your measurement basis.
Body-Based Calculation: Measures from open to close of the previous candle (not wick-to-wick), reflecting where price actually closed.
Precise Quarter Levels: Automatically draws horizontal lines at 25%, 50%, 75%, and 100% of the candle body.
Custom Toggles: Enable or disable each individual level via checkboxes.
Price + % Labels: Each level includes a clean label showing the exact price and corresponding percentage.
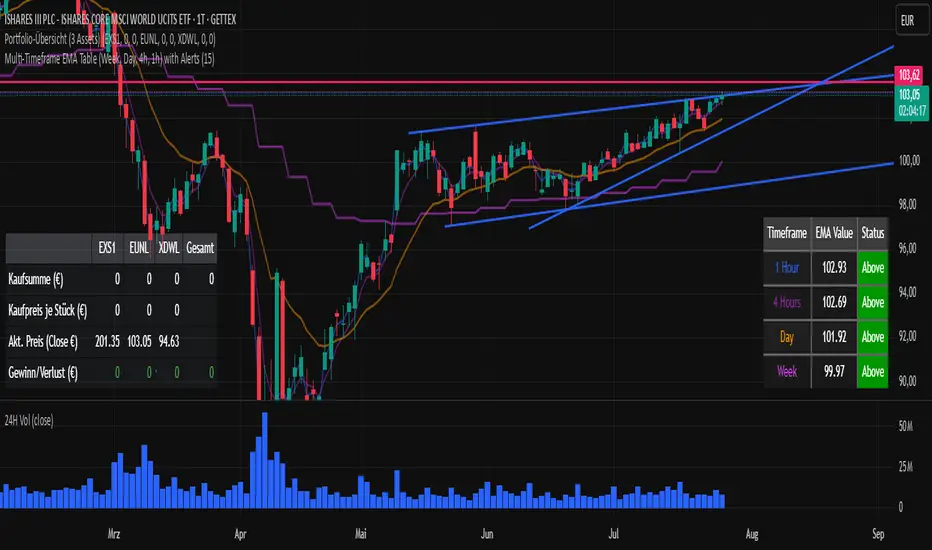
Multi-Timeframe EMA Table (Woche, Tag, 4h, 1h)Title: Multi-Timeframe EMA Table (Weekly, Daily, 4h, 1h)
Description:
This Pine Script indicator provides a concise and clear Multi-Timeframe (MTF) Exponential Moving Average (EMA) analysis directly on your TradingView chart. It displays the EMA values for the 1-hour, 4-hour, 1-day, and 1-week timeframes in a customizable table.
Features:
Clear Table Display: Shows the current EMA values for predefined higher timeframes (1h, 4h, Day, Week).
Dynamic Status: The status column immediately visualizes whether the current price of your chart is above (Green) or below (Red) its respective Multi-Timeframe EMA.
Customizable EMA Length: The length of the EMA can be easily adjusted via the indicator settings, allowing you to tailor it to your preferred analysis.
Visual Confirmation: The corresponding Multi-Timeframe EMA lines are optionally plotted directly on the chart to visually confirm the table values.
Non-Repainting: The displayed EMA values and lines are programmed to be non-repainting, meaning their values do not change on already closed candles.
This indicator is a useful tool for traders who want to quickly get an overview of the EMA's position across different timeframes without constantly switching their chart timeframe. It's ideal for confirming trends and identifying support and resistance levels from a higher perspective.
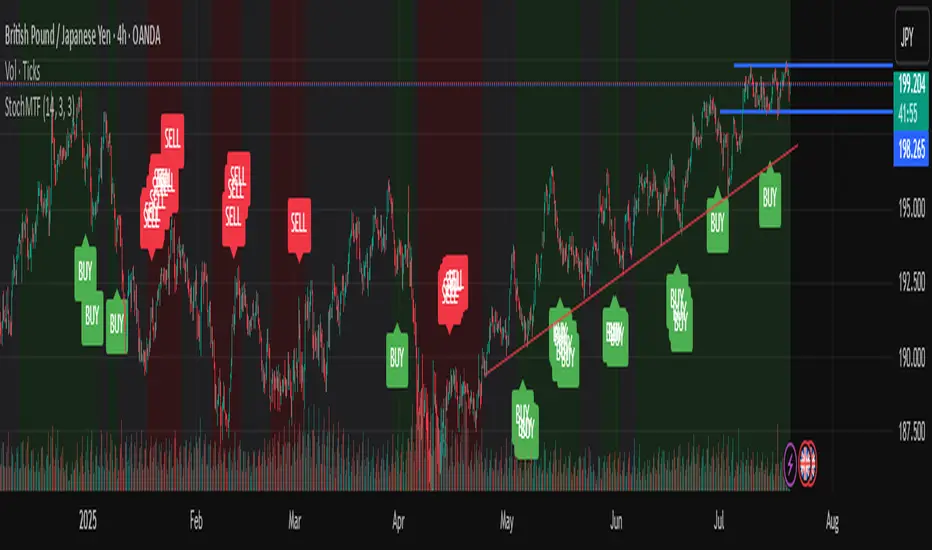
Stochastic Trend Signal with MTF FilterMulti-Timeframe Stochastic Trend Filter – Real Signals with Confirmation Candles
This script is a multi-timeframe Stochastic trend filter designed to help traders identify reliable BUY/SELL signals based on both momentum and higher-timeframe trend context.
It combines three key components:
Entry Signal Logic:
Entry is based on the Stochastic Oscillator (%K, 14,3), where overbought/oversold conditions are detected in the current chart's timeframe.
A green (bullish) candle following a red candle with %K below 20 can trigger a BUY signal.
A red (bearish) candle following a green candle with %K above 80 can trigger a SELL signal.
Trend Confirmation – Daily Filter:
The script uses Stochastic on the 1D (Daily) timeframe to determine whether short-term momentum aligns with a broader daily trend.
BUY signals are only allowed if the Daily %K is above 50.
SELL signals are only allowed if the Daily %K is below 50.
Long-Term Trend Filter – Weekly Stochastic:
A second filter uses Weekly %K:
BUY signals are suppressed if the Weekly trend is bearish (Weekly %K < 50) while Daily %K is bullish (> 50).
SELL signals are suppressed if the Weekly trend is bullish (Weekly %K > 50) while Daily %K is bearish (< 50).
🖼️ The chart background changes color to visually assist users:
Green background: bullish alignment on Daily and Weekly Stochastic.
Red background: bearish alignment.
Gray background: trend conflict (Daily and Weekly disagree).
✅ This script is ideal for swing traders or position traders who want to enter with confirmation while avoiding false signals during trend conflict zones.
🔔 Alerts are provided for BUY and SELL signals once all conditions are met.
How to use:
Apply on timeframe (4H recommended).
Add alerts for "BUY Alert" and "SELL Alert".
Use background color and plotted labels as entry filters.
Disclaimer: This is not financial advice. Always use proper risk management and test on demo accounts first.
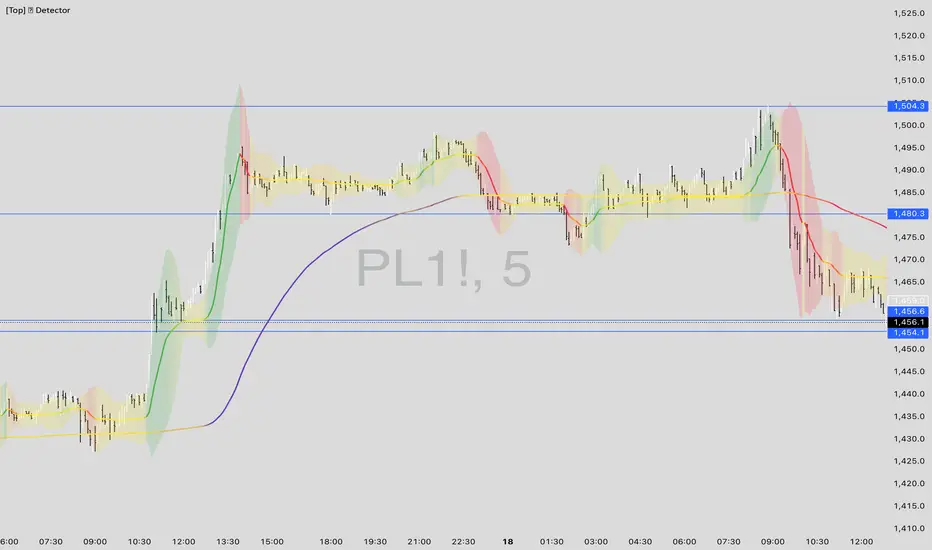
[Top] LHAMA Consolidation DetectorIntroducing the Low-High Adaptive Moving Average (LHAMA 🦙), a powerful tool designed to help traders visually distinguish between trending and consolidating market phases. Unlike traditional moving averages that can produce false signals in choppy markets, the LHAMA is engineered to flatten out during periods of consolidation and become more responsive when a clear trend emerges.
This indicator's primary function is to act as a "Consolidation Detector." When the LHAMA line goes flat and adopts its "Flat Color," it serves as a clear visual cue that the market is range-bound. Conversely, when the line begins to slope and changes to its Bullish or Bearish color, it signals a potential breakout or the start of a new trend.
How It Works
The LHAMA is a type of adaptive moving average. Its adaptiveness is derived from a unique calculation that measures market "trendiness." It does this by tracking whether new highs or new lows are being made within a specified lookback period.
In a Trending Market: When the price consistently makes new highs or lows, the indicator's responsiveness increases, causing the LHAMA to track the price much more closely and responsively.
In a Consolidating Market: When the price is range-bound and fails to make new highs or lows, the responsiveness decreases significantly. This causes the LHAMA to flatten out and become less sensitive to minor price fluctuations, effectively filtering out market noise.
Key Features
Adaptive Calculation: The core engine of the indicator, which automatically adjusts its smoothing based on trend strength.
Slope-Based Coloring: The line's color dynamically changes based on its slope, providing an at-a-glance view of market conditions: bullish, bearish, or flat.
Multi-Line & Multi-Timeframe (MTF): You can enable up to six fully customizable LHAMA lines. Each line can be configured with its own length, colors, and can even be set to a different timeframe, allowing for comprehensive multi-timeframe analysis on a single chart.
Volatility Clouds: Each LHAMA can display an optional cloud around it. The cloud's width is based on your choice of either the Average True Range (ATR) or Standard Deviation (StdDev), offering a visual representation of volatility.
Volume Weighting: An option to incorporate volume into the adaptive calculation, making the LHAMA even more responsive during high-volume price movements.
How to Use
Identify Consolidation: The primary use case. A flat and consistently colored LHAMA line is a strong indication of a sideways or consolidating market. This can help traders avoid taking trend-following trades in choppy conditions.
Confirm Trends: When the LHAMA begins to slope upwards or downwards and changes to its trend color, it can be used to confirm the direction and strength of a new trend. The steeper the slope, the stronger the momentum, and more solid the directional color.
Dynamic Support & Resistance: Like other moving averages, the LHAMA can act as a dynamic level of support in an uptrend or resistance in a downtrend. The optional cloud can further define these zones.
Multi-MA Ribbon Strategy: By enabling multiple LHAMAs with different lengths (e.g., Fibonacci sequence like 14, 21, 34, 55), you can create a ribbon. The expansion of the ribbon indicates a strong trend, while its contraction signals a weakening trend or consolidation.
Settings Explained
Enable 🦙 Line: A simple checkbox to turn each of the six LHAMA lines on or off.
Length: The lookback period for the LHAMA calculation. Shorter lengths are more responsive, while longer lengths are smoother.
Timeframe: Set a specific timeframe for each LHAMA. Leave blank to use the chart's current timeframe.
Volume Weight: If checked, adds volume weighting to make the LHAMA more responsive to high-volume moves.
Colors (Bullish, Bearish, Flat): Customize the colors for each market state. To only see the line during consolidation, set the Bullish and Bearish colors to 100% transparency. To hide the line during consolidation, set the Flat color to 100% transparency.
Color Sensitivity: This is a crucial setting. Because price scales (tick sizes) vary widely between symbols, this setting allows you to adjust the sensitivity of the slope detection. A lower value requires a steeper slope to trigger a trend color, while a higher value is more sensitive.
Recommended settings are provided in the input tooltip as a starting point:
$5 Tick: 0.25 Sensitivity
$1 Tick: 0.75 Sensitivity
$0.25 Tick: 3 Sensitivity
$0.01 Tick: 50 Sensitivity
$0.005 Tick: 100 Sensitivity
Cloud Settings:
Show Cloud: Toggles the visibility of the volatility cloud around the LHAMA.
Width Based On: Choose between "ATR" or "StdDev" to calculate the cloud's width.
Cloud Length & Width: Set the lookback period and multiplier for the ATR/StdDev calculation to control the size of the cloud.
Fractal Pullback Market StructureFractal Pullback Market Structure
Author: The_Forex_Steward
License: Mozilla Public License 2.0
The Fractal Pullback Market Structure indicator is a sophisticated price action tool designed to visualize internal structure shifts and break-of-structure (BoS) events with high accuracy. It leverages fractal pullback logic to identify market swing points and confirm whether a directional change has occurred.
This indicator detects swing highs and lows based on fractal behavior, drawing zigzag lines to connect these key pivot points. It classifies and labels each structural point as either a Higher High (HH), Higher Low (HL), Lower High (LH), or Lower Low (LL). Internal shifts are marked using triangle symbols on the chart, distinguishing bullish from bearish developments.
Break of Structure events are confirmed when price closes beyond the most recent swing high or low, and a horizontal line is drawn at the breakout level. This helps traders validate when a structural trend change is underway.
Users can configure the lookback period that defines the sensitivity of the pullback detection, as well as a timeframe multiplier to align the logic with higher timeframes such as 4H or Daily. There are visual customization settings for the zigzag lines and BoS markers, including color, width, and style (solid, dotted, or dashed).
Alerts are available for each key structural label—HH, HL, LH, LL—as well as for BoS events. These alerts are filtered through a selectable alert mode that separates signals by timeframe category: Low Timeframe (LTF), Medium Timeframe (MTF), and High Timeframe (HTF). Each mode allows the user to receive alerts only when relevant to their strategy.
This indicator excels in trend confirmation and reversal detection. Traders can use it to identify developing structure, validate internal shifts, and anticipate breakout continuation or rejection. It is particularly useful for Smart Money Concept (SMC) traders, swing traders, and those looking to refine entries and exits based on price structure rather than lagging indicators.
Visual clarity, adaptable timeframe logic, and precise structural event detection make this tool a valuable addition to any price action trader’s toolkit.
