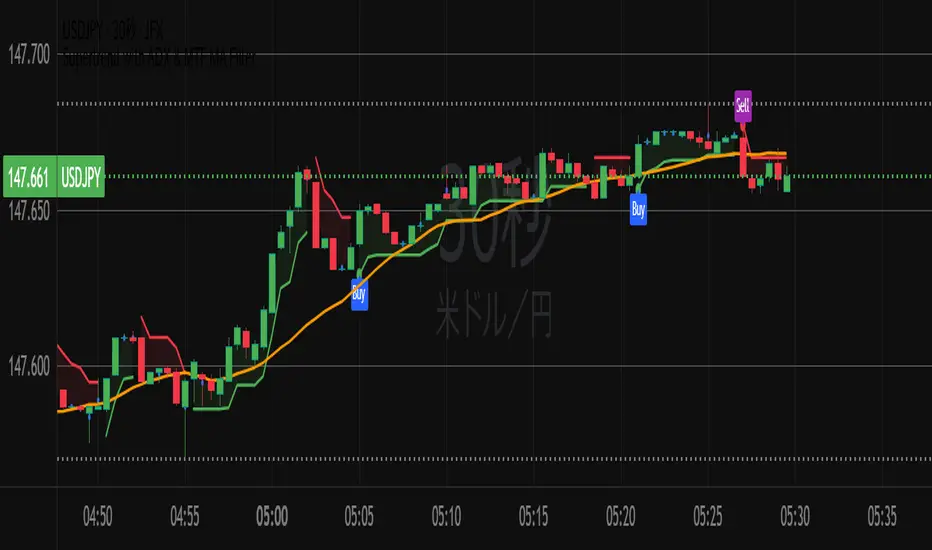
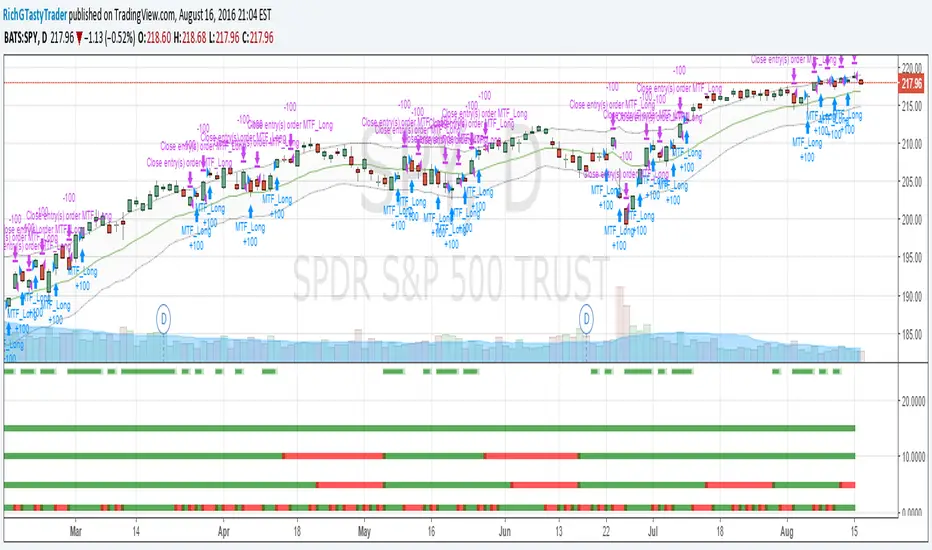
[RichG] Easy MTF Strategy v1.1This is a second attempt at an easy to understand multiple time frame strategy. This one uses ATR for exits. If the position is long, and the price closes below the ATR multiplier, it triggers a close. If the position is short, and the price closes above the ATR/multiplier, it triggers a close. This generates a lot of little trades but is useful because it uses multiple time frames along with cutting losses when the ATR disagrees.
Cari dalam skrip untuk "mtf"
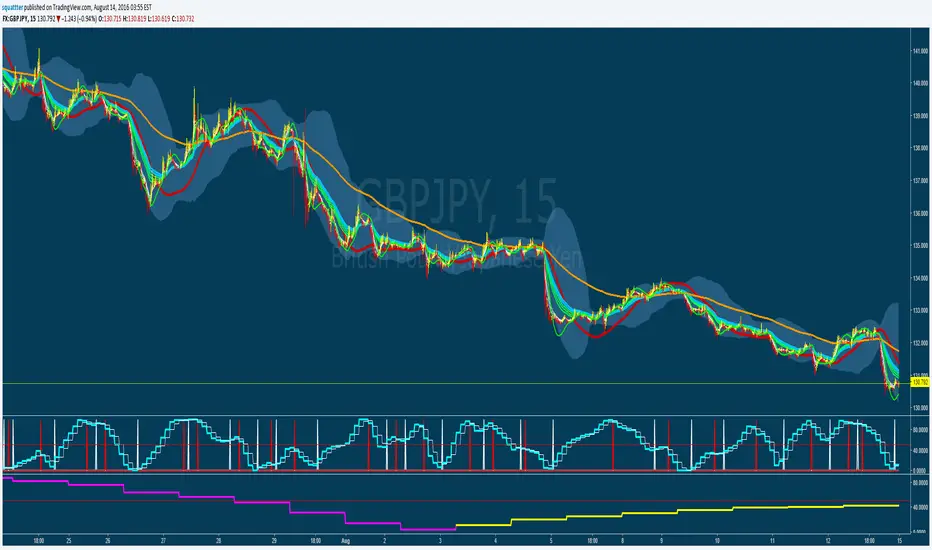
MTF Stochastic CCI ALERTWorks good on 5 or 15min set to the 2hr or 4hr time frame.
Set an alarm (Set an alert on each Long/Short "crossing down", 0.8 (or anything below 0.99), "on condition" )
Or just as a visual.
Best to use other factors to confirm but most of the time it does a pretty decent job.

[RichG] Easy MTF StrategyAs we all know, timeframe agreement is a powerful tool. This strategy uses 4 time frames and the Keltner ATR for entries and exits.

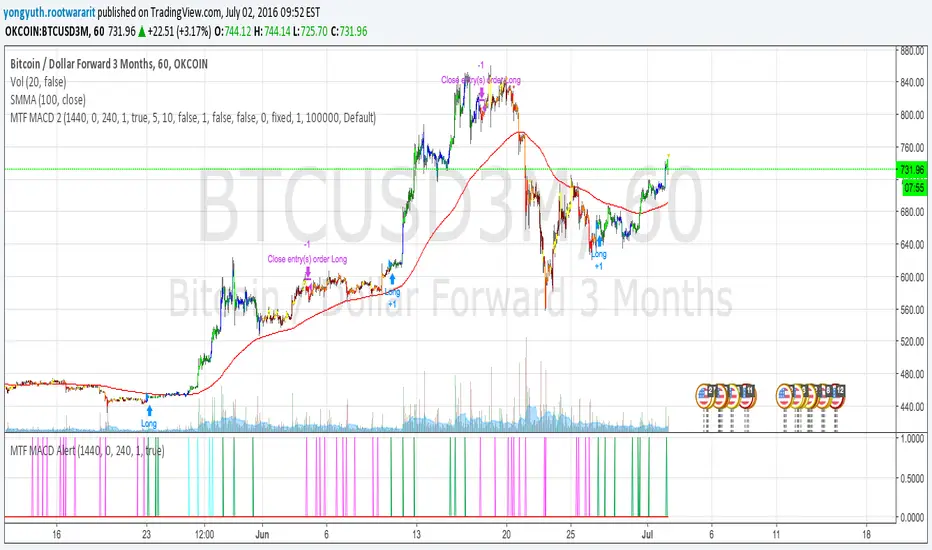
MTF MACD 2 By YuthavithiIf you want a good strategy without repaint. This one might be for you. Excellent profitable for BTCUSD3M for OKCoin.
It uses multiple time frame MACD for trading decision. To avoid repaint, set the delay period = 1 for both long term and midterm.
The idea is that, if long term, mid term and current time frame all agree on traidng direction, the trade will take place.
I also uses it in my automated trading bot with good result.
www.tradingview.com
Target Ladder Pro - MTF ATR + HIT ConfirmationTarget Ladder Pro is a volatility-based target framework that plots multi-timeframe ATR-derived upper and lower reference levels on the price chart and can optionally print HIT confirmations when a defined ATR target is reached.
This script is designed to provide structured volatility context (reach zones, range framing, and objective “target reached” tagging). It does not predict price direction, does not guarantee outcomes, and is not intended as a standalone signal generator.
What This Script Displays
1) Multi-Timeframe ATR Target Ladder (1H / 4H / 1D / 1W)
For each enabled timeframe, the script calculates ATR using higher-timeframe data via request.security() (no lookahead), then plots:
Upper level: Base + ATR × Multiplier
Lower level: Base − ATR × Multiplier
The “Base” can be set to:
the current chart price (for immediate relevance), or
the timeframe’s own close (for a strict MTF reference)
Each timeframe’s upper and lower levels are drawn as price-chart lines.
Last-Bar Target Balloons (per timeframe)
On the last bar, the script prints balloon labels for each timeframe’s upper and lower level. Horizontal x-offsets are configurable per timeframe to keep stacked labels readable.
2) ATR Target + Deviation Bands (Context Layer)
A separate ATR target module calculates a single ATR reference level for the current bar based on candle direction (up/down close relative to the prior close). It also optionally plots:
a mean line (moving average), and
up to four standard-deviation bands (mean ± N × deviation)
These bands provide statistical range context around price.
Target / HIT Labels (per bar)
When enabled:
a Target label marks the computed ATR target level
a HIT label appears when price reaches that target on the same bar (high/low touch rule)
An optional filter can require that the ATR target is inside the first deviation band before printing a HIT label, reducing HIT labels during extended conditions.
Label history can be limited to the most recent N labels or allowed to persist (with a safety cap).
How to Use
Enable the timeframes you want to display (e.g., 1H / 4H / 1D / 1W).
Adjust ATR length and multipliers per timeframe to match the asset’s volatility profile.
Choose whether MTF ladder levels are anchored to current price or the timeframe’s own close.
Use the ladder levels as volatility reach reference zones above and below price.
Use Target/HIT labels as objective “condition occurred” markers for review and journaling.
Notes and Limitations
ATR levels are volatility references, not forecasts or guarantees.
Targets may be reached frequently in high-volatility regimes and rarely in compressed markets.
HIT labels indicate that a defined volatility condition occurred; they do not imply reversal or continuation on their own.
This script is provided for informational and educational purposes only and does not constitute financial advice.

Multi SMA EMA WMA HMA BB (4x3 MAs Bollinger Bands) Pro MTF - RRBMulti SMA EMA WMA HMA 4x3 Moving Averages with Bollinger Bands Pro MTF by RagingRocketBull 2018
Version 1.0
This indicator shows multiple MAs of any type SMA EMA WMA HMA etc with BB and MTF support, can show MAs as dynamically moving levels.
There are 4 MA groups + 1 BB group. You can assign any type/timeframe combo to a group, for example:
- EMAs 50,100,200 x H1, H4, D1, W1 (4 TFs x 3 MAs x 1 type)
- EMAs 8,13,21,55,100,200 x M15, H1 (2 TFs x 6 MAs x 1 type)
- D1 EMAs and SMAs 12,26,50,100,200,400 (1 TF x 6 MAs x 2 types)
- H1 WMAs 7,77,231; H4 HMAs 50,100,200; D1 EMAs 144,169,233; W1 SMAs 50,100,200 (4 TFs x 3 MAs x 4 types)
- +1 extra MA type/timeframe for BB
compile time: 25-30 sec
full redraw time after parameter change in UI: 3 sec
There are several versions: Simple, MTF, Pro MTF, Advanced MTF and Ultimate MTF. This is the Pro MTF version. The Differences are listed below. All versions have BB
- Simple: you have 2 groups of MAs that can be assigned any type (5+5)
- MTF: +2 custom Timeframes for each group (2x5 MTF)
- Pro MTF: +4 custom Timeframes for each group (4x3 MTF), MA levels and show max bars back options
- Advanced MTF: +2 extra MAs/group (4x5 MTF), custom Ticker/Symbol, backreferences for type, TF and MA lengths in UI
- Ultimate MTF: +individual settings for each MA, custom Ticker/Symbols
Features:
- 4x3 = 12 MAs of any type including Hull Moving Average (HMA)
- 4x MTF groups with step line smoothing
- BB +1 extra TF/type for BB MAs
- 12 MA levels with adjustable group offsets, indents and shift
- show max bars back
- you can show/hide both groups of MAs/levels and individual MAs
Notes:
1. based on 3EmaBB, uses plot*, barssince and security functions
2. you can't set certain constants from input due to Pinescript limitations - change the code as needed, recompile and use as a private version
3. Levels = trackprice implementation
4. Show Max Bars Back = show_last implementation
5. uses timeframe textbox instead of input resolution to allow for 120 240 and other custom TFs. Also supports TFs in hours: 2H or H2
6. swma has a fixed length = 4, alma and linreg have additional offset and smoothing params
7. Smoothing is applied by default for visual aesthetics on MTF. To use exact ma mtf values (lines with stair stepping) - disable it
MTF Notes:
- uses simple timeframe textbox instead of input resolution dropdown to allow for 120, 240 and other custom TFs, also supports timeframes in H: 2H, H2
- Groups that are not assigned a Custom TF will use Current Timeframe (0).
- MTF will work for any MA type assigned to the group
- MTF works both ways: you can display a higher TF MA/BB on a lower TF or a lower TF MA/BB on a higher TF.
- MTF MA values are normally aligned at the boundary of their native timeframe. This produces stair stepping when a higher TF MA is viewed on a lower TF.
Therefore X Y Point Density/Smoothing is applied by default on MA MTF for visual aesthetics. Set both to 0 to disable and see exact ma mtf values (lines with stair stepping and original mtf alignment).
- Smoothing is disabled for BB MTF bands because fill doesn't work with smoothed MAs after duplicate values are replaced with na.
- MTF MA Value fluctuation is possible on the current bar due to default security lookahead
Smoothing:
- X,Y == 0 - X,Y smoothing disabled (stair stepping on high TFs)
- X == 0, Y > 0 - X,Y smoothing applied to all TFs
- Y == 0, X > 0 - X smoothing applied to all TFs < deltaX_max_tf, Y smoothing disabled
- X > 0, Y > 0 - Y smoothing applied to all TFs, then X smoothing applied to all TFs < deltaX_max_tf
X Smoothing with Y == 0 - shows only every deltaX-th point starting from the first bar.
X Smoothing with Y > 0 - shows only every deltaX-th point starting from the last shown Y point, essentially filling huge gaps remaining after Y Smoothing with points and preserving the curve's general shape
X Smoothing on high TFs with already scarce points produces weird curve shapes, it works best only on high density lower TFs
Y Smoothing reduces points on all TFs, removes adjacent points with prices within deltaY, while preserving the smaller curve details.
A combination of X,Y produces the most accurate smoothing. Higher delta value - larger range, more points removed.
Show Max Bars Back:
- can't set plot show_last from input -> implemented using a timenow based range check
- you can't delete/modify history once plotted, so essentially it just sets a start point for plotting (from num_bars bars back) that works only in realtime mode (not in replay)
Levels:
You can plot current MA value using plot trackprice=true or by checking Show Price Line in Style. Problem is:
- you can only change color (not the dashed line style, width), have both ma + price line (not just the line), and it's full screen wide
- you can't set plot trackprice from input => implemented using plotshape/plotchar with fixed text labels serving as levels
- there's no other way of creating a dynamic level: hline, plot, offset - nothing else works.
- you can't plot a text var - all text strings must be constants, so you can't change the style, width and text labels without recompiling.
- from input you can only adjust offset, indent and shift for each level group, and change color
- the dot below each level line is the exact MA value. If you want just the line swap plotshape with plotchar, recompile and save as your private version, adjust Y shift.
To speed up redraw times: reduce last_bars to ~2000, recompile and use as your own private version
Pinescript is a rudimentary language (should be called Painscript instead) that can basically only plot data. You can't do much else. Please see the code for tips and hints.
Certain things just can't be done or require shady workarounds and weeks of testing trying to resolve weird node.js compiler errors.
Feel free to learn from/reuse/change the code as needed and use as your own private version. See comments in code. Good Luck!

BB6-MTF-OverlayBB6-MTF-Overlay (Multi-Bollinger Bands, MTF, Overlay)
BB6-MTF-Overlay is a Bollinger Bands overlay indicator that lets you display up to 6 independent BB sets on a single chart, with full MTF (higher timeframe) support.
It’s designed for fast multi-timeframe context—so you can see where price is relative to higher-timeframe BB levels (middle / ±1σ / ±2σ / ±3σ) while trading your current timeframe.
Key Features
Up to 6 Bollinger Band sets displayed simultaneously (overlay)
Per BB set: choose Local (current TF) or MTF (higher TF via security)
Per BB set: Gaps ON/OFF
ON: values may appear only at HTF update points (discontinuous)
OFF: HTF values are filled across lower TF bars (step-like)
Per BB set: Confirmed Bars Mode ON/OFF
ON: uses confirmed HTF values (minimizes repainting)
OFF: follows the in-progress HTF bar (useful for discretionary trading)
Per BB set: toggle visibility for Middle / ±σ1 / ±σ2 / ±σ3 independently
Custom sigma multipliers (e.g., 1.5σ, 0.6σ) for fine tuning
Separate switches for Calculation ON/OFF and Display ON/OFF
Turn off calculations to reduce load, or hide plots only
Typical Use Cases
Use higher timeframe (4H/D/W) BB middle and ±1σ as “structure walls” while executing on lower timeframe
Combine real-time tracking (e.g., 15m BB with Confirmed OFF) with stable HTF anchors (e.g., Daily/Weekly with Confirmed ON)
Keep ±2σ/±3σ OFF by default and enable them only when you need to check range expansion or extremes
Default Preset (Initial Settings)
BB1: 15m MTF (Confirmed Bars Mode OFF)
BB2: 4H MTF (Confirmed Bars Mode OFF)
BB3: Daily MTF (Confirmed Bars Mode ON)
BB4: Weekly MTF (Confirmed Bars Mode ON)
BB5: Monthly MTF (Confirmed Bars Mode ON)
BB6: Calculation OFF / Display OFF
For all active BB sets: σ1 ON by default, σ2 & σ3 OFF by default
Notes
With MTF + Confirmed OFF, band values will move until the higher timeframe bar closes (intended for discretionary use).
If the chart looks too busy, disable unused BB sets or turn off σ2/σ3.
📌 BB6-MTF-Overlay(ボリンジャーバンド6本・MTF対応・Overlay)
BB6-MTF-Overlay は、最大6セットのボリンジャーバンドを同時にチャート上へ重ねて表示できる、MTF(上位足参照)対応のBollinger Bandsインジケーターです。
🕒 15分/4時間/日足/週足/月足など、複数時間軸のボリンジャーを1つのチャートで確認できるため、環境認識(上位足の位置関係)+現在足の判断をスムーズに行えます。
✨ 主な特徴
📈 最大6本のボリンジャーバンドを同時表示(Overlay)
🔁 各BBごとに Local(現在足) / MTF(上位足) を選択可能
🧩 各BBごとに ギャップON/OFF(上位足更新点のみ表示/階段状に埋める表示)を切替
✅ 各BBごとに 確定足モードON/OFF
ON:上位足確定値(リペイント最小)
OFF:進行中の上位足にも追随(裁量補助向け)
🎚️ 各BBごとに ミドル/±σ1/±σ2/±σ3 を個別に表示ON/OFF
🔧 σ値は自由入力(例:1.5σ、0.6σ など微調整可)
⚙️ 計算ON/OFFと表示ON/OFFを分離
表示だけ消す/計算ごと止めて軽くする、の両方に対応
🧠 想定する使い方(例)
🧱 上位足(4H/日足/週足)のミドル・±1σを「壁」として見て、今の足(5分/15分)での反発・抜けを判断
🏃 「15分BB(確定足OFF)」でリアルタイム追随しつつ、「日足/週足(確定足ON)」で大局の位置を固定して確認
🔍 σ2・σ3は普段OFF、必要なときだけONにしてレンジ幅・伸び代を確認
🧾 デフォルト設定(初期状態)
1️⃣ BB1:15分MTF(確定足モードOFF)
2️⃣ BB2:4時間MTF(確定足モードOFF)
3️⃣ BB3:日足MTF(確定足モードON)
4️⃣ BB4:週足MTF(確定足モードON)
5️⃣ BB5:月足MTF(確定足モードON)
6️⃣ BB6:計算OFF/表示OFF
🎛️ 初期表示は全BB共通で「1σのみON(2σ・3σはOFF)」
⚠️ 注意事項
🔄 MTFで「確定足モードOFF(追随)」を使用する場合、上位足が確定するまで値が動くため、見え方が変化します(裁量補助向け)。
🧹 表示本数が増えるとチャートが混み合うため、必要なBBだけ表示ONにする運用がおすすめです。

MA-MTF-12 Overlay📊 MA-MTF-12 Overlay — Indicator Description
■ Overview
MA-MTF-12 Overlay is a multi-timeframe moving average indicator that allows you to display up to 12 moving averages (SMA / EMA) simultaneously, calculated either from the current timeframe (Local) or from higher timeframes (MTF).
It is designed to help traders visualize short-term price action and higher-timeframe market structure on a single chart, enabling clearer trend context and better decision-making.
■ Key Features
✅ Up to 12 Moving Averages
Display MA1–MA12 independently
Choose SMA or EMA for each MA
Fully customizable length, color, and line width
✅ Per-MA Local / MTF Selection
Each moving average can be set individually to:
Local – calculated on the current chart timeframe
MTF – retrieved from a higher timeframe (e.g. 1H, 4H, Daily, Weekly, Monthly)
This allows you to clearly separate entry signals from higher-timeframe trend context.
✅ Confirmed Bar Mode (Repaint Control)
When using MTF, each MA supports Confirmed Bar Mode:
ON – updates only after the higher-timeframe bar is closed (minimal repaint, backtest-friendly)
OFF – follows the current higher-timeframe bar in real time (discretionary trading)
✅ Gap Handling Option
Gaps OFF – higher-timeframe values are filled smoothly (step-style, easier to read)
Gaps ON – values appear only when a higher-timeframe bar updates (theoretical accuracy)
✅ Lightweight & Efficient Design
Each MA includes separate:
Calculation ON / OFF
Display ON / OFF
Unused MAs can be completely disabled, preventing unnecessary calculations and keeping the indicator fast even with multiple MTF sources.
■ Example Use Case
MA1–MA3: Local timeframe MAs for short-term momentum
MA4–MA6: Higher-timeframe MAs (4H / Daily / Weekly) for trend structure
MA7–MA12: Optional layers, disabled by default
This setup makes it easy to understand where price is trading within the broader market context.
■ Who This Indicator Is For
Traders who rely on multi-timeframe trend analysis
Scalpers, day traders, and swing traders who want one-chart clarity
Users concerned about repainting and indicator performance
Anyone who uses moving averages as structural reference points, not just signals
■ Technical Notes
Pine Script v5
Overlay indicator (drawn on price chart)
Multi-timeframe support via request.security()
No alerts or shapes — pure visual analysis
📊 MA-MTF-12 Overlay – インジケーター解説
■ 概要
MA-MTF-12 Overlay** は、
最大12本の移動平均(SMA / EMA)を、現在足(Local)または上位足(MTF)から自由に組み合わせて表示できる**
マルチタイムフレーム対応の高機能MAインジケーターです。
短期足の値動きから、1時間・4時間・日足・週足・月足といった
上位足のトレンド環境を、1つのチャート上で同時に把握**することを目的に設計されています。
---
■ 主な特徴
✅ 最大12本のMAを同時表示
* MA1〜MA12を個別に設定可能
* SMA / EMA をMAごとに選択
* 期間・色・太さもすべて自由にカスタマイズ
---
✅ Local / MTF をMAごとに切替可能
各MAは以下を個別に選択できます。
Local:現在のチャート時間足で計算
MTF:指定した上位足(例:1H / 4H / D / W / M)から取得
👉
短期MAはLocal、
環境認識用MAはMTF、
という役割分担を1つのインジケーターで実現できます。
---
✅ 確定足モード(リペイント制御)
MTF使用時は、確定足モードをMAごとに設定可能。
ON:上位足が確定してから更新(リペイント最小・検証向き)
OFF:上位足の進行中の値もリアルタイムで反映(裁量トレード向き)
用途に応じて柔軟に使い分けられます。
---
✅ ギャップ表示 ON / OFF
OFF:上位足MAを階段状に補完表示(視認性重視)
ON:上位足更新点のみ表示(理論重視)
---
✅ 計算ON / 表示ON を分離した軽量設計
各MAには
計算ON / OFF
表示ON / OFF**
を個別に用意。
使わないMAは計算そのものを停止できるため、
MTFを多用しても**動作が重くなりにくい設計です。
---
■ 想定される使い方
* MA1〜MA3:Local(短期〜中期の勢い把握)
* MA4〜MA6:MTF(4H・日足・週足のトレンド環境)
* MA7〜MA12:必要に応じて追加(初期はOFF)
👉
「今どの時間軸のトレンドの中にいるのか」を
MAだけで直感的に把握できます。
---
■ こんな方におすすめ
* 上位足MAを使った環境認識を重視するトレーダー
* スキャル・デイトレ・スイングを1チャートで完結させたい方
* MTFインジケーターのリペイントや重さが気になる方
* MAを「本数・役割・時間軸」で整理して使いたい方
---
■ 技術仕様
* Pine Script v5
* overlay=true(価格チャート上に表示)
* MTF対応(request.security 使用)
* アラート・シェイプなし(純粋な分析用)
---

Luxy VWAP Magic - MTF Projection EngineThis indicator transforms the classic VWAP into a comprehensive trading system. Instead of switching between multiple indicators, you get everything in one place: multi-timeframe analysis, statistical bands, momentum detection, volume profiling, session tracking, and divergence signals.
What Makes This Different
Traditional VWAP indicators show a single line. This tool treats VWAP as a foundation for complete market analysis. The indicator automatically detects your asset type (stocks, crypto, forex, futures) and adjusts its behavior accordingly. Crypto traders get 24/7 session tracking. Stock traders get proper market hours handling. Everyone gets institutional-grade analytics.
Anchor Period Options
The anchor period determines when VWAP resets and recalculates. You have three categories of options:
Time-Based Anchors:
Session - Resets at market open. Best for intraday stock trading where you want fresh VWAP each day.
Day - Resets at midnight UTC. Standard option for most traders.
Week / Month / Quarter / Year - Longer reset periods for swing traders and position traders who want broader context.
Rolling Window Anchors:
Rolling 5D - A sliding 5-day window that never resets. Solves the Monday problem where weekly VWAP equals daily VWAP on first day of week.
Rolling 21D - Approximately one month of trading data in continuous calculation. Excellent for crypto and forex markets that trade 24/7 without clear session breaks.
Event-Based Anchors:
Dividends - Resets on ex-dividend dates. Track institutional cost basis from dividend events.
Splits - Resets on stock split dates. Useful for analyzing post-split trading behavior.
Earnings - Resets on earnings report dates. See where volume-weighted trading occurred since last quarterly report.
Standard Deviation Bands
Three sets of bands surround the main VWAP line:
Band 1 (Aqua) - Plus and minus one standard deviation. Approximately 68% of price action occurs within this range under normal distribution. Touches suggest minor extension.
Band 2 (Fuchsia) - Plus and minus two standard deviations. Only 5% of trading should occur outside this range statistically. Touches here indicate significant overextension and high probability of mean reversion.
Band 3 (Purple) - Plus and minus three standard deviations. Touches are rare (0.3% probability) and represent extreme conditions. Often marks climax moves or panic selling/buying.
Each band can be toggled independently. Most traders show Band 1 by default and add Band 2 and 3 for specific setups or volatile instruments.
Multi-Timeframe VWAP System
The MTF section plots previous period VWAPs as horizontal support and resistance levels:
Daily VWAP - Previous day's final VWAP value. Key intraday reference level.
Weekly VWAP - Previous week's final VWAP. Important for swing traders.
Monthly VWAP - Previous month's final VWAP. Institutional benchmark level.
Quarterly VWAP - Previous quarter's final VWAP. Major support/resistance for position traders.
Previous Day VWAP - Yesterday's closing VWAP specifically, separate from current daily calculation.
The Confluence Zone percentage setting determines how close multiple VWAPs must be to trigger a confluence alert. When two or more timeframe VWAPs converge within this threshold, you get a high-probability support/resistance zone.
Session VWAPs for Global Markets
For forex, crypto, and futures traders who operate in 24/7 markets, the indicator tracks three major global sessions:
Asia Session - UTC 21:00 to 08:00. Gold colored line. Typically lower volatility, range-bound action that sets overnight levels.
London Session - UTC 08:00 to 17:00. Orange colored line. Often determines daily direction with high volume European participation.
New York Session - UTC 13:00 to 22:00. Blue colored line. Highest volume session globally. Sharp directional moves common.
Previous session VWAP values display as horizontal lines when each session closes, acting as intraday support and resistance. The table shows which sessions are currently active with checkmarks.
On-Chart Labels and Signals
The indicator plots several types of labels directly on price action when significant events occur:
Volume Spike Labels
Fire when current bar volume exceeds configurable thresholds relative to both the previous bar and the 20-bar average. Default settings require 300% of previous bar AND 200% of average volume. Green labels indicate bullish candles. Red labels indicate bearish candles. These spikes often mark institutional entry points.
Momentum Shift Labels
Appear when VWAP acceleration changes direction. The Slowing label warns when an active trend loses steam, often preceding reversal. The Accelerating label confirms trend continuation or potential bottom during downtrends. Filters available to show only reversal signals in existing trends.
VWAP Squeeze Labels
Detect when standard deviation bands contract relative to ATR (Average True Range). Low volatility compression often precedes explosive breakout moves. When the squeeze fires (releases), a label appears with directional prediction based on VWAP slope.
Divergence Labels
Mark price/volume divergences using CVD (Cumulative Volume Delta) analysis:
Bullish divergence: Price makes lower low, but CVD makes higher low. Hidden accumulation despite price weakness.
Bearish divergence: Price makes higher high, but CVD makes lower high. Hidden distribution despite price strength.
Dynamic VWAP Coloring
The main VWAP line changes color based on its slope direction:
Green - VWAP is rising. Institutional buying pressure. Volume-weighted price increasing.
Red - VWAP is falling. Institutional selling pressure. Volume-weighted price decreasing.
Gray - VWAP is flat. Consolidation or balance between buyers and sellers.
This coloring can be disabled for a static blue line if you prefer cleaner visuals. The VWAP label next to the line shows the current trend direction and delta percentage.
Calculated Projection Cone
One of the most powerful features is the Calculated Projection Cone. Unlike traditional extrapolation methods that simply extend a trend line forward, this system analyzes what actually happened in similar market conditions throughout the chart's history.
How It Works:
The system classifies each bar into one of 27 unique market states:
Z-Score Level - LOW (oversold), MID (fair value), or HIGH (overbought) based on configurable thresholds
Trend Direction - DOWN, FLAT, or UP based on VWAP slope
Volume Profile - LOW (below 80%), NORMAL (80-150%), or HIGH (above 150%) relative volume
When you look at the current bar, the indicator:
1. Identifies the current market state (e.g., LOW Z-Score + UP Trend + HIGH Volume)
2. Searches through all historical bars on the chart that had the same state
3. Calculates what happened in those bars X bars later (where X is your projection horizon)
4. Shows you the probability of up/down and the average move size
Visual Elements:
Probability Cone - Colored green (bullish probability above 55%), red (bearish below 45%), or gold (neutral). The cone width represents the historical range of outcomes (roughly the 20th to 80th percentile).
Center Line - Shows the average expected price based on historical outcomes in similar conditions.
Probability Label - Displays direction probability and average move. Example: "67% UP (+0.8%)" means 67% of similar past cases moved up, averaging 0.8% gain.
Fallback System:
When the exact 27-state match has insufficient historical data:
First fallback: Uses Z-Score plus Trend only (9 broader states, ignoring volume)
Second fallback: Uses Z-Score only (3 states)
When fallback is active, confidence automatically adjusts
Settings:
Projection Horizon - How many bars forward to analyze outcomes (5, 10, 15, or 20 bars, default 10)
Lookback Period - Historical data window in days (30-252, default 60)
Minimum Samples - Cases needed before using fallback (5-30, default 10)
Z-Score Threshold - Bucket boundary for LOW/MID/HIGH classification (1.0, 1.5, or 2.0 sigma)
Cloud Transparency - Adjust visibility (50-95%)
Colors - Customize bullish, bearish, and neutral cone colors
Confidence Levels:
HIGH - 30 or more similar historical cases found
MEDIUM - 15-29 similar cases
LOW - Fewer than 15 cases (more uncertainty)
IMPORTANT DISCLAIMER:
The Calculated Projection is based on past patterns only. It is NOT a price prediction or financial advice. Similar market states in the past do not guarantee similar outcomes in the future. The probability shown is historical frequency, not a guarantee. Always combine with other analysis and never rely solely on projections for trading decisions.
Alert Conditions
The indicator includes over 20 pre-built alert conditions:
Price vs VWAP:
Price crosses above VWAP
Price crosses below VWAP
Band Touches:
Price touches plus or minus one sigma band
Price touches plus or minus two sigma band (extreme)
Price touches plus or minus three sigma band (very extreme)
Z-Score Extremes:
Z-Score crosses above plus two (overbought extreme)
Z-Score crosses below minus two (oversold extreme)
Momentum and Trend:
Momentum slowing
Momentum accelerating
Trend turns bullish/bearish/neutral
Volume:
Volume spike detected
CVD Direction:
Buyers take control
Sellers take control
High Probability Signals:
Bullish reversal signal (oversold plus accelerating momentum)
Bearish reversal signal (overbought plus slowing momentum)
MTF and Special:
MTF confluence zone entry
VWAP squeeze fired
Bullish/Bearish divergence detected
Any significant signal (catch-all)
All signals use confirmed bar data to prevent false alerts from incomplete candles.
Settings Overview
Settings are organized into logical groups:
VWAP Settings
Anchor Period selection
Show/Hide VWAP line
Dynamic coloring toggle
VWAP label visibility
Bands Visibility
Toggle each of three bands independently
Info Table
Show/Hide table
Table position (9 options)
Text size
Volume spike label settings with adjustable thresholds
Momentum label settings with filters
Signal labels limited to 5 most recent (auto-managed)
Probability engine lookback period
Multi-Timeframe VWAP
Enable/Disable MTF system
Show MTF in table
Show MTF lines on chart
Individual timeframe toggles
Confluence zone threshold
Squeeze detection toggle
Session VWAPs
Enable/Disable session tracking
Apply to all assets option
Show session labels
Divergence Detection
Enable/Disable divergence
Pivot lookback period
Show divergence labels
Calculated Projection
Enable/Disable projection cone
Projection horizon (5, 10, 15, or 20 bars)
Lookback period in days (30-252)
Minimum samples threshold
Z-Score classification threshold (1.0, 1.5, or 2.0 sigma)
Cloud transparency adjustment
Bullish, bearish, and neutral colors
The Info Table - Your Trading Dashboard
The right side of your chart displays a compact table with up to twelve metrics.
Row-by-Row Breakdown:
Asset and Period - Shows what the indicator detected (US Stock, Crypto, Forex, etc.) and your selected anchor period. The detection happens automatically based on exchange data, so VWAP resets and calculations match your actual trading instrument.
Delta Percentage - How far current price sits from VWAP, expressed as a percentage. Positive means price trades above fair value. Negative means below. Large delta values (beyond 1-2%) often precede mean reversion moves. Day traders watch this for overextension.
Z-Score - Statistical deviation from VWAP measured in standard deviations. Unlike raw delta, Z-Score accounts for volatility. A 2% move in a volatile biotech stock differs from 2% in a stable utility. Z-Score normalizes this. Values beyond plus or minus two sigma occur only 5% of the time statistically.
Trend Direction - Whether VWAP itself is rising, falling, or flat. Rising VWAP means the volume-weighted average price is increasing, which indicates institutional accumulation. Falling VWAP suggests distribution. This differs from price trend since it weights by volume.
Momentum State - Is the trend accelerating or slowing down? This measures the rate of change in VWAP slope. When an uptrend shows slowing momentum, it often precedes reversal. Accelerating momentum in a downtrend can signal capitulation and potential bottom.
Relative Volume - Current bar volume compared to the 20-bar average, shown as percentage. Values above 150% indicate above-average activity. Spikes above 200-300% often mark institutional involvement. Low volume (below 80%) warns of potential fake moves.
MTF Bias - Four checkmarks or X marks showing whether price sits above or below Daily, Weekly, Monthly, and Quarterly VWAP. Four checkmarks means strong bullish alignment across all timeframes. Four X marks indicates bearish alignment. Mixed readings suggest consolidation or transition.
Band Probabilities - Historical statistics showing how often price touched each standard deviation band over your lookback period. This helps you understand if mean reversion or trend following works better for your specific instrument.
Session Status - Which global trading sessions are currently active (Asia, London, New York). Shows checkmarks for active sessions. Important for forex and crypto traders who need to know when major liquidity windows open and close.
Divergence State - Whether the indicator detects bullish or bearish divergence between price and cumulative volume delta. Bullish divergence occurs when price makes lower lows but buying pressure (CVD) makes higher lows, suggesting hidden accumulation.
Confidence Score - A weighted composite of all factors displayed as a progress bar and percentage. Combines MTF alignment, Z-Score, trend direction, volume delta, momentum, and relative volume into a single 0-100 score. Higher scores indicate stronger conviction setups.
Calculated Projection - When the Projection Cone is enabled, shows the historical probability of price direction and expected move. For example: "▲ 67% (+0.8%)" means in similar market states historically, price moved up 67% of the time with an average gain of 0.8%. The system analyzes 27 unique market states based on Z-Score, Trend, and Volume conditions.
Recommended Use Cases
Day Trading Stocks:
Use Session anchor with Band 1 visible. Watch for price returning to VWAP after morning move. Volume spikes near VWAP often mark institutional accumulation zones.
Swing Trading:
Use Weekly or Rolling 21D anchor. Enable MTF lines for Daily and Weekly levels. Trade pullbacks to these levels in direction of MTF bias.
Crypto and Forex:
Enable Session VWAPs. Use Rolling anchors to avoid artificial resets. Monitor session transitions for breakout opportunities.
Mean Reversion:
Focus on Z-Score reaching plus or minus two. Add Band 2 visibility. Combine with slowing momentum for highest probability reversals.
Trend Following:
Watch MTF bias alignment. Four checkmarks plus accelerating momentum plus high volume confirms trend continuation setups.
Projection Planning:
Enable the Calculated Projection to see what happened historically in similar market conditions. Use 5-10 bars for intraday setups, 15-20 bars for swing trade planning. Focus on high probability readings (above 60%) with HIGH confidence (30 or more samples). The cone shows the probable range of outcomes based on actual historical data. Combine with other factors like MTF alignment and volume for higher conviction setups.
Important Notes
The indicator does not repaint. MTF values use previous period's confirmed data.
Rolling VWAP works best on 15-minute timeframes and above due to bar lookback requirements.
Session VWAPs apply to global markets by default (forex, crypto, futures). Enable the all-assets option for stocks if desired.
Volume data for forex represents tick volume, not actual traded volume.
All alert conditions fire only on confirmed (closed) bars to prevent false signals.
The Calculated Projection updates each bar as market state changes. This is expected behavior. The projection shows probabilities based on similar past conditions, not a fixed prediction.
Q AND A
Q: Does this indicator repaint?
A: No. The main VWAP calculation uses standard TradingView VWAP methodology. Multi-timeframe values use previous period's confirmed data with appropriate lookahead settings. All alert signals require bar confirmation.
Q: Why does my Rolling VWAP look different on 1-minute versus 15-minute charts?
A: Rolling VWAP calculates across a fixed number of trading days. On very short timeframes, the bar lookback may hit TradingView limits. For best Rolling VWAP accuracy, use 15-minute or higher timeframes.
Q: Can I use this on any instrument?
A: Yes. The indicator automatically detects asset type and adjusts behavior. Stocks use standard market hours. Crypto uses 24/7 calculations. Forex uses tick volume. Everything adapts automatically.
Q: What does the Confidence Score actually measure?
A: The score combines six weighted factors: MTF alignment (25%), Z-Score position (20%), Trend direction (20%), CVD pressure (15%), Momentum state (10%), and Relative volume (10%). Higher scores indicate more factors aligned in one direction.
Q: Why are Session VWAPs not showing on my stock chart?
A: Session VWAPs apply to 24-hour markets by default (forex, crypto, futures). For stocks, enable the Use for All Assets option in Session VWAP settings.
Q: The Divergence labels appear delayed. Is this a bug?
A: Divergence detection requires pivot confirmation, which needs bars on both sides of the pivot point. The label appears at the actual pivot location (several bars back) once confirmed. This is intentional and prevents false signals.
Q: Can I change the band colors?
A: Yes. Each of the three bands has its own color input setting. You can customize Band 1, Band 2, and Band 3 colors to match your preferences. The defaults are Aqua, Fuchsia, and Purple. The main VWAP line color adapts dynamically based on slope direction or can be set to static blue.
Q: How do I set up alerts?
A: Right-click on the chart, select Add Alert, choose this indicator, and select your desired condition from the dropdown. All conditions include descriptive alert messages with relevant data.
Q: What is the Probability Engine lookback period?
A: This setting determines how many trading days the indicator analyzes to calculate band touch rates and mean reversion statistics. Default is 60 days (approximately 3 months). Longer periods provide more stable statistics but may miss recent behavior changes.
Q: Why do I see fewer labels than expected?
A: Signal labels (Volume, Momentum, Squeeze, Divergence) are limited to 5 most recent labels on the chart to keep it clean. When a new label appears, the oldest one is automatically removed. Additionally, momentum labels have several filters: check the slope multiplier setting (higher values require stronger trends) and the Only Reversal Signals option (when enabled, labels only appear for potential reversals, not trend confirmations).
Q: What is the Calculated Projection and how accurate is it?
A: The Calculated Projection analyzes what happened in past market conditions similar to the current state. It classifies each bar by Z-Score level, Trend direction, and Volume profile (27 unique states), then shows the historical probability of up vs down and the average move size. It is NOT a price prediction or guarantee. The probability shown is how often similar conditions led to up/down moves historically, not a future guarantee. Always use it as one input among many.
Q: Why does the Projection probability change?
A: The projection updates on each bar as market state changes. If Z-Score moves from LOW to MID, or trend shifts from UP to FLAT, the system looks up a different historical category. This is expected behavior. The projection shows what happened in similar past conditions to the current bar's state.
Q: The Projection shows LOW confidence. What does that mean?
A: Confidence levels indicate sample size: HIGH means 30 or more historical cases found, MEDIUM means 15-29 cases, LOW means fewer than 15 cases. When sample size is low, the system uses a fallback: first aggregating by Z-Score plus Trend only (ignoring volume), then by Z-Score only. LOW confidence means less statistical reliability, so weight other factors more heavily in your decision.
Q: Why does the cone sometimes show 50/50 probability?
A: A 50/50 reading means that in similar past market states, price moved up roughly half the time and down half the time. This indicates a neutral or balanced condition where historical patterns provide no directional edge. Consider waiting for a higher probability setup or using other analysis methods.
CREDITS AND ACKNOWLEDGMENTS
Methodology Foundation:
VWAP (Volume Weighted Average Price) - Standard institutional benchmark calculation, widely used since the 1980s for algorithmic execution and fair value assessment
Standard Deviation Bands - Statistical volatility measurement applying normal distribution principles to price deviation from mean
Z-Score Analysis - Classic statistical normalization technique for comparing values across different volatility regimes
Cumulative Volume Delta (CVD) - Order flow analysis concept measuring aggressive buying versus selling pressure
Concept Integration:
Mean reversion probability engine - Custom historical statistics tracking for band touch rates
Momentum acceleration detection - Second derivative analysis of VWAP slope changes
VWAP Squeeze - Volatility compression concept adapted from TTM Squeeze methodology applied to VWAP bands versus ATR
Confidence scoring system - Weighted composite scoring combining multiple technical factors
Calculated Projection Cone - Probability-based projection using 27-state market classification (Z-Score, Trend, Volume) with historical outcome analysis and weighted fallback system
All calculations use standard public domain formulas and TradingView built-in functions. No proprietary third-party code was used.
For questions, feedback, or feature requests, please comment below or send a private message.
Happy Trading!

FvgCalculations█ OVERVIEW
This library provides the core calculation engine for identifying Fair Value Gaps (FVGs) across different timeframes and for processing their interaction with price. It includes functions to detect FVGs on both the current chart and higher timeframes, as well as to check for their full or partial mitigation.
█ CONCEPTS
The library's primary functions revolve around the concept of Fair Value Gaps and their lifecycle.
Fair Value Gap (FVG) Identification
An FVG, or imbalance, represents a price range where buying or selling pressure was significant enough to cause a rapid price movement, leaving an "inefficiency" in the market. This library identifies FVGs based on three-bar patterns:
Bullish FVG: Forms when the low of the current bar (bar 3) is higher than the high of the bar two periods prior (bar 1). The FVG is the space between the high of bar 1 and the low of bar 3.
Bearish FVG: Forms when the high of the current bar (bar 3) is lower than the low of the bar two periods prior (bar 1). The FVG is the space between the low of bar 1 and the high of bar 3.
The library provides distinct functions for detecting FVGs on the current (Low Timeframe - LTF) and specified higher timeframes (Medium Timeframe - MTF / High Timeframe - HTF).
FVG Mitigation
Mitigation refers to price revisiting an FVG.
Full Mitigation: An FVG is considered fully mitigated when price completely closes the gap. For a bullish FVG, this occurs if the current low price moves below or touches the FVG's bottom. For a bearish FVG, it occurs if the current high price moves above or touches the FVG's top.
Partial Mitigation (Entry/Fill): An FVG is partially mitigated when price enters the FVG's range but does not fully close it. The library tracks the extent of this fill. For a bullish FVG, if the current low price enters the FVG from above, that low becomes the new effective top of the remaining FVG. For a bearish FVG, if the current high price enters the FVG from below, that high becomes the new effective bottom of the remaining FVG.
FVG Interaction
This refers to any instance where the current bar's price range (high to low) touches or crosses into the currently unfilled portion of an active (visible and not fully mitigated) FVG.
Multi-Timeframe Data Acquisition
To detect FVGs on higher timeframes, specific historical bar data (high, low, and time of bars at indices and relative to the higher timeframe's last completed bar) is required. The requestMultiTFBarData function is designed to fetch this data efficiently.
█ CALCULATIONS AND USE
The functions in this library are typically used in a sequence to manage FVGs:
1. Data Retrieval (for MTF/HTF FVGs):
Call requestMultiTFBarData() with the desired higher timeframe string (e.g., "60", "D").
This returns a tuple of htfHigh1, htfLow1, htfTime1, htfHigh3, htfLow3, htfTime3.
2. FVG Detection:
For LTF FVGs: Call detectFvg() on each confirmed bar. It uses high , low, low , and high along with barstate.isconfirmed.
For MTF/HTF FVGs: Call detectMultiTFFvg() using the data obtained from requestMultiTFBarData().
Both detection functions return an fvgObject (defined in FvgTypes) if an FVG is found, otherwise na. They also can classify FVGs as "Large Volume" (LV) if classifyLV is true and the FVG size (top - bottom) relative to the tfAtr (Average True Range of the respective timeframe) meets the lvAtrMultiplier.
3. FVG State Updates (on each new bar for existing FVGs):
First, check for overall price interaction using fvgInteractionCheck(). This function determines if the current bar's high/low has touched or entered the FVG's currentTop or currentBottom.
If interaction occurs and the FVG is not already mitigated:
Call checkMitigation() to determine if the FVG has been fully mitigated by the current bar's currentHigh and currentLow. If true, the FVG's isMitigated status is updated.
If not fully mitigated, call checkPartialMitigation() to see if the price has further entered the FVG. This function returns the newLevel to which the FVG has been filled (e.g., currentLow for a bullish FVG, currentHigh for bearish). This newLevel is then used to update the FVG's currentTop or currentBottom.
The calling script (e.g., fvgMain.c) is responsible for storing and managing the array of fvgObject instances and passing them to these update functions.
█ NOTES
Bar State for LTF Detection: The detectFvg() function relies on barstate.isconfirmed to ensure FVG detection is based on closed bars, preventing FVGs from being detected prematurely on the currently forming bar.
Higher Timeframe Data (lookahead): The requestMultiTFBarData() function uses lookahead = barmerge.lookahead_on. This means it can access historical data from the higher timeframe that corresponds to the current bar on the chart, even if the higher timeframe bar has not officially closed. This is standard for multi-timeframe analysis aiming to plot historical HTF data accurately on a lower timeframe chart.
Parameter Typing: Functions like detectMultiTFFvg and detectFvg infer the type for boolean (classifyLV) and numeric (lvAtrMultiplier) parameters passed from the main script, while explicitly typed series parameters (like htfHigh1, currentAtr) expect series data.
fvgObject Dependency: The FVG detection functions return fvgObject instances, and fvgInteractionCheck takes an fvgObject as a parameter. This UDT is defined in the FvgTypes library, making it a dependency for using FvgCalculations.
ATR for LV Classification: The tfAtr (for MTF/HTF) and currentAtr (for LTF) parameters are expected to be the Average True Range values for the respective timeframes. These are used, if classifyLV is enabled, to determine if an FVG's size qualifies it as a "Large Volume" FVG based on the lvAtrMultiplier.
MTF/HTF FVG Appearance Timing: When displaying FVGs from a higher timeframe (MTF/HTF) on a lower timeframe (LTF) chart, users might observe that the most recent MTF/HTF FVG appears one LTF bar later compared to its appearance on a native MTF/HTF chart. This is an expected behavior due to the detection mechanism in `detectMultiTFFvg`. This function uses historical bar data from the MTF/HTF (specifically, data equivalent to `HTF_bar ` and `HTF_bar `) to identify an FVG. Therefore, all three bars forming the FVG on the MTF/HTF must be fully closed and have shifted into these historical index positions relative to the `request.security` call from the LTF chart before the FVG can be detected and displayed on the LTF. This ensures that the MTF/HTF FVG is identified based on confirmed, closed bars from the higher timeframe.
█ EXPORTED FUNCTIONS
requestMultiTFBarData(timeframe)
Requests historical bar data for specific previous bars from a specified higher timeframe.
It fetches H , L , T (for the bar before last) and H , L , T (for the bar three periods prior)
from the requested timeframe.
This is typically used to identify FVG patterns on MTF/HTF.
Parameters:
timeframe (simple string) : The higher timeframe to request data from (e.g., "60" for 1-hour, "D" for Daily).
Returns: A tuple containing: .
- htfHigh1 (series float): High of the bar at index 1 (one bar before the last completed bar on timeframe).
- htfLow1 (series float): Low of the bar at index 1.
- htfTime1 (series int) : Time of the bar at index 1.
- htfHigh3 (series float): High of the bar at index 3 (three bars before the last completed bar on timeframe).
- htfLow3 (series float): Low of the bar at index 3.
- htfTime3 (series int) : Time of the bar at index 3.
detectMultiTFFvg(htfHigh1, htfLow1, htfTime1, htfHigh3, htfLow3, htfTime3, tfAtr, classifyLV, lvAtrMultiplier, tfType)
Detects a Fair Value Gap (FVG) on a higher timeframe (MTF/HTF) using pre-fetched bar data.
Parameters:
htfHigh1 (float) : High of the first relevant bar (typically high ) from the higher timeframe.
htfLow1 (float) : Low of the first relevant bar (typically low ) from the higher timeframe.
htfTime1 (int) : Time of the first relevant bar (typically time ) from the higher timeframe.
htfHigh3 (float) : High of the third relevant bar (typically high ) from the higher timeframe.
htfLow3 (float) : Low of the third relevant bar (typically low ) from the higher timeframe.
htfTime3 (int) : Time of the third relevant bar (typically time ) from the higher timeframe.
tfAtr (float) : ATR value for the higher timeframe, used for Large Volume (LV) FVG classification.
classifyLV (bool) : If true, FVGs will be assessed to see if they qualify as Large Volume.
lvAtrMultiplier (float) : The ATR multiplier used to define if an FVG is Large Volume.
tfType (series tfType enum from no1x/FvgTypes/1) : The timeframe type (e.g., types.tfType.MTF, types.tfType.HTF) of the FVG being detected.
Returns: An fvgObject instance if an FVG is detected, otherwise na.
detectFvg(classifyLV, lvAtrMultiplier, currentAtr)
Detects a Fair Value Gap (FVG) on the current (LTF - Low Timeframe) chart.
Parameters:
classifyLV (bool) : If true, FVGs will be assessed to see if they qualify as Large Volume.
lvAtrMultiplier (float) : The ATR multiplier used to define if an FVG is Large Volume.
currentAtr (float) : ATR value for the current timeframe, used for LV FVG classification.
Returns: An fvgObject instance if an FVG is detected, otherwise na.
checkMitigation(isBullish, fvgTop, fvgBottom, currentHigh, currentLow)
Checks if an FVG has been fully mitigated by the current bar's price action.
Parameters:
isBullish (bool) : True if the FVG being checked is bullish, false if bearish.
fvgTop (float) : The top price level of the FVG.
fvgBottom (float) : The bottom price level of the FVG.
currentHigh (float) : The high price of the current bar.
currentLow (float) : The low price of the current bar.
Returns: True if the FVG is considered fully mitigated, false otherwise.
checkPartialMitigation(isBullish, currentBoxTop, currentBoxBottom, currentHigh, currentLow)
Checks for partial mitigation of an FVG by the current bar's price action.
It determines if the price has entered the FVG and returns the new fill level.
Parameters:
isBullish (bool) : True if the FVG being checked is bullish, false if bearish.
currentBoxTop (float) : The current top of the FVG box (this might have been adjusted by previous partial fills).
currentBoxBottom (float) : The current bottom of the FVG box (similarly, might be adjusted).
currentHigh (float) : The high price of the current bar.
currentLow (float) : The low price of the current bar.
Returns: The new price level to which the FVG has been filled (e.g., currentLow for a bullish FVG).
Returns na if no new partial fill occurred on this bar.
fvgInteractionCheck(fvg, highVal, lowVal)
Checks if the current bar's price interacts with the given FVG.
Interaction means the price touches or crosses into the FVG's
current (possibly partially filled) range.
Parameters:
fvg (fvgObject type from no1x/FvgTypes/1) : The FVG object to check.
Its isMitigated, isVisible, isBullish, currentTop, and currentBottom fields are used.
highVal (float) : The high price of the current bar.
lowVal (float) : The low price of the current bar.
Returns: True if price interacts with the FVG, false otherwise.

Stochastic RSI with MTF TableShort Description of the Script
The provided Pine Script indicator, titled "Stochastic RSI with MTF Table," calculates and displays the Stochastic RSI for the current timeframe and multiple other timeframes (5m, 15m, 30m, 60m, 240m, and daily). The Stochastic RSI is a momentum indicator that blends the Relative Strength Index (RSI) and Stochastic Oscillator to identify overbought and oversold conditions, as well as potential trend reversals via K and D line crossovers.
Key features of the script include:
Inputs: Customizable parameters such as K smoothing (default 3), D smoothing (default 3), RSI length (default 14), Stochastic length (default 14), source price (default close), and overbought/oversold levels (default 80/20).
MTF Table: A table displays the Stochastic RSI status for each timeframe:
"OB" (overbought) if K > 80, "OS" (oversold) if K < 20, or "N" (neutral) otherwise.
Crossovers: "K↑D" for bullish (K crosses above D) and "K↓D" for bearish (K crosses below D).
Visualization: Plots the K and D lines for the current timeframe, with horizontal lines at 80 (overbought), 50 (middle), and 20 (oversold), plus a background fill for clarity.
Table Position: Configurable to appear in one of four chart corners (default: top-right).
This indicator helps traders assess momentum across multiple timeframes simultaneously, aiding in the identification of trend strength and potential entry/exit points.
Trading Strategy with 50EMA and 200EMA for Highest Winning Rate
To create a strategy with the best probability of a high winning rate using the Stochastic RSI MTF indicator alongside the 50-period Exponential Moving Average (50EMA) and 200-period Exponential Moving Average (200EMA), we can combine trend identification with momentum-based entry timing. The 50EMA and 200EMA are widely used to determine medium- and long-term trends, while the Stochastic RSI MTF table provides multi-timeframe momentum signals. Here’s the strategy:
1. Determine the Overall Trend
Bullish Trend: The 50EMA is above the 200EMA on the current timeframe (e.g., daily or 60m chart). This suggests an uptrend, often associated with a "Golden Cross."
Bearish Trend: The 50EMA is below the 200EMA on the current timeframe. This indicates a downtrend, often linked to a "Death Cross."
Implementation: Plot the 50EMA and 200EMA on your chart and visually confirm their relative positions.
2. Identify Entry Signals Using the Stochastic RSI MTF Table
In a Bullish Trend (50EMA > 200EMA):
Look for timeframes in the MTF table showing:
Oversold (OS): K < 20, indicating a potential pullback in the uptrend where price may rebound.
Bullish Crossover (K↑D): K crosses above D, signaling rising momentum and a potential entry point.
Example: If the 60m and 240m timeframes show "OS" or "K↑D," this could be a buy signal.
In a Bearish Trend (50EMA < 200EMA):
Look for timeframes in the MTF table showing:
Overbought (OB): K > 80, suggesting a rally in the downtrend where price may reverse downward.
Bearish Crossover (K↓D): K crosses below D, indicating declining momentum and a potential short entry.
Example: If the 30m and daily timeframes show "OB" or "K↓D," this could be a sell/short signal.
Current Timeframe Check: Use the plotted K and D lines on your trading timeframe for precise entry timing (e.g., confirm a K↑D crossover on a 60m chart for a long trade).
3. Confirm Signals Across Multiple Timeframes
Strengthen the Signal: A higher winning rate is more likely when multiple timeframes align with the trend and signal. For instance:
Bullish trend + "OS" or "K↑D" on 60m, 240m, and daily = strong buy signal.
Bearish trend + "OB" or "K↓D" on 15m, 60m, and 240m = strong sell signal.
Prioritize Higher Timeframes: Signals from the 240m or daily timeframe carry more weight due to their indication of broader trends, increasing reliability.
4. Set Stop-Loss and Take-Profit Levels
Long Trades (Bullish):
Stop-Loss: Place below the most recent swing low or below the 50EMA, whichever is closer, to protect against trend reversals.
Take-Profit: Target a key resistance level or use a risk-reward ratio (e.g., 2:1 or 3:1) based on the stop-loss distance.
Short Trades (Bearish):
Stop-Loss: Place above the most recent swing high or above the 50EMA, whichever is closer.
Take-Profit: Target a key support level or apply a similar risk-reward ratio.
Trailing Stop Option: As the trend progresses, trail the stop below the 50EMA (for longs) or above it (for shorts) to lock in profits.
5. Risk Management
Position Sizing: Risk no more than 1-2% of your trading capital per trade to minimize losses from false signals.
Volatility Consideration: Adjust stop-loss distances and position sizes based on the asset’s volatility (e.g., wider stops for volatile stocks or crypto).
Avoid Overtrading: Wait for clear alignment between the EMA trend and MTF signals to avoid low-probability setups.
Example Scenario
Chart: 60-minute timeframe.
Trend: 50EMA > 200EMA (bullish).
MTF Table: 60m shows "OS," 240m shows "K↑D," and daily is "N."
Action: Enter a long position when the 60m K line crosses above D, confirming the table signal.
Stop-Loss: Below the recent 60m swing low (e.g., 2% below entry).
Take-Profit: At the next resistance level or a 3:1 reward-to-risk ratio.
Outcome: High probability of success due to trend alignment and multi-timeframe confirmation.
Why This Strategy Works
Trend Following: Trading in the direction of the 50EMA/200EMA trend reduces the risk of fighting the market’s momentum.
Momentum Timing: The Stochastic RSI MTF table pinpoints pullbacks or reversals within the trend, improving entry timing.
Multi-Timeframe Confirmation: Alignment across timeframes filters out noise, increasing the win rate.
Risk Control: Defined stop-loss and position sizing protect against inevitable losses.
Caveats
No strategy guarantees a 100% win rate; false signals can occur, especially in choppy markets.
Test this strategy on historical data or a demo account to verify its effectiveness for your asset and timeframe.
This approach leverages the strengths of both trend-following (EMA) and momentum (Stochastic RSI) tools, aiming for a high-probability, disciplined trading system.

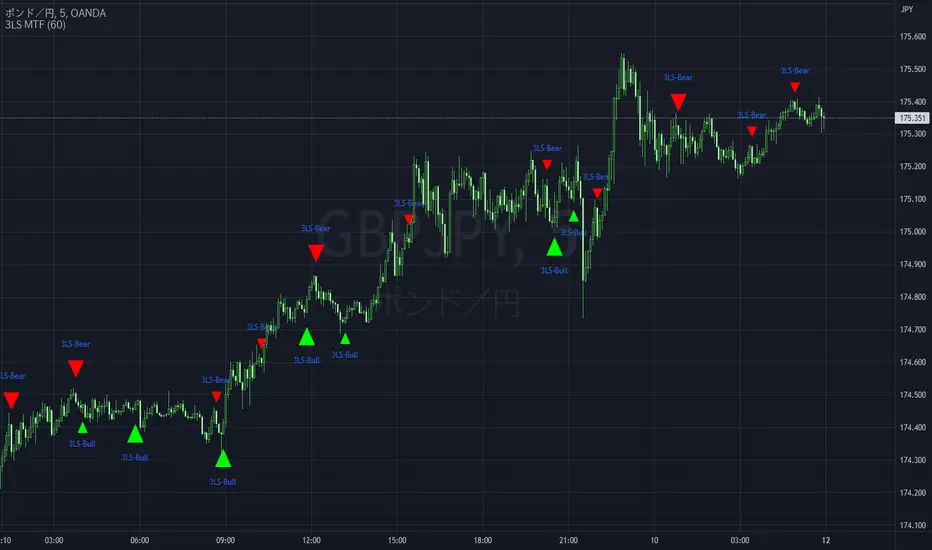
3 Line Strike MTF [MsF]Japanese below / 日本語説明は英文の後にあります。
-------------------------
*This indicator is based on TheTrdFloor's "3 Line Strike ". It's a very cool indicator. thank you.
In addition to the original indicator, it will be judged Engulfing only when the display of the MTF signal and the candle have a difference of 2 times or more.
=== Function description ===
1. Display of the MTF signal
Detects Engulfing of the specified Multi Time Frame. MTF Engulfing is displayed with 🍆 and 🍑.
2. Judged Engulfing on a difference of 2 times or more
Show a signal if the body of the current candle is more than twice as large as the body of the previous candle. This will make the signal mark appear larger than normal.
=== Parameter description ===
- COMMON SETTING
- Show Signal on MTF ? … If the check this, you can get MTF 3 Line Strike
- Judge Double Engulfing ? … If you check it, the signal will come up only when the Engulfing has doubled or more.
- 3 LINE STRIKE
- Show Bearish 3 Line Strike … The Bearish 3 Line Strike (3LS-Bear) is a candlestick pattern comprised of 3 bullish (green) candles, followed by a bearish engulfing candle (see 'Big A$$ Candles' below). This pattern tends to be best used as a signal of the end of a retracement period as part of a trend continuation strategy. Default: Checked
- Show Bullish 3 Line Strike … The Bullish 3 Line Strike (3LS-Bull) is a candlestick pattern comprised of 3 bearish (red) candles, followed by a bullish engulfing candle (see 'Big A$$ Candles' below). This pattern tends to be best used as a signal of the end of a retracement period as part of a trend continuation strategy. Default: Checked
- BIG A$$ CANDLES
- Show Bearish Big A$$ Candles … Bearish 'Big A$$ Candles' are the same as Bearish Engulfing candles.
- Show Bullish Big A$$ Candles … Bullish 'Big A$$ Candles' are the same as Bullish Engulfing candles.
-------------------------
本来のインジケーターに、①MTFシグナルの表示と②ローソク足の表示に2倍以上の差がある場合のみ包み足の判定を追加しました。
=== 機能説明 ===
1. MTFシグナルの表示
指定された時間足の包み足を検出します。 🍆 と 🍑 で表示されます。
2. 2倍以上の差で包み足判定
現在のローソクの実体が前のローソクの実体よりも 2 倍以上大きい場合にシグナルを表示します。マークは通常よりも大きく表示されます。
=== パラメータの説明 ===
- COMMON SETTING
- Show Signal on MTF ? … MTFシグナルを表示します
- Judge Double Engulfing ? … 包み足が前の足の2倍以上になった場合のみシグナルを発報します
- 3 LINE STRIKE
- Show Bearish 3 Line Strike … 陰線が3連続続いた後の包み足を検出します
- Show Bullish 3 Line Strike … 陽線が3連続続いた後の包み足を検出します
- BIG A$$ CANDLES
- Show Bearish Big A$$ Candles … 陽線の包み足を検出します
- Show Bullish Big A$$ Candles … 陰線の包み足を検出します
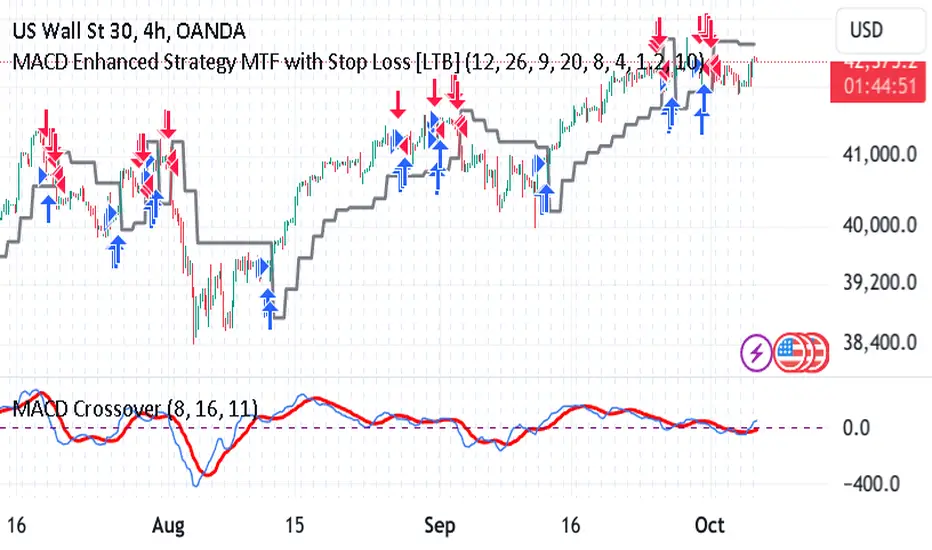
MACD Enhanced Strategy MTF with Stop Loss [LTB]Test strategy for MACD
This strategy, named "MACD Enhanced Strategy MTF with Stop Loss ," is a modified Moving Average Convergence Divergence (MACD) strategy with enhancements such as multi-timeframe (MTF) analysis, custom scoring, and a dynamic stop loss mechanism. Let’s break down how to effectively use it:
Key Elements of the Strategy
MACD Indicator with Modifications:
The strategy uses MACD, a well-known momentum indicator, with customizable parameters:
fastLength, slowLength, and signalLength represent the standard MACD settings.
Instead of relying solely on MACD crossovers, it introduces scoring parameters for histogram direction (histside), indicator direction (indiside), and signal cross (crossscore). This allows for a more nuanced decision-making process when determining buy and sell signals.
Multi-Timeframe Analysis (MTF):
The strategy compares the current timeframe's MACD score with that of a higher timeframe (HTF). It dynamically selects the higher timeframe based on the current timeframe. For example, if the current chart period is 1, it will select 5 as the higher timeframe.
This MTF approach aims to align trades with broader trends, filtering out false signals that could be present when analyzing only a single timeframe.
Scoring System:
A custom scoring system (count() function) is used to evaluate buy and sell signals. This includes calculations based on the direction and momentum of MACD (indi) and the histogram. The score is used to determine the strength of signals.
Positive scores indicate bullish sentiment, while negative scores indicate bearish sentiment.
This scoring mechanism aims to reduce the influence of noise and provide more reliable entries.
Entry Conditions:
Long Condition: When the Result value (a combination of MTF and current MACD analysis) changes and becomes positive, a long entry is triggered.
Short Condition: When the Result changes and becomes negative, a short entry is initiated.
Stop Loss Mechanism:
The countstop() function calculates dynamic stop loss values for both long and short trades. It is based on the Average True Range (ATR) multiplied by a factor (Mult), providing adaptive stop loss levels depending on market volatility.
The stop loss is plotted on the chart to show potential risk levels for open trades, with the line appearing only if shotsl is enabled.
How to Use the Strategy
To properly use the strategy, follow these steps:
Parameter Optimization:
Adjust the input parameters such as fastLength, slowLength, and signalLength to tune the MACD indicator to the specific asset you’re trading. The values provided are typical defaults, but optimizing these values based on backtesting can help improve performance.
Customize the scoring parameters (crossscore, indiside, histside) to balance how much weight you want to put on the direction, histogram, and cross events of the MACD indicator.
Select Appropriate Timeframes:
This strategy employs a multi-timeframe (MTF) approach, so it's important to understand how the higher timeframe (HTF) is selected based on the current timeframe. For instance, if you are trading on a 5-minute chart, the higher timeframe will be 15 minutes, which helps filter out lower timeframe noise.
Ensure you understand the relationship between the timeframe you’re using and the HTF it automatically selects. The strategy’s effectiveness can vary depending on how these timeframes align with the asset’s overall volatility.
Run Backtests:
Always backtest the strategy over historical data to determine its reliability for the asset and timeframes you’re interested in. Note that the MTF approach may require substantial data to capture how different timeframes interact.
Use the backtest results to adjust the scoring parameters or the Stop Loss Factor (Mult) for better risk management.
Stop Loss Usage:
The stop loss is calculated dynamically using ATR, which means that it adjusts with changing volatility. This can be useful to avoid being stopped out too often during periods of increased volatility.
The shotsl parameter can be set to true to visualize the stop loss line on the chart. This helps to monitor the protection level and make better decisions regarding holding or closing a trade manually.
Entry Signals and Trade Execution:
Look for changes in the Result value to determine entry points. For a long position, the Result needs to become positive, and for a short position, it must be negative.
Note that the strategy's entries are more conservative because it waits for the Result to confirm the direction using multiple factors, which helps filter out false breakouts.
Risk Management:
The adaptive stop loss mechanism reduces the risk by basing the stop level on market volatility. However, you must still consider additional risk management practices such as position sizing and profit targets.
Given the scoring mechanism, it might not enter trades frequently, which means using this strategy may result in fewer but potentially more accurate trades. It’s important to be patient and not force trades that don’t align with the calculated results.
Real-Time Monitoring:
Make sure to monitor trades actively. Since the strategy recalculates the score on each bar, real-time changes in the Result value could provide exit opportunities even if the stop loss isn't triggered.
Summary
The "MACD Enhanced Strategy MTF with Stop Loss " is a sophisticated version of the MACD strategy, enhanced with multi-timeframe analysis and adaptive stop loss. Properly using it involves optimizing MACD and scoring parameters, selecting suitable timeframes, and actively managing entries and exits based on a combination of scoring and volatility-based stop losses. Always conduct thorough backtesting before applying it in a live environment to ensure the strategy performs well on the asset you're trading.
SMA Cross Counter - MTF SmoothTitle Idea
SMA Cross Counter - MTF Smooth (Find the 50-Bar Sweet Spot)
Description
Overview
This indicator tracks and displays the number of bars elapsed since the current 20SMA crossed the Higher Timeframe (HTF) 20SMA. By quantifying the "age" of a trend, it is designed to help traders identify high-probability pullbacks with objective precision.
Strategy: The 50-Bar Sweet Spot
This script is built around a specific tactical observation:
The Target: A "One-Cushion Granville Setup" occurring approximately 50 bars after the crossover is often a high-probability "Sweet Spot." At this stage, the trend is usually well-established but still possesses significant momentum.
The Edge: By monitoring the counter in the bottom-right corner, you can move away from subjective "feel" and objectively judge the trend's maturity. It helps you avoid the high volatility of an early cross and the exhaustion risks of a late-stage trend (e.g., over 100 bars).
Key Features
Automatic MTF Selection The reference timeframe updates automatically as you switch charts.
1m chart → 5m SMA
5m chart → 30m (or 15m) SMA
15m chart → 1h SMA
Daily chart → Weekly SMA, and so on.
Smooth MTF Visualization Eliminates the "stepped/staircase" effect common in MTF indicators. It connects higher-TF data points with smooth, diagonal lines, maintaining a clean chart and showing the true slope of the trend.
Real-Time Bar Counter Resets to "0" at the exact moment of a crossover and increments by 1 with every new bar.
Settings
5m Chart Reference: Choose between 30m or 15m as the HTF source when trading on a 5m chart.
SMA Period: Defaults to 20, but fully adjustable to fit your specific strategy.
タイトル案
SMA Cross Counter - MTF Smooth (50本目のスイートスポット判定)
説明文(日本語)
概要
このインジケーターは、現在の20SMAが上位足の20SMAと交差してからの「経過バー数」をリアルタイムでカウントし、右下のテーブルに表示します。 単なるクロスの確認ではなく、トレンドの「経過時間」を数値化することで、押し目買い・戻り売りの精度を極限まで高めるために開発されました。
戦略:50本目のスイートスポット
本インジケーターは、以下のトレード理論をベースに設計されています。
狙い目: SMA同士がクロスしてから50本程度経過したタイミングでの「ワンクッショングランビル」は、トレンドの勢いが安定し、かつ伸び代が最も残されている**「スイートスポット」**となる可能性が高い。
メリット: 右下のカウンターを見るだけで、感覚に頼らず「今がトレンドの何合目か」を客観的に判断できます。クロス直後の不安定な時期や、100本を超えたトレンド終盤の失速リスクを避けるのに有効です。
主な機能
自動タイムフレーム選定 (Auto-MTF) チャートの時間軸を切り替えるだけで、表示中の足に合わせて最適な上位足を自動選択します。(例:5分足なら30分足SMA、15分足なら1時間足SMAなど)
滑らかな上位足ライン MTF特有の「階段状のギザギザ」を排除。上位足の確定値を直線で結ぶため、チャートを美しく保ちつつ、正確なトレンドの傾きを確認できます。
リアルタイム・カウンター SMAがクロスした瞬間に「0」へリセット。以降、1本ごとに加算されます。
設定項目
5分足チャート時の参照先: 上位足を「30分」にするか「15分」にするかを切り替え可能。
SMA期間: デフォルトは20。ご自身の手法に合わせて調整してください。

SMA Reversal Sequential MTF - Pure Confirmed Final V2SMA Reversal Sequential MTF - Detailed Indicator Manual
This indicator identifies trend reversal points based on the shape of a Simple Moving Average (SMA) and monitors these signals across multiple timeframes (MTF). By synchronizing trends from various intervals, it provides a robust framework for identifying high-probability entry points.
1. Core Logic Overview
The indicator detects "peaks" and "troughs" in the SMA to identify potential reversal points.
Bullish Reversal (UP): Occurs when the SMA turns upward after a period of decline (forming a "trough").
Bearish Reversal (DN): Occurs when the SMA turns downward after a period of inclination (forming a "peak").
In addition to detecting these turns, the indicator tracks the high/low prices of the most recent reversal points on a "Confirmed Bar" basis. When the current price breaks these levels, it confirms a trend continuation or a breakout.
2. Full Description of Input Settings
Basic Settings / Main Settings
Use Short Period (5, 4, 7) / 短期設定を使用:
true: Increases sensitivity to price movements by using shorter parameters (e.g., SMA 5). Suitable for scalping.
false: Uses standard parameters (e.g., SMA 20). Suitable for day trading and swing trading.
Timeframe Visibility / 時間足表示設定
Allows individual toggling of visibility for each timeframe's labels and lines.
Show 1M to 1m / 1M〜1m表示: Individually enable or disable the calculation and display of data for Monthly (1M), Weekly (1W), Daily (Daily), 4H, 1H, 15M, 5M, and 1m timeframes.
Hide Higher TF Settings on Lower TFs / 下位足での上位設定を非表示: When enabled, this removes lower timeframe data from higher timeframe charts to reduce visual noise.
Drawing Options / 表示オプション
Show Only Current TF Labels / 現在足のラベルのみ表示: If enabled, only labels corresponding to the chart's current interval (e.g., "5" labels on a 5M chart) will be displayed.
Show Trendlines & Channels / トレンドライン&チャネルを表示: Automatically draws trendlines and parallel channels by connecting recent local reversal points on the current timeframe.
Show Sequential Labels / 転換点ラベル表示: Displays timeframe labels (e.g., "15", "1H") at the exact point where the SMA reversed.
Show Break Lines / ブレイクライン表示: Draws horizontal lines from the most recent peaks or troughs and displays a "BREAK" label when price crosses them.
Break Label Offset / ブレイク文字の右オフセット: Adjusts the horizontal distance of the "BREAK" label from the current bar for better visibility.
Additional Alert Settings / 追加アラート設定
Alert 1: Current + 2 Higher TFs Sync (Blue/Red) / アラート1: 現在・上位2つ同調:
Triggers a notification when the trend (UP/DN) of the current chart's timeframe, the next higher timeframe, and the second higher timeframe all align.
Alert 2: 4-TF Sync Including Current (Orange) / アラート2: 表示足を含む4足同調:
Triggers a notification when four consecutive timeframes (Current + 3 Higher) align in the same direction. This is considered a high-conviction signal.
3. How to Read the Dashboard (Table)
The compact table in the top-right corner displays the current trend status for key timeframes in real-time.
Blue Background (UP): Indicates price has broken the recent peak, confirming an uptrend for that timeframe.
Red Background (DN): Indicates price has broken the recent trough, confirming a downtrend for that timeframe.
Gray Background: Indicates the trend status is yet to be determined or is in a neutral state.
The table items are fixed to show 1D, 4H, 1H, 15M, and 5M from top to bottom. When all rows turn the same color, it indicates a strong market trend across the entire spectrum.
4. Key Feature: MTF Sync Alerts
The primary advantage of this indicator is its automation of manual Multi-Timeframe Analysis.
3-TF Sync: On a 15M chart, if the 15M, 1H, and 4H trends align, a small Blue (Buy) or Red (Sell) label appears on the chart.
4-TF Sync: If the alignment extends to a 4th timeframe (e.g., up to the Daily timeframe on a 15M chart), an Orange label is displayed, signaling a very strong trend confluence.
このインジケーター(SMA Reversal Sequential MTF)は、移動平均線(SMA)の形状からトレンドの転換点を特定し、それを複数の時間足(MTF)で監視・同期させることで、高精度なエントリーポイントを探るためのツールです。
以下に、すべてのインプット項目を含む詳細な説明をまとめました。
1. 概要と基本ロジック
このインジケーターは、SMA(単純移動平均線)が「山」や「谷」を作ったポイントを転換点として認識します。
上昇転換: SMAが一定期間、下降した後に上昇へ転じた(谷を作った)タイミング。
下降転換: SMAが一定期間、上昇した後に下降へ転じた(山を作った)タイミング。
これに加えて、直近の転換点の価格(高値・安値)を「確定足」で更新し、そのラインを価格がブレイクした際にトレンドの継続や転換を判定します。
2. インプット項目の詳細
基本設定 / Main Settings
短期設定を使用 (5, 4, 7):
true(チェックあり): 短期的な動きに敏感になります(SMA 5期間など)。スキャルピング向け。
false(チェックなし): 標準的な設定(SMA 20期間など)。デイトレード・スイング向け。
時間足表示設定 / Timeframe Visibility
各時間足のラベルやラインを表示するかどうかを個別に設定します。
1M〜1m表示: 月足(1M)から1分足(1m)まで、各MTFデータの計算・表示をオン/オフします。
下位足での上位設定を非表示: * 現在表示しているチャートより上位の時間足設定だけを表示し、ノイズを減らすためのスイッチです。
表示オプション / Drawing Options
現在足のラベルのみ表示: チェックすると、チャートの時間足と一致するラベル(例:5分足チャートなら「5」のラベル)のみ表示されます。
トレンドライン&チャネルを表示: 現在表示している足の直近の転換点同士を結び、トレンドラインと並行チャネルを自動描画します。
転換点ラベル表示: SMAが反転した位置に「15」や「1H」などの時間足ラベルを表示します。
ブレイクライン表示: 直近の転換点(高値・安値)から右側に水平線を引き、そこを価格が抜けた際に「BREAK」の文字を表示します。
ブレイク文字の右オフセット: 「BREAK」ラベルを右側にどれくらい離して表示するかを調整します。
追加アラート設定 / GRP_NEW_AL
アラート1: 現在・上位2つ同調 (青/赤):
「表示中の足 + 1つ上 + 2つ上」の計3つのトレンド(UP/DN)が一致した瞬間に通知します。
アラート2: 表示足を含む4足同調 (オレンジ):
「表示中の足 + 上位3つ」の計4つのトレンドがすべて一致した強力なサイン時に通知します。
3. テーブル(ダッシュボード)の見方
画面右上に表示されるコンパクトなテーブルは、各時間足の現在のトレンド状態をリアルタイムで示しています。
青背景(UP): 直近で高値をブレイクし、上昇トレンドにある状態。
赤背景(DN): 直近で安値をブレイクし、下降トレンドにある状態。
灰背景: 状態が未確定なケース。
表示項目は上位足から順に 1D(日足), 4H, 1H, 15M, 5M となっており、これらが一色に染まるタイミングが環境認識上の強いトレンドを示唆します。
4. 特徴的な機能:MTF同調アラート
このインジケーターの最大の強みは、手動でのマルチタイムフレーム分析を自動化している点です。
3足同調(SYNC): 15分足チャートであれば「15M・1H・4H」が同じ方向を向いた時にチャート上に青(買い)または赤(売り)の小さなラベルが表示されます。
4足同調(4-TF SYNC): さらに上位の足(15分足なら日足まで)が同調すると、オレンジ色のラベルが表示され、より強い根拠となります。

4 EMA Perfect Order + Strength + MTF + Breakdown Alerts (v6)🇯🇵 日本語説明文
📌 スクリプト概要
このスクリプトは、EMA10・20・40・80 を使用して「パーフェクトオーダー(PO)」を判定し、
PO が確定した瞬間と、PO が崩壊した瞬間の両方を自動で検知して通知します。
さらに、PO の強さ(短期と長期 EMA の乖離率)を数値化して表示し、
上位足(MTF)でも同様の判定と強さ表示が可能です。
トレンドの「始まり」と「終わり」をどちらも捉えることができる、
トレンドフォローに最適化されたインジケーターです。
🔧 機能一覧
• EMA10/20/40/80 のライン表示(黒・赤・オレンジ・青)
• パーフェクトオーダー(Bull/Bear)の自動判定
• PO確定時に矢印(▲/▼)を表示
• PO崩壊(Break)を検知してシグナル表示
• POの強さ(乖離率)をリアルタイム表示
• 上位足(MTF)での PO 判定と強さ表示
• アラート条件付き
• Bull PO 確定
• Bear PO 確定
• Bull PO 崩壊
• Bear PO 崩壊
• 背景は白で視認性を重視
📈 パーフェクトオーダーとは?
• Bull PO(上昇トレンド)
EMA10 > EMA20 > EMA40 > EMA80
• Bear PO(下降トレンド)
EMA10 < EMA20 < EMA40 < EMA80
PO が確定したバーで矢印とアラートが発生し、
PO が崩れた瞬間にもアラートが発生します。
🧠 活用例
• トレンドの勢い(強さ)を数値で把握
• 上位足のトレンドと一致しているか確認
• トレンドフォロー戦略のフィルターとして利用
• PO崩壊を使って利確・撤退の判断材料に
• MTFと組み合わせて精度を向上
🇺🇸 English Description
📌 Overview
This script detects “Perfect Order” (PO) conditions using EMA10, EMA20, EMA40, and EMA80.
It alerts you both when a PO is confirmed and when it breaks down, allowing you to capture the beginning and the end of a trend.
The script also calculates PO strength (based on EMA divergence) and supports multi‑timeframe (MTF) analysis.
This indicator is designed for traders who want to track trend momentum and identify early signs of trend reversal.
🔧 Features
• Displays EMA10/20/40/80 with color coding (black, red, orange, blue)
• Detects Bull and Bear Perfect Order conditions
• Shows arrows (▲/▼) when PO is confirmed
• Detects PO breakdown and displays a signal
• Displays PO strength as a percentage (EMA10 vs EMA80 divergence)
• Supports MTF PO detection and strength display
• Includes alert conditions:
• Bull PO confirmed
• Bear PO confirmed
• Bull PO breakdown
• Bear PO breakdown
• Clean white background for better visibility
📈 What is a Perfect Order?
• Bull PO (Uptrend): EMA10 > EMA20 > EMA40 > EMA80
• Bear PO (Downtrend): EMA10 < EMA20 < EMA40 < EMA80
Alerts are triggered both when the PO is newly confirmed and when it breaks.
🧠 Use Cases
• Measure trend momentum using PO strength
• Confirm alignment with higher timeframe trends
• Use as a trend‑following filter
• Detect early signs of trend reversal using PO breakdown
• Improve accuracy by combining MTF and PO logic

Ripster Clouds (EMA + MTF)v6 EnhancedThis is the most complete, modern, and user-friendly version of the classic Ripster EMA Clouds indicator yet — fully updated for Pine Script @version
=6 (January 2026 compliant).What It DoesPlots up to 5 local timeframe EMA clouds (8-9, 5-12, 34-50, 72-89, 180-200) with authentic Ripster coloring and transparency.
Adds 3 higher-timeframe (MTF) clouds pulled from a user-defined resolution (default Daily): 50-55, 20-21, and 34-50 — perfect for big-picture bias on intraday charts.
Clouds dynamically change color based on which EMA is on top (bullish green/blue/teal/purple → bearish red/orange/yellow).
Optional slope-colored lines for short/long EMAs.
Clean, grouped inputs with intuitive toggles.
Why This Version Is Better Than Prior OnesFeature
Older Versions (v4/v5 originals & early ports)
This v6 Enhanced Version
Pine Version
v4 or v5 (some no longer fully supported)
Fully v6 compliant – compiles cleanly today
MTF Clouds
Either none or only 2, often no color flip
3 MTF clouds with full color flipping for clear higher-TF bias
Usability
Limited toggles, cluttered defaults
"Show All Clouds & Lines" quick toggle + per-cloud on/off + sensible defaults (clouds 4/5 off)
Visual Clarity
Mixed transparency, sometimes too busy
Optimized transparency & modern color palette (works great in dark/light themes)
Flexibility
Fixed source (usually hl2)
Choice of source (close, hl2, hlc3, ohlc4, etc.)
Alerts
Usually none
Built-in alerts on tightest cloud (8-9) cross – great for momentum entries
Performance
No limits set
max_lines_count, max_labels_count, max_bars_back for smooth operation
Code Quality
Older syntax, scattered inputs
Clean, well-commented, grouped sections – easy to read/modify
Best Use CasesIntraday (10–30 min): Local clouds for entries/pullbacks, MTF for daily bias.
Swing trading (1H, 4H, Daily): Wider clouds + MTF weekly for multi-day holds.
Works beautifully on QQQ, SPY, TSLA, NVDA and any liquid stock/ETF/index.
This script combines the best of the original Ripster local clouds with powerful multi-timeframe context — all in one clean, publish-ready indicator.Copy-paste ready for TradingView public library. Enjoy the edge! Here are examples of how this enhanced version looks on charts (rich layered clouds with MTF overlay):

Smart Money Zones (FVG + OB) + MTF Trend Panel## Overview
Professional-grade institutional trading zones indicator that identifies **Fair Value Gaps (FVG)** and **Order Blocks (OB)** - key price inefficiencies where smart money operates. Includes a comprehensive **Multi-Timeframe Trend Panel** for complete market context at a glance.
## Core Features
### 🎯 Fair Value Gaps (FVG)
Fair Value Gaps occur when price moves so aggressively that it leaves an "imbalance" or "gap" in the market structure. These zones often act as magnets where price returns to find liquidity.
**Detection Logic:**
- **Bullish FVG**: When current candle's low is above the high of the candle 2 bars ago
- **Bearish FVG**: When current candle's high is below the low of the candle 2 bars ago
- Requires strong impulse candle (configurable body percentage threshold)
- Color-coded zones: Green for bullish, Red for bearish
### 📦 Order Blocks (OB)
Order Blocks represent the last opposite candle before a significant price move - the zone where institutional orders were placed before the breakout.
**Detection Logic:**
- Identifies the last bearish candle before a strong bullish breakout (Bullish OB)
- Identifies the last bullish candle before a strong bearish breakout (Bearish OB)
- Validates breakout strength using ATR multiplier (1.2x default)
- Color-coded zones: Blue for bullish, Orange for bearish
### 📊 Multi-Timeframe Trend Panel
Real-time trend analysis across **7 timeframes** displayed in an elegant dashboard:
- **1 Minute** - Ultra short-term scalping
- **5 Minutes** - Short-term momentum
- **15 Minutes** - Intraday swings
- **30 Minutes** - Session trends
- **1 Hour** - Multi-session trends
- **4 Hours** - Daily structure
- **Daily** - Long-term direction
**Visual Indicators:**
- 🟢 Green circle = Bullish trend
- 🔴 Red circle = Bearish trend
- Clean, professional table design with customizable position and size
## Intelligence Features
### 🧠 Zone Strength Rating
Every zone is automatically classified by strength based on size relative to ATR:
- **VERY STRONG** - 2.0x ATR or more (major institutional zones)
- **STRONG** - 1.5x to 2.0x ATR (significant zones)
- **MEDIUM** - 1.0x to 1.5x ATR (moderate zones)
- **WEAK** - Below 1.0x ATR (minor zones)
Strength rating helps you prioritize which zones to trade from!
### 📉 Smart Mitigation Tracking
Zones automatically track how much they've been "filled" or mitigated:
- Calculates penetration percentage as price enters the zone
- Zones turn **gray** when 50%+ mitigated or fully filled
- Option to **auto-delete** mitigated zones to keep chart clean
- Live zones extend dynamically with price action
### 🎨 Trend Filter (Optional)
When enabled, only shows zones aligned with the current trend:
- Uses customizable MA period (default 50)
- Bullish zones only appear in uptrend
- Bearish zones only appear in downtrend
- Reduces noise and false signals significantly
## Customization Options
### Display Settings
- Toggle FVGs and OBs independently
- Adjust max zones per type (5-200)
- Choose to remove or gray out mitigated zones
- Color customization for all zone types
### Detection Parameters
- **Min Impulse Body %**: Controls how strong the impulse candle must be (0.3-1.0)
- **Order Block Lookback**: How many bars to look back for OB validation (5-50)
- **ATR Length**: Period for ATR calculation (5-50)
### Trend Filter
- Enable/disable trend filtering
- Adjustable MA period for trend determination
### MTF Panel
- Show/hide the trend panel
- 4 position options: Top Right, Top Left, Bottom Right, Bottom Left
- 3 size options: Small, Normal, Large
- Customizable MA period for trend calculation across all timeframes
## Trading Applications
### 1. **Liquidity Grab Entries**
Wait for price to sweep a zone (50%+ mitigation) then enter on reversal. Smart money often "hunts" these zones before the real move begins.
### 2. **Confluence Trading**
Look for zones that align with:
- Multiple timeframe trends showing same direction
- Multiple FVGs/OBs stacking in same area
- Key support/resistance levels
### 3. **Breakout Confirmation**
Use Order Blocks to confirm the strength of breakouts. Strong OBs indicate institutional participation.
### 4. **Retracement Entries**
Enter when price returns to a fresh, unmitigated zone in the direction of the higher timeframe trend.
### 5. **Range Trading**
Identify FVG zones at range extremes - price often reverses at these inefficiencies.
## How It Works
**Fair Value Gaps** form when the middle candle creates such aggressive movement that it leaves a price gap between the high/low of surrounding candles. Institutional traders know these gaps get filled.
**Order Blocks** mark the origin of major moves. The last opposite-colored candle before a breakout is where large orders were placed. Price often returns to these zones for "retests" before continuing.
**Mitigation** happens when price returns to fill these zones. The indicator tracks this automatically, showing you which zones are still "fresh" and which have been used up.
## Best Practices
✅ **Use higher timeframe trends** - Always check the MTF panel before taking trades
✅ **Trade fresh zones** - Unmitigated zones (not gray) have the highest probability
✅ **Combine with price action** - Look for rejection wicks and engulfing candles at zones
✅ **Respect zone strength** - VERY STRONG and STRONG zones are most reliable
✅ **Use trend filter** - Especially on lower timeframes to reduce false signals
❌ **Don't overtrade** - Not every zone will react, wait for confirmation
❌ **Don't ignore context** - Check the MTF panel for conflicting trends
❌ **Don't chase** - Wait for price to come to the zone, don't enter mid-zone
## Technical Details
- **Non-repainting**: All zones are drawn on confirmed candles only
- **Performance optimized**: Uses efficient array management with per-type caps
- **Real-time updates**: Zones extend and track mitigation as price moves
- **Universal compatibility**: Works on all markets and timeframes
## Recommended Settings by Style
**Scalping (1m-5m charts):**
- Max zones: 10-15
- Use trend filter: ON
- MTF Panel: Focus on 1m-15m trends
- Remove mitigated: ON (keep chart clean)
**Day Trading (5m-1H charts):**
- Max zones: 15-20
- Use trend filter: ON
- MTF Panel: Focus on 15m-4H trends
- Remove mitigated: OFF (track zone history)
**Swing Trading (1H-D charts):**
- Max zones: 20+
- Use trend filter: Optional
- MTF Panel: Focus on 1H-1D trends
- Remove mitigated: OFF (important zones persist)
---
## Perfect For
- Smart Money Concept (SMC) traders
- ICT methodology followers
- Institutional order flow traders
- Price action traders seeking key zones
- Multi-timeframe analysis enthusiasts
**Compatible with all markets:** Forex, Crypto, Stocks, Indices, Commodities, Futures
*Trade where the institutions trade. Follow the smart money.*

The Ultimate Price Action & SMC Toolkit: Delta Zones, MTF IndicaThis is an All-in-One Pine Script indicator that seamlessly combines three advanced trading concepts:
Delta Zones (Wick Pressure): Uses Standard Deviation to identify extreme buying/selling pressure within the candlestick wicks, signaling potential stop hunts or liquidity absorption. These are plotted as critical Buy/Sell Boxes.
Multi-Timeframe (MTF) Indicators: Confirms signals using popular indicators (RSI, CCI, Stochastic) calculated from a separate, user-selected Timeframe or the current chart timeframe. This adds a crucial layer of context and momentum confirmation.
Smart Money Concepts (SMC): Automatically detects and plots Orderblocks (OBs) and Breaker Blocks based on confirmed Market Structure Breaks (MSB). This helps locate high-probability Supply and Demand zones.
Key Features:
Integrated plotting for combined indicator signals.
Flexible MTF selection for all standard oscillators.
Automatic Swing High/Low detection for SMC analysis.
Comprehensive Alert system for Delta Pressure, Orderblocks, and Breaker Zones.
Option 2: Focusing on SMC and Flow (Concise)
Title: "SMC Delta Flow: Advanced Orderblock, Breaker, and Wick Reversal Zones with MTF Filter."
Description:
An essential tool for sophisticated SMC traders. This indicator provides high-precision zones:
Smart Money Blocks: Plots Orderblocks and Breaker Blocks following Market Structure Shifts (MSS). Includes a "Chop Control" feature to invalidate re-used or weak Breakers.
Delta Reversal Zones: Pinpoints candles showing extreme high-deviation wick pressure. Use these zones to confirm reversals and identify precise entry points where liquidity was captured.
MTF Confirmation: Incorporates configurable Multi-Timeframe (MTF) RSI, CCI, and Stochastic indicators to act as a momentum filter or confirmation tool.
Add this indicator to unify your analysis of Liquidity, Market Structure, and Momentum on a single chart!
SMC, SmartMoneyConcepts, Orderblock, BreakerBlock, MTF, MultiTimeframe, Delta, Wick, Liquidity, PriceAction, RSI, Stochastic, CCI

Ripster Clouds (EMA + MTF)v6🧠 Purpose
This indicator combines Ripster EMA Clouds and Multi-Timeframe (MTF) EMA Clouds into one script.
It allows you to visualize short vs long exponential (or simple) moving averages as colored “clouds” to identify trend direction and momentum — across both your current timeframe and a higher timeframe (e.g., daily).
⚙️ Main Features
1. EMA Clouds (Local Timeframe)
Up to 5 separate EMA/SMA cloud sets (8/9, 5/12, 34/50, 72/89, 180/200 by default).
Each can be individually enabled/disabled in the settings.
MA type toggle → Choose between EMA and SMA.
Optional line display toggle for showing the short and long MA lines.
Color-coded trend clouds:
Greenish tones = bullish (short > long)
Reddish tones = bearish (short < long)
Configurable leading offset and global offset for alignment.
2. MTF Clouds (Higher Timeframe)
Two sets of higher timeframe EMA clouds (default: 50/55 and 20/21).
Uses request.security() to pull EMA data from a selected higher timeframe (default = Daily).
Optional line visibility toggle (Display Lines).
Blue and teal semi-transparent fills to distinguish from local clouds.
Each MTF cloud can be toggled independently.
3. Unified Controls
Master toggles:
✅ Show EMA Clouds
✅ Show MTF Clouds
Transparent cloud fills with dynamically changing colors based on EMA crossovers and slope.
No local-scope plot() or fill() calls — fully compliant with Pine v6 rules.
🎨 Color Logic
Each EMA cloud uses a unique color pair (5 total).
Cloud color changes dynamically based on whether the short EMA is above or below the long EMA.
Line color changes with slope:
Olive = EMA rising
Maroon = EMA falling
📊 Technical Structure
Written in Pine Script v6.
All plot() and fill() calls are at global scope to prevent compilation errors.
Uses helper functions only for math/color logic.
Performance-optimized for TradingView’s rendering limits.
🧩 Quick Setup in TradingView
Paste the script into the Pine Editor.
Add to chart.
In settings:
Toggle on/off any EMA or MTF clouds.
Adjust timeframe (Resolution), line visibility, or offsets.
Choose EMA or SMA as the base calculation.
✅ Result
You now have one unified, customizable Ripster EMA + MTF Cloud indicator, stable in Pine v6, with complete flexibility to toggle, style, and analyze multiple timeframe trends on a single chart.
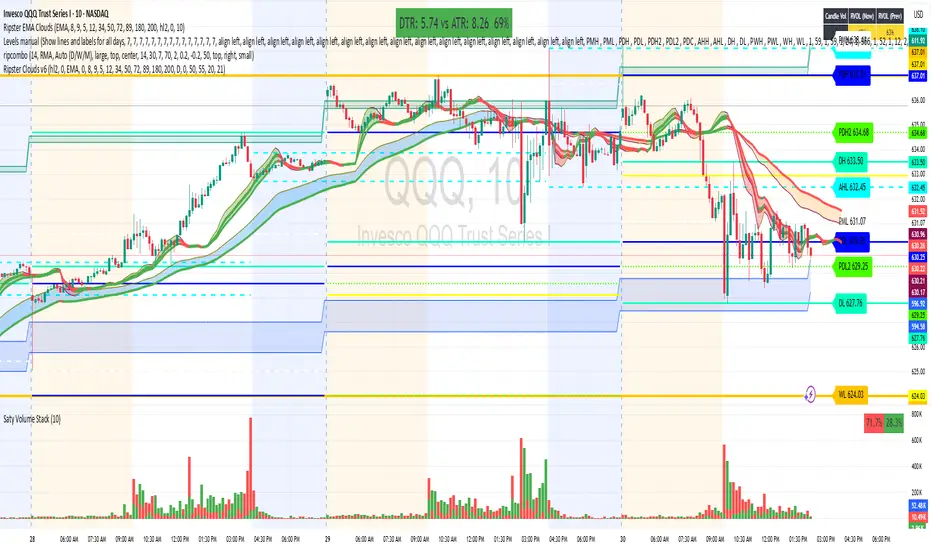
Supertrend with ADX & MTF MA Filter# **Supertrend with ADX & MTF MA Filter - Comprehensive Explanation**
---
## **1. Purpose of This Indicator**
This indicator combines three powerful technical analysis tools to create a robust trading system:
✅ **Supertrend** (Trend-following)
✅ **ADX Filter** (Trend strength confirmation)
✅ **MTF MA Filter** (Multi-timeframe trend direction confirmation)
**Primary Goals:**
✔ **Identify high-probability trend reversals** with confirmation from multiple indicators
✔ **Filter out weak trends** using ADX (Average Directional Index)
✔ **Add higher timeframe context** with MTF (Multi-TimeFrame) Moving Average
✔ **Reduce false signals** by requiring confluence between all three components
---
## **2. Core Logic & Components**
### **A. Supertrend (Base Indicator)**
- **Calculation:**
```pine
up = hl2 - (Multiplier * ATR(Periods))
dn = hl2 + (Multiplier * ATR(Periods))
```
- **Bullish trend** when price > `up` (green line)
- **Bearish trend** when price < `dn` (red line)
- **Why Supertrend?**
- Simple yet effective trend-following system
- Adapts to volatility via ATR (Average True Range)
---
### **B. ADX Filter (Trend Strength Confirmation)**
- **ADX Calculation:**
```pine
= calcADX(adxLength, adxSmoothing)
strongTrend = adxVal >= adxThreshold
```
- **ADX > Threshold (Default: 20)** = Strong trend
- **DI+ > DI-** = Bullish momentum
- **DI- > DI+** = Bearish momentum
- **Why ADX?**
- Avoids trading in choppy markets (low ADX = weak trend)
- Confirms if Supertrend signals occur in a strong trend
---
### **C. MTF MA Filter (Higher Timeframe Trend Alignment)**
- **Moving Average Calculation:**
```pine
= getMA(maSource, maLength, maType, maTF)
```
- **MA Type:** SMA, EMA, WMA, or DEMA
- **Timeframe:** Any (1m, 5m, 1H, 4H, D, W, M)
- **Trend Direction:**
- **Buy Signal:** MA must be **rising**
- **Sell Signal:** MA must be **falling**
- **Why MTF MA?**
- Aligns trades with the **higher timeframe trend**
- Reduces counter-trend entries
---
## **3. How to Use This Indicator**
### **A. Buy Conditions (All Must Be True)**
1. **Supertrend turns bullish** (price crosses above `up` line)
2. **ADX ≥ Threshold** (trend is strong)
3. **Higher timeframe MA is rising** (confirms bullish bias)
### **B. Sell Conditions (All Must Be True)**
1. **Supertrend turns bearish** (price crosses below `dn` line)
2. **ADX ≥ Threshold** (trend is strong)
3. **Higher timeframe MA is falling** (confirms bearish bias)
### **C. Recommended Settings**
| Parameter | Recommended Value | Description |
|-----------|------------------|-------------|
| **ATR Period** | 14 | Sensitivity of Supertrend |
| **Multiplier** | 1.5-3.0 | Adjust for volatility |
| **ADX Threshold** | 20-25 | Higher = stricter trend filter |
| **MA Length** | 20-50 | Smoothness of trend filter |
| **MA Timeframe** | 1H/D | Align with trading style |
---
## **4. Trading Strategies**
### **A. Trend-Following Strategy**
- **Enter:** When all 3 conditions align (Supertrend + ADX + MA)
- **Exit:** When Supertrend flips or ADX drops below threshold
### **B. Pullback Strategy**
- **Wait for:**
- Supertrend in trend direction
- ADX remains strong
- MA still aligned
- **Enter:** On pullback to Supertrend line
### **C. Multi-Timeframe Confirmation**
- **Intraday traders:** Use 4H/D MA for trend bias
- **Swing traders:** Use D/W MA for trend bias
---
## **5. Advantages Over Standard Supertrend**
✔ **Fewer false signals** (ADX filters weak trends)
✔ **Higher timeframe alignment** (avoids trading against larger trends)
✔ **Customizable MA types** (SMA, EMA, WMA, DEMA)
✔ **Works on all markets** (stocks, forex, crypto)
---
### **Final Thoughts**
This indicator is designed for traders who want **high-confidence trend signals** by combining:
🔹 **Supertrend** (entry trigger)
🔹 **ADX** (trend strength filter)
🔹 **MTF MA** (higher timeframe trend alignment)
By requiring all three components to align, it significantly improves signal quality compared to standalone Supertrend systems.
**→ Best for:** Swing trading, trend-following, and avoiding choppy markets.