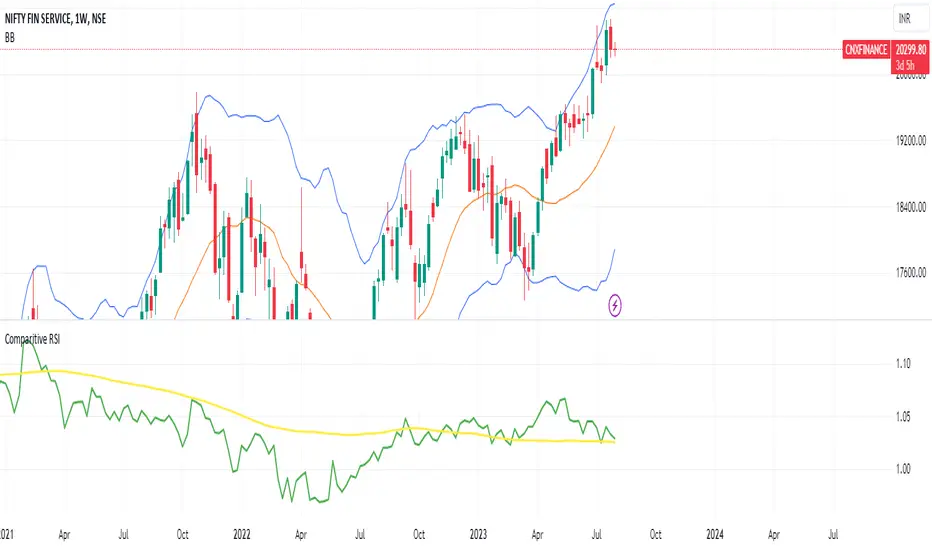
Comparative Relative StrengthIn Comparative RSI We need to Use weekly timeframe
Comparative Symbol should be Nifty and CRS moving average 100.
If the Moving avg is above the 100 period Comparative Symbol that means the stock is outperforming benchmark indices and can make position in that stock and hold till it goes below Comparative Symbol on weekly basis
Cari dalam skrip untuk "nifty"
Relative strength of a stock against the sugar index (Top 18)This indicator can be used for sugar stocks to compare their relative strength with that of their respective industry. It can also be used to gauge the momentum in sugar stocks against the other indexes like Nifty, Bank Nifty, CNXIT, CNXAUTO and check which index is outperforming the other.
Made with reference to the index published by Stef @Scheplick

Mark Minervini's Trend TemplateThe Mark Minervini Trend Template Indicator is a powerful tool designed to identify potential trends in the stock market.
Based on the renowned trading methodology developed by Mark Minervini, this indicator incorporates several key criteria to assist traders in making informed decisions.
The indicator checks the following criteria:
- Price above 50-day Moving Average (50MA):
The indicator confirms if the current price is trading above the 50-day moving average, indicating potential bullish momentum.
- Price above 150-day Moving Average (150MA):
The indicator verifies if the current price is above the 150-day moving average, suggesting a sustained upward trend.
Price above 200-day Moving Average (200MA): The indicator ensures that the current price remains higher than the 200-day moving average, indicating a strong bullish bias in the market.
- 50-day Moving Average (50MA) greater than 150-day Moving Average (150MA):
This criterion compares the 50-day moving average with the 150-day moving average and confirms if the shorter-term average is higher, signifying increasing short-term strength.
- 50-day Moving Average (50MA) greater than 200-day Moving Average (200MA):
This criterion compares the 50-day moving average with the 200-day moving average and validates if the shorter-term average is higher, indicating a potential bullish trend.
- 150-day Moving Average (150MA) greater than 200-day Moving Average (200MA):
This criterion compares the 150-day moving average with the 200-day moving average and confirms if the intermediate-term average is higher, suggesting a strengthening bullish trend.
- 200-day Moving Average (200MA) in Uptrend:
The indicator analyzes the slope of the 200-day moving average to determine if it is ascending, indicating a sustained bullish trend.
- Price within 25% of 52-week High:
The indicator assesses if the current price is trading within 25% of its 52-week high, potentially indicating a strong upward momentum and bullish sentiment.
- Price at least 25% above 52-week Low:
The indicator verifies if the current price is trading at least 25% above its 52-week low, suggesting resilience and potential bullish strength.
*Also, when you hover over the table cells, it shows the tooltip.
*By incorporating these criteria into your TradingView charts, the Mark Minervini Trend Template Indicator can help you identify potential bullish trends, enabling you to make more informed trading decisions.
*Please note that this indicator should be used to support your analysis and combined with additional technical and fundamental analysis for a comprehensive trading strategy.
***Disclaimer:
The Mark Minervini Trend Template is intended for informational and educational purposes only.
Trading involves risk, and you should consult with a financial advisor or conduct your research before engaging in any trading activities.
Add it to your favourites and start using it right away!

VIX Monitor [Zero54]NSE:BANKNIFTY1!
This is a simple but invaluable tool for both day traders and positional traders. VIX is about market expectations of volatility
The VIX is a very good and sound measure of risk in the markets. It gives these stock traders who are in intraday trading and short term traders an idea of whether the volatility is going up or going down in the market. They can calibrate their strategy accordingly. When the volatility is likely to shoot up sharply, the intraday traders run the risk of stop losses getting triggered quickly. Hence they can either reduce their leverage or they can widen their stop losses accordingly.
Also if you notice VIX is a very good and reliable gauge of index movement. If you plot the VIX and the Nifty movement you will see a clear negative correlation in the charts itself. Markets typically tend to peak out when the VIX is bottoming out and the markets tend to bottom out when the VIX is peaking out. This is a useful input for index trades.
You can use this simple indicator to monitor VIX real time. You can use it for short time frame intraday and also multi-hour, multi-day charts. You can also plot a moving average to gauge the VIX trend.
Also is the ability to monitor, Nifty and BankNifty the same way you are able to monitor the VIX (as explained above). The overall market moves in correlation with these main Indexes. So if you are trading a specific counter, you can also keep an eye on the index to get an idea where the counter may be going next.
The source code is open, please feel to modify or re-use as you feel it’s necessary. Any changes, improvements, bugs, please let me know.
Please like/boost this indicator and also add your comments, if you find it useful.

OSPL Volume [Community Edition]NSE:BANKNIFTY1!
This indicator is based on the concepts popularized by @OptionsScalper123 "Siva" of OiPulse. His ideology Is that large moves come after high volume candles. For Nifty, high volume is considered to be a candle above 125k volume and for BankNifty it’s 50k.
This indicator allows you to cut the noise and focus only on the high volume candle. It shows high volume candle in a brighter shade and lower volume candles in a less visible shade.
You can set the minimum volume threshold limit for Nifty and BankNifty. The indicator smartly recognizes which index you are using it in and uses the respective threshold volume limit.
All colors are customizable.
Thanks for Siva for all the ideas and wonderful products he has given to the community
Thanks to all the wonderful Pinescipters for developing awesome indicators and keeping the source open.
The source code of this indicator is just a few lines. Hope you can use it in your projects and learn something from this just how I learned from other scripts.
Any changes or updates needed in this indicator, please suggest. I was thinking some kind of alerts can be added when volume crosses the threshold. Let me know.
Boost/like this indicator and comment if you find this useful. Cheers and happy trading!!!

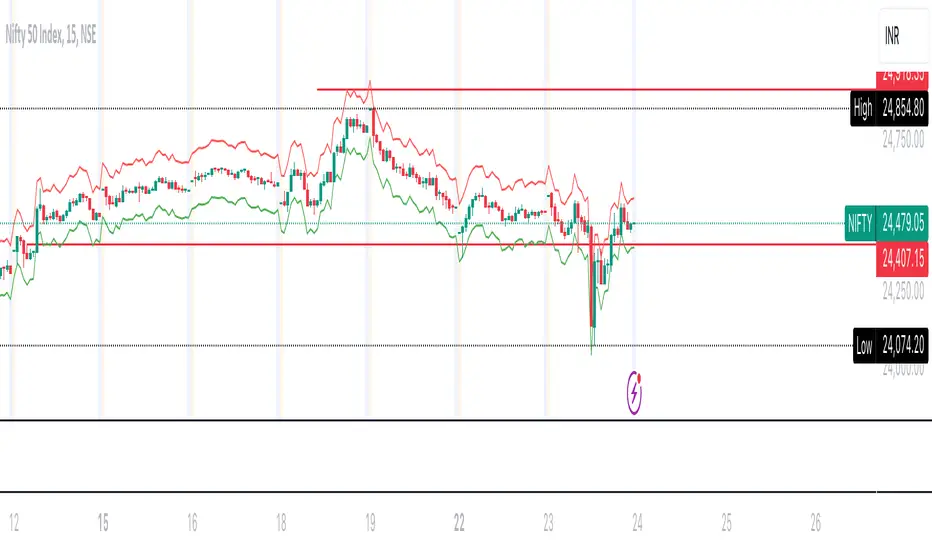
FalconRed VIXThe FalconRed Vix indicator is a trading tool designed to provide insights into the potential price range of the Nifty 50 index in India. It utilizes the IndiaVix value, which represents the annual percentage change of the Nifty 50 price. By analyzing the IndiaVix, the FalconRed Vix indicator helps traders determine the upper and lower price thresholds within which the Nifty 50 could potentially trend over the course of a year.
For example, if the Nifty 50 is currently at 18,500 and the IndiaVix is 10, it suggests that, at the given level of volatility, the Nifty 50 may experience price fluctuations of up to 10% in either direction over the course of a year. Consequently, the price range projected by the FalconRed Vix indicator would be between 16,650 and 20,350.
The indicator further extends its analysis to shorter time frames, including monthly, weekly, daily, hourly, 6-hour, 15-minute, 5-minute, and 1-minute intervals. By considering the Vix level, the FalconRed Vix indicator calculates the respective price ranges for these time frames.
When viewing the indicator on a chart, traders can observe a range band surrounding the current Nifty 50 price. The top line represents the upper threshold of the Nifty 50 price, while the bottom line represents the lower threshold, both based on the Vix level. This range band assists in determining potential selling points for out-of-the-money (OTM) options and aids in identifying entry or exit points for options and futures trading.
Traders can analyze the upper and lower threshold lines by drawing horizontal or trend lines, which can help identify potential breakouts or breakdowns. Furthermore, this analysis can assist in setting target prices and stop losses based on trend analysis.
It is important to note that the FalconRed Vix indicator is not a technical indicator used for determining stock buy or sell signals. Rather, it focuses on defining the potential price range based on the Vix level, which in turn aids in planning trading strategies such as short strangles, iron condors, and others.
Conceptive Price Moving Average [CSM]The Conceptive Price Moving Average (CPMA) is a technical indicator designed to provide a more accurate moving average of the price by using the average of various price types, such as open, close, high, low, etc. The CPMA can help to smooth out the noise and provide a clearer picture of the overall trend by taking the average of the last 3 candles for each price type and then calculating the average of those averages.
To use the CPMA for generating buy/sell signals, you can look for crossovers of the CPMA and other commonly used moving averages, such as the 9-period EMA, 20-period EMA, 50-period EMA, 100-period EMA, and 200-period EMA, which are also plotted on the chart. When the CPMA crosses above a shorter-term moving average, such as the 9-period EMA or 20-period EMA, it can indicate a potential buy opportunity, while when the CPMA crosses below a shorter-term moving average, it can indicate a potential sell opportunity.
Based on my analysis of BankNifty and Nifty, I have found that the CPMA works best at a length of 21, showing good resistance and support for stocks. Therefore, I recommend using a length of 21 when using the CPMA for generating buy/sell signals.

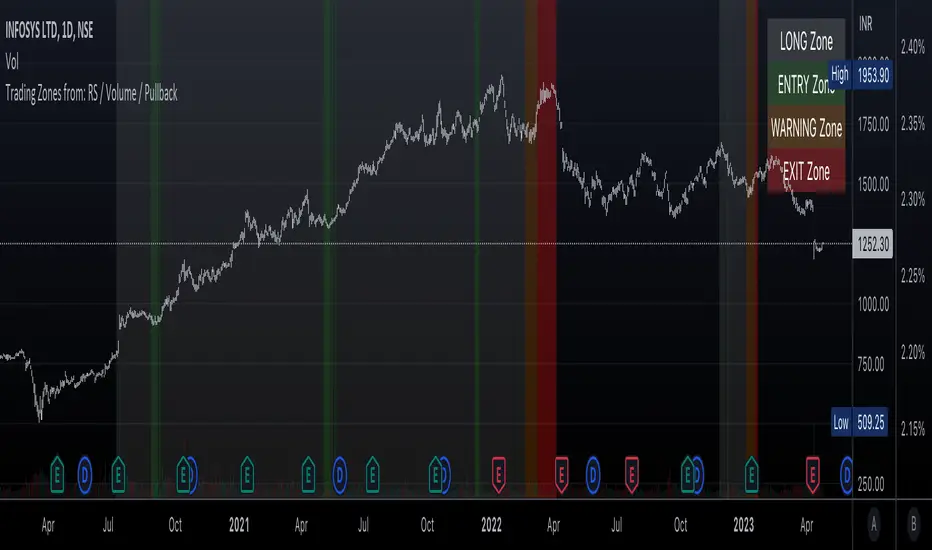
Trading Zones based on RS / Volume / PullbackThis is an Indicator which identifies different Trading Zones on the chart.
This should be Primarily used for Long Trades.
Trading Zones: and the Reasoning behind them
Long Zone -> One can do a Potential Entry (Buy) when this Zone is identified, but one could also wait for 'Entry Zone' (explained next) for a better Risk/Reward Trade.
Long Zones are identified with the help of Relative Strength and by an Intermediate Top in price.
Entry Zone -> This can be a better Risk/Reward zone to enter positions within the Long Zone.
Entry Zone is identified by a Pullback in Price & Volume contraction after the Long Zone is activated
Warning Zone -> One needs to be careful in this zone, no need to panic, Script will now try to find an Exit when Price Retraces towards Highs.
Warning Zone identifies weakness in the Price using Relative Strength of the current Stock (w.r.t. the Reference Symbol configured) and the severity of Pullback in Price.
Exit Zone -> are found only after transitioning to Warning Zone, this is a Zone which helps in minimising losses after a trade has gone into losses. Exit Zone is identified by making sure a local peak forms in Warning Zone. However, there are instances when Exit Zone detection can get prolonged when a local price peak is not formed soon enough. So one needs to be careful and use other strategies for exit.
------------------------------------------------------------------------------------
What is different in this Script:
The Script uses Relative Strength in combination with Pullback in Price from Highs in a Novel way.
Over-trading is avoided by ignoring Sideways price movements, using Relative Strength.
Only Trending Upward movement is detected and traded.
How to use this Indicator:
Use these 'Trading Zones' only as a reference so it can minimise your time in screening stocks.
Preferred Settings for using the Indicator:
Stick to 1-Day candles
Keep Relative Symbol as "Nifty" for Indian Stocks.
For US stocks, we can use "SPX" as the Relative Symbol.
//----------------
FEW EXAMPLES:
//----------------
ASIANPAINT
TATAMOTORS
TITAN
ITC
DIVISLAB
MARUTI
---------------------------------------------
Feedback is welcome.
Quad RSRelative Strength (RS) is an Indicator which measures a Stock's performance as compared to a Benchmark Index or another Stock.
For example: RS will tell you whether “A” is increasing more or less than “B” in any market condition. It is one of the tools which is best suited for Momentum Investing.
How RS can be used as a Momentum Indicator:
RS is used in identifying both the strongest and the weakest stock, or any asset class, within the market. Usually, the stocks which display strong or weak RS over a given time period tend to continue to move in the same direction.
How to calculate Relative Strength:
Divide change of "A" over some time period by the change of a particular index/stock "B" over the same time period.
This indicator oscillates around zero. If the value is greater than zero, "A" has been relatively strong compared to "B", during the selected period; if the value is less than zero, "A" has been relatively weak.
Configuration & Default settings:
The Relative symbol can be Input, default is Nifty50.
Time frame can be set, I recommend setting to Day. Default time frame is set to same as chart.
Four different periods can be set. Default values are 500, 250, 125 & 63. If time frame is set as 'Day', these numbers correspond to 2 years, 1 year, 1/2 year & 1 quarter.
Example chart: NiftyMidCap100 with Quad RS indicator with Nifty50 used as Relative Symbol, Four periods: 500, 250, 125 & 63

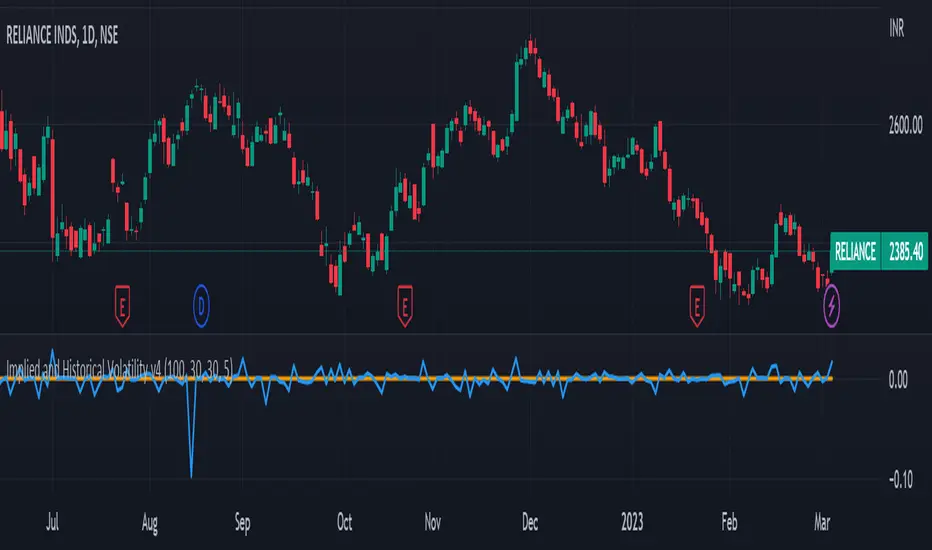
Implied and Historical Volatility v4There is a famous option strategy📊 played on volatility📈. Where people go short on volatility, generally, this strategy is used before any significant event or earnings release. The basic phenomenon is that the Implied Volatility shoots up before the event and drops after the event, while the volatility of the security does not increase in most of the scenarios. 💹
I have tried to create an Indicator using which you
can analyse the historical change in Implied Volatility Vs Historic Volatility.
To get a basic idea of how the security moved during different events.
Notes:
a) Implied Volatility is calculated using the bisection method and Black 76 model option pricing model.
b) For the risk-free rate I have fetched the price of the “10-Year Indian Government Bond” price and calculated its yield to be used as our Risk-Free rate.
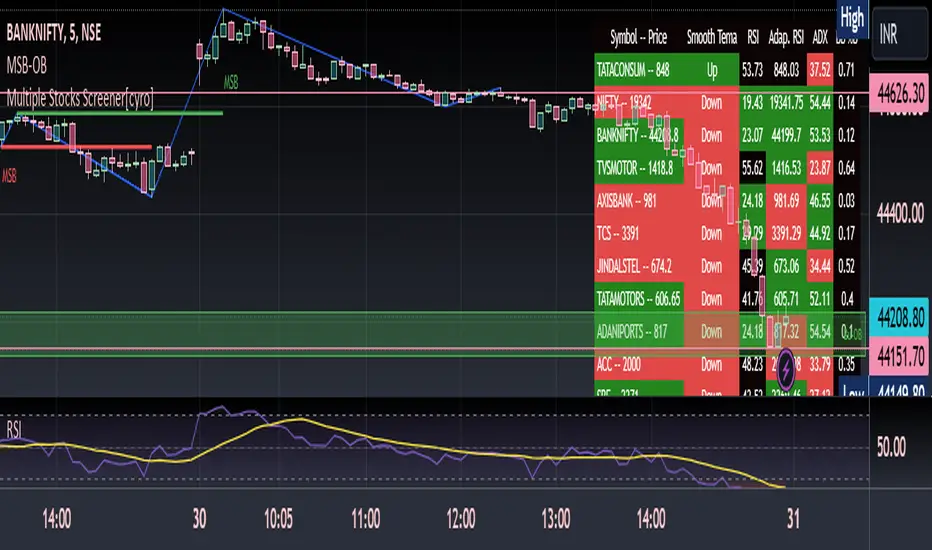
Multiple Indicators ScreenerThis is a stock screener that incorporates open source code by QuantNomad, with the addition of slow and fast EMA pullback and crossover functions. It is designed for intraday scalping and quick trades, using 1, 3, and 5 minute candles. The RSI, Supertrend, and ADX indicators help to confirm trade setups, and the use of discount, premium, and equilibrium zones can improve results. With the ability to screen 40 stocks, the screener ensures that no quick action is missed. ]
Disclaimer
It is important to note that any trade initiated using this screener should be well researched, as the creator is not responsible for any profit or loss incurred.
ATR PivotsThe "ATR Pivots" script is a technical analysis tool designed to help traders identify key levels of support and resistance on a chart. The indicator uses various metrics such as the Average True Range (ATR), Daily True Range ( DTR ), Daily True Range Percentage (DTR%), Average Daily Range (ADR), Previous Day High ( PDH ), and Previous Day Low ( PDL ) to provide a comprehensive picture of the volatility and movement of a security. The script also includes an EMA cloud and 200 EMA for trend identification and a 1-minute ATR scalping strategy for traders to make informed trading decisions.
ATR Detail:-
The ATR is a measure of the volatility of a security over a given period of time. It is calculated by taking the average of the true range (the difference between the high and low of a security) over a set number of periods. The user can input the number of periods (ATR length) to be used for the ATR calculation. The script also allows the user to choose whether to use the current close or not for the calculation. The script calculates various levels of support and resistance based on the relationship between the security's range ( high-low ) and the ATR. The levels are calculated by multiplying the ATR by different Fibonacci ratios (0.236, 0.382, 0.5, 0.618, 0.786, 1.000) and then adding or subtracting the result from the previous close. The script plots these levels on the chart, with the -100 level being the most significant level. The user also has an option to choose whether to plot all Fibonacci levels or not.
DTR and DTR% Detail:-
The Daily True Range Percentage (DTR%) is a metric that measures the daily volatility of a security as a percentage of its previous close. It is calculated by dividing the Daily True Range ( DTR ) by the previous close. DTR is the range between the current period's high and low and gives a measure of the volatility of the security on a daily basis. DTR% can be used as an indicator of the percentage of movement of the security on a daily basis. In this script, DTR% is used in combination with other metrics such as the Average True Range (ATR) and Fibonacci ratios to calculate key levels of support and resistance for the security. The idea behind using DTR% is that it can help traders to better understand the daily volatility of the security and make more informed trading decisions.
For example, if a security has a DTR% of 2%, it suggests that the security has a relatively low level of volatility and is less likely to experience significant price movements on a daily basis. On the other hand, if a security has a DTR% of 10%, it suggests that the security has a relatively high level of volatility and is more likely to experience significant price movements on a daily basis.
ADR:-
The script then calculates the ADR (Average Daily Range) which is the average of the daily range of the security, using the formula (Period High - Period Low) / ATR Length. This gives a measure of the average volatility of the security on a daily basis, which can be useful for determining potential levels of support and resistance .
PDH /PDL:-
The script also calculates PDH (Previous Day High) and PDL (Previous Day Low) which are the High and low of the previous day of the security. This gives a measure of the previous day's volatility and movement, which can be useful for determining potential levels of support and resistance .
EMA Cloud and 200 EMA Detail:-
The EMA cloud is a technical analysis tool that helps traders identify the trend of the market by comparing two different exponential moving averages (EMAs) of different lengths. The cloud is created by plotting the fast EMA and the slow EMA on the chart and filling the space between them. The user can input the length of the fast and slow EMA , and the script will calculate and plot these EMAs on the chart. The space between the two EMAs is then filled with a color that represents the trend, with green indicating a bullish trend and red indicating a bearish trend . Additionally, the script also plots a 200 EMA , which is a commonly used long-term trend indicator. When the fast EMA is above the slow EMA and the 200 EMA , it is considered a bullish signal, indicating an uptrend. When the fast EMA is below the slow EMA and the 200 EMA , it is considered a bearish signal, indicating a downtrend. The EMA cloud and 200 EMA can be used together to help traders identify the overall trend of the market and make more informed trading decisions.
1 Minute ATR Scalping Strategy:-
The script also includes a 1-minute ATR scalping strategy that can be used by traders looking for quick profits in the market. The strategy involves using the ATR levels calculated by the script as well as the EMA cloud and 200 EMA to identify potential buy and sell opportunities. For example, if the 1-minute ATR is above 11 in NIFTY and the EMA cloud is bullish , the strategy suggests buying the security. Similarly, if the 1-minute ATR is above 30 in BANKNIFTY and the EMA cloud is bullish , the strategy suggests buying the security.
Inside Candle:-
The Inside Candle is a price action pattern that occurs when the current candle's high and low are entirely within the range of the previous candle's high and low. This pattern indicates indecision or consolidation in the market and can be a potential sign of a trend reversal. When used in the 15-minute chart, traders can look for Inside Candle patterns that occur at key levels of support or resistance. If the Inside Candle pattern occurs at a key level and the price subsequently breaks out of the range of the Inside Candle, it can be a signal to enter a trade in the direction of the breakout. Traders can also use the Inside Candle pattern to trade in a tight range, or to reduce their exposure to a current trend.
Risk Management:-
As with any trading strategy, it is important to practice proper risk management when using the ATR Pivots script and the 1-minute ATR scalping strategy. This may include setting stop-loss orders, using appropriate position sizing, and diversifying your portfolio. It is also important to note that past performance is not indicative of future results and that the script and strategy provided are for educational purposes only.
In conclusion, the "ATR Pivots" script is a powerful tool that can help traders identify key levels of support and resistance , as well as trend direction. The additional metrics such as DTR , DTR%, ADR, PDH , and PDL provide a more comprehensive picture of the volatility and movement of the security, making it easier for traders to make better trading decisions. The inclusion of the EMA cloud and 200 EMA for trend identification, and the 1-minute ATR scalping strategy for quick profits can further enhance a trader's decision-making process. However, it is important to practice proper risk management and understand that past performance is not indicative of future results.
Special thanks to satymahajan for the idea of clubbing Average True Range with Fibonacci levels.

Weekly Change % This script shows Weekly Change % in Histogram. Start date of Week is Friday and End date of Week is Thursday. This script is useful for trade who deal with Weekly Options in Nifty and Bank Nifty

Distribution DaysWhat is Distribution Day?
A distribution day is when a market representative index (for example, Nifty 50) loses more than 0.2 percent in a day, with volume higher than that of the previous session.
When a distribution day occurs, it hints that big institutional investors are exiting or reducing their positions in the market. Institutional activity is what moves any market, especially in India where retail participation is small.
How does it help in sensing market weakness?
When the market is in an uptrend, the intensity of market weakness is determined by the distribution day count. An investor keeps count of all valid distribution days (as per above definition) during an uptrend.
A distribution day count of 2-3 is benign and usually normal in an uptrend. But when the count goes to 5-6, one should prepare to get his/her positions trimmed.
Distribution Day Expiry:
ven though a distribution day hints that institutions may be liquidating their positions, it loses its impact after 25 trading sessions. A distribution day is also removed from the count after the index rallies 5 percent above that day’s close.

The Ganesh TrendThe Ganesh Trend is an indicator developed by Ganesh to help Traders to identify potential trend showing candle .This indicator identifies bullish and bearish candle with some specific rules. This gives fair idea of direction of market .It is very helpful if you use it on Nifty 50 index . Candlestick developed by me is my original work . It is very helpful for new traders looking for proper entry and exit . It has stop loss and target as well . red dot shows the stop loss and green dot shows the target . taking 2-3 trades a day is good . Thank You . NSE:NIFTY

BankNifty Dash
This indicator to be used only in BankNifty , shows Values of BankNifty Index & its top constituents.
Dashboard Interpretation :
LTP - Last Traded Price.
D High - Day High.
D Low - Day Low.
I Points - Shows the contribution of top BankNifty constituents according to its weightage.
PH-PL - "PH - PL" means LTP is trading between Previous Days High( PH ) & Previous Days Low( PL ) which indicates Rangebound-ness.
"+ PH" means LTP is trading above Previous Days High( PH ) which indicates Bullish-ness.
"- PL" means LTP is trading below Previous Days Low( PL ) which indicates Bearish-ness.
ATR - Displays the Daily ATR (Average True Range) (14 period).
DTR - Current Day Range.
DTR% - Current Day Range percentage.
( DTR & DTR%, changes colour based on percent value. < 61.8 is green and > 61.8 is red.)
For example if the Daily ATR is 100 and the current range of the day is 200 this would be 200% the original move.
EMA:-
Default value of 5 is used in Fast EMA.
Default value of 21 is used in Slow EMA.
Default value of 200 is used in EMA (Used for trend direction).
User can change values from input section.
If the colour filled between Fast EMA and Slow EMA is green, the market is in a uptrend
If the colour filled between Fast EMA and Slow EMA is red, the market is in a downtrend.
ADR :-
Plots ADR (Average Day Range) zones are used as support and resistance, ADR zones are calculated using a 5 or 10 day period unless you change the settings.
PDH/PDL :-
Plots Previous Day High(PDH) and Previous Day low(PDL).

Buy and Sell Indicator This indicaor is draw time(ex 09:15 nifty 50) high and low of candle ..
for buy condition -
1) when price is crossing time candle high open a long trade
2) check for condition is this trade open less thn previous trade
if both condition are true thn open a buy trade
for sell condition -
1) when price is crossing time candle low open a short trade
2) check for condition is this trade open grater thn previous trade
if both condition are true thn open a sell trade
to build logic of 2nd condition @fikira help me thnx mate ...

3 Bank IndexSpeaking on the reason for Bank Nifty hitting record high, Saurabh Jain, AVP — Research at SMC Global Securities said, "Reason for a rally in Bank Nifty can be attributed to three major reasons — hawkish interest rate regime making overseas lending dearer for big corporates in comparison to Indian lenders, rising interest rate expected to improve margins of Indian banks and lowering of provisioning strengthening the balance sheet of banking institutions. Today, the incremental credit ratio of Indian banks is more than 100 which is also attracting buying interest among Dalal Street bulls."
On Bank Nifty's current chart pattern, Sumeet Bagadia, Executive Director at Choice Broking said, "Bank Nifty has made a higher high higher low pattern on the chart that signals continuous uptrend in the index. The immediate target for the Bank Nifty index is 44,000 but once it gives closing above 44,000, we can expect more upside in the index."

GIRISH indicatorHello traders,
This indicator is the enhancement to my previous indicator (RSI+OBV). There is combined RSI and OBV with DMI. This new indicator is combination of RSI and OBV with VWAP . I have been using this indicator for intraday trades in NIFTY & BANKNIFTY .
The white line indicates the movement of VWAP wrt current price. There default range for this has been defined as -40 to 40 .
Entry for long: When white line goes below -40, we need to wait for green background. Entry has to be taken when green background appears. If price goes below the entry point, averaging can be done once. Price will surely go long and give us good profit.
Entry for short: When white line goes above 40 , we need to wait for red background (if darker red comes, it is better) . Entry has to be taken when red background appears. If price goes above the entry point, averaging can be done once. Price will surely go down and give us good profit on short side.
PS: Please do back testing in chart before taking trades.

IT-Dual Relative StrengthOne can use this indicator to compare two security i.e. (Nifty and stock with its own sector) how it is performing in compare with preferred index ( Nifty 50 by default).
> 0 outperforming
< 0 underperforming
Works best for Daily TF, but can be applied to Weekly and monthly charts .
Can be use on smaller time frame as well, as per the number of hour you want to calculate.
Apply it to Nifty 50 , industry index, sector index or other security in similar sector
I have Added the Box table as well which shows the performance agents Nifty and selected sector.

NSE Sector PerformanceUse this indicator on daily timeframe
This indicator shows the performance of the top NSE Sectors for 4 time periods.
User has the flexibility to define the time periods (ex. Yearly Monthly Quarterly Weekly Daily
indicator shows the performance of the sector for those time periods along with 250d High/Low and distance from the High/Low
User input is provided to drill down into performance of the top stocks in those sectors.

AM's SRTAM SRT In a year, there are around 248 to 252 trading days .
On dividing the same by 2 we get 124. Even 125 / 126 can be taken.
We get SRT value by dividing Nifty Spot with 124 SMA value & SRT is applicable on Nifty in a Day Chart.
This value ranges in between 0.6 (Low) to 1.38/1.4/1.45/1.5 (High).
Ideal Entry in a stock will be at 0.6, which is very rare. You tend to buy at 0.7/0.8/0.9/1.10.
Exit from a stock will be at 1.3 - 1.5.
However generally we get a value of 0.8/0.9 and we should start investing 20 % of our capital that we have planned to invest. For every 0.1 decrease in SRT Value, we should add 20% to the stock portfolio.
Start Booking Profit if SRT value above 1.35 & book 50 % of the portfolio when SRT value is 1.45.
For Traders, as an when SRT value comes to 0.8/ 0.9. Buy when Hilega Milega gives us a clear BUY signal on Monthly Time Frame.
Stock bought at SRT value of 0.6 tend to double in a year. It generally quite rare to see a SRT Value of 0.6.

ILM NSE Futures - Open Interest Analysis - FnOUse this indicator on Daily Timeframe
This script works only on India NSE Futures (Indices and Fno Stocks)
This script pulls Stock/Index Price/Volume Info + Futures Current/Next Price/Volume/Open Interest Info
Calculates the Combined OI and identifies the OI Buildup based on the Price Change and color codes the info for easy reading
This script also calculates Stock/Futures Volume action to identify if big players are aggressively trading in Futures
Also OI Buildup to Future Volume is calculated to track the presence of big players.
Summary Row is displayed at the bottom which shows Futures Premium/Discount to Index/Stock
