Bank Nifty ParticipantsBankNifty Index is calculated based on the movements of its participants. Every time you think of why is Index going up/down, who is actively dragging the index either ways, this Indicator gives you the answer for the same in realtime!
For example : You see HDFCBank and Kotak Bank significantly up while all other banks going down but index reacting in a bullish mode, the answer lies in which Bank is contributing how much to the index! This will help you in pre-planning your trades based on the movements shown by different banks in Index calculation. Or on the other hand, you see HDFCBank on verge of breakout and you have target of 10 points, this indicator will help you in identifying how much the index will react to the 10 points movement shown by HDFC Bank which is the leading participant in Bank Nifty.
RSI column is an add-on to the participation table which will help you in getting RSI values of different banks at a glance. You will see values getting updated in realtime in live market. Checkout for customisations in indicator settings.
Note : Participants present in this indicator and their participation percentage is taken from the official NSE website.
Feel free to contribute/comment changes if any!
- Published by Soham Dixit
Cari dalam skrip untuk "nifty"

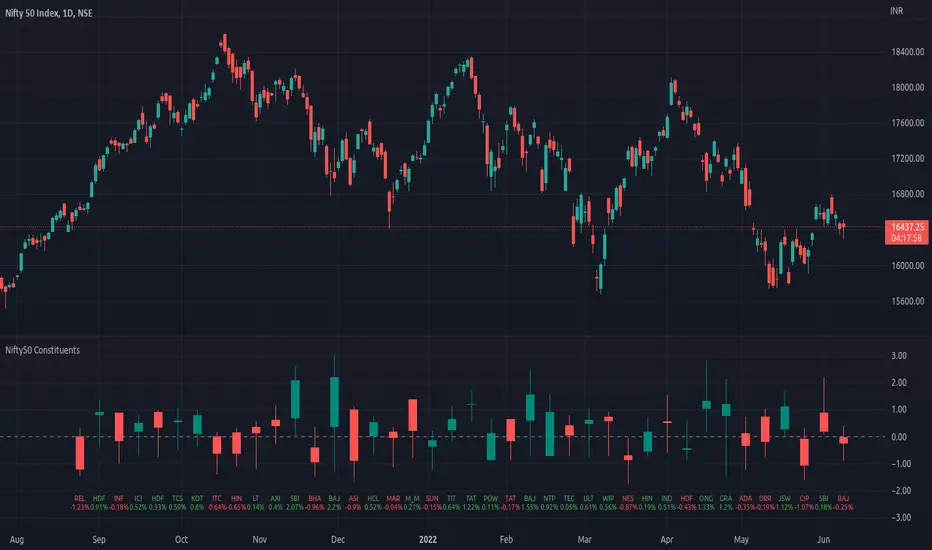
Top 40 constituents of Nifty50Displays real-time candles of top 40 constituents of Nifty50 for a given time frame, side-by-side. This gives an overall idea of breadth and depth of market movements in the time-frame.
Please note that, this is not a standard chart rendered bar-wise and may take time to load as it requests multiple securities. You could modify the contents, from settings, to include stocks from your portfolio or indices of different sectors.
NSE:NIFTY
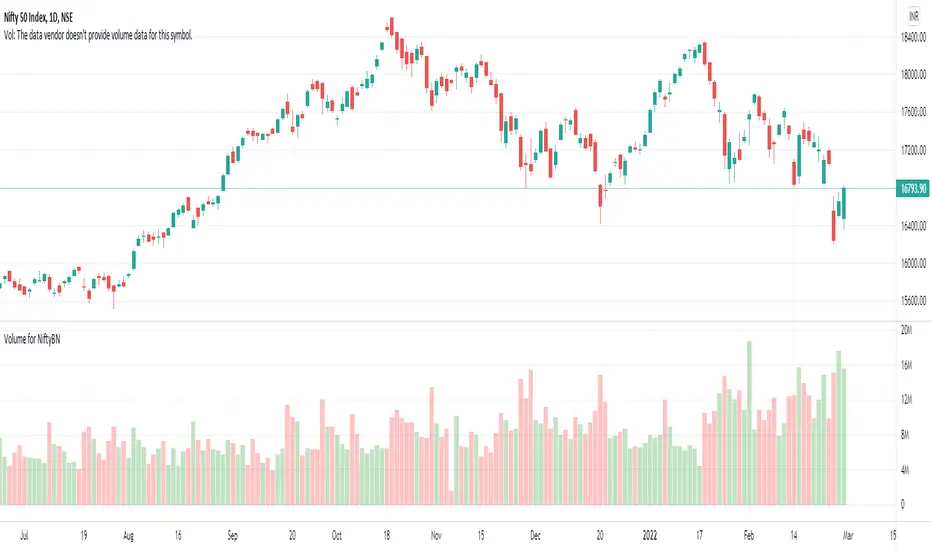
Volume for NiftyBNTo see the volume of Nifty and Banknifty indices we often refer to their Futures chart. With the help of this script, you can directly plot the volume of Nifty Futures over the Nifty chart and Bank Nifty Futures over the Bank Nifty chart.
If the scrip entered is other than Nifty or Bank Nifty it will plot the default volume of that scrip.
Bank Nifty DashboardThis shows a performance glance of Dow, India Vix and Major Constituents of Bank Nifty. Which will help to take quick decision.
Style settings
Normalized Change Mode: Allows the user to access a different interpretation of the indicator by showing the normalized first differences of each indicator in the dashboard instead of their sign
Dashboard Location: Location of the dashboard on the chart
Dashboard Size: Size of the dashboard on the chart
Text/Frame Color: Determines the color of the frame grid as well as the text color
Bullish Cell Color: Determines the color of cell associated with a rising indicator direction
Bearish Cell Color: Determines the color of cell associated with a decreasing indicator direction
Cell Transparency: Transparency of each cell
Usage
This will help to monitor the banks Performance on various time frames . You can change the stock list according to your usage/Index.
All showing in green indication strong momentum.

Custom GAP UP scanner for NIFTY StocksThe security function can be called 40 times in a codescript. We can therefore scan about 40 stocks out of NIFTY 50 stocks with a single script.
This code can be modified to search for other scripts by changing the condition function
condition() => open > (close * 1.0025)
Only stocks which have gap up of 0.25% or more will be reported.

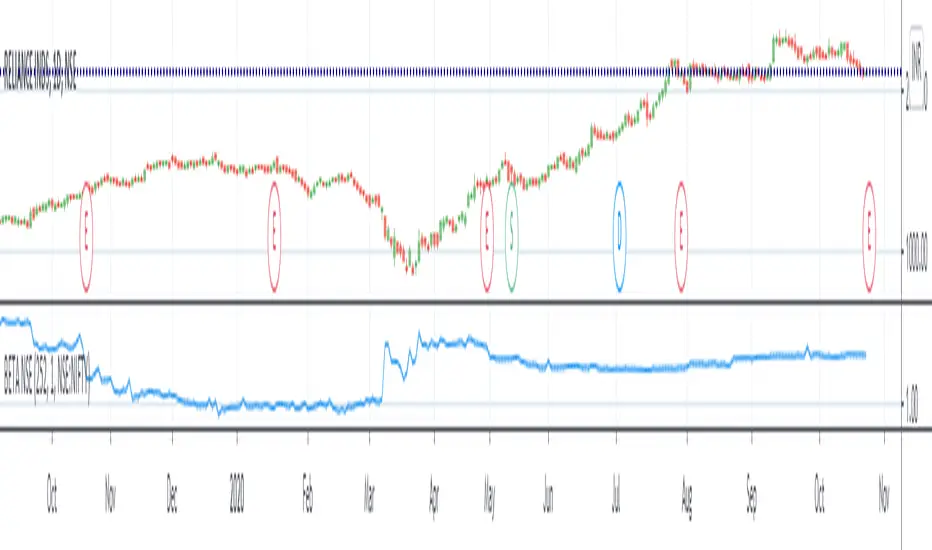
BETA (against any benchmark index - defaulted to NSE:NIFTY)Beta value of a stock relative to benchmark index. Thanks to Ricardo Santos for the original script. This script is adapted from it.
To understand beta, refer Investopedia link: www.investopedia.com
A beta value of 1 means the stock is directly correlated to benchmark index - volatility would be same as overall market.
Beta value less than 1 and greater than 0 means the stock is less volatile than the market.
Beta value more than 1 would mean the stock is more volatile than the market.
A beta value of 1.2 would roughly translate to the stock being 20% more volatile than the overall market.
A negative beta value indicates the stock is inversely correlated to market.
In the example chart, you can see the Beta value change in NSE:RELIANCE with respect to NSE:NIFTY.
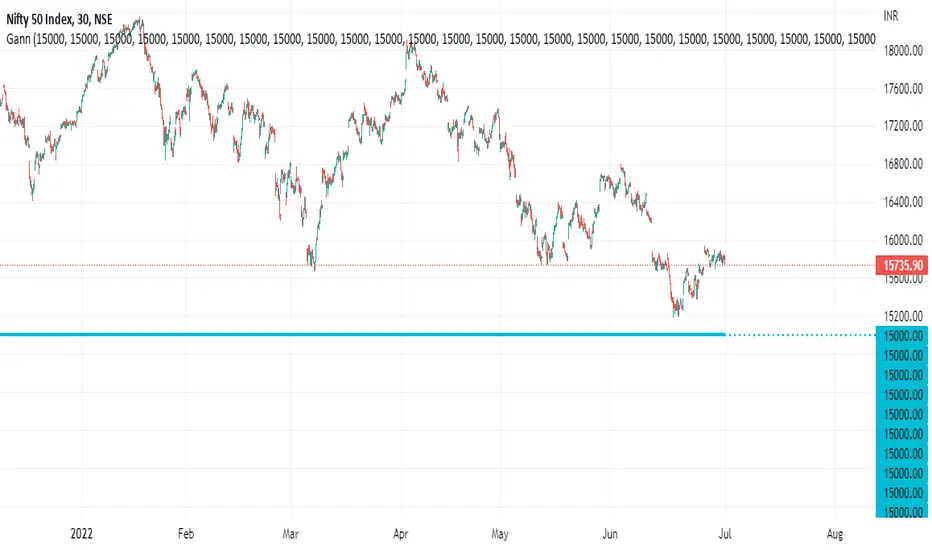
Gann Levels For Nifty Gann Levels for nifty 50 is very important to trade in options. so i create 50 gann levels for intraday trading.

Nifty 50 Scalping - Bullish Buy & Bearish Sell (5 Target / 2 SL)Nifty 50 Scalping - Bullish Buy & Bearish Sell (5 Target / 2 SL)

JJ Thursday Expiry Highlighter - NiftyThursday Expiry Highlighter
This indicator shades the background of all Thursday trading sessions on your chart — ideal for Nifty, Bank Nifty, and other Indian markets where the weekly options expiry typically occurs on Thursdays.
Features:
Highlights entire Thursday columns on any timeframe (intraday or daily).
Adjustable highlight color and transparency for maximum visibility without obscuring candles.
Makes expiry days stand out for quick recognition in both live trading and historical analysis.
Use Cases:
Quickly identify weekly option expiry days for planning.
Visually backtest expiry-day patterns or volatility setups.
Combine with other indicators for expiry-specific strategies.
Disclaimer:
This tool is for educational and informational purposes only. It does not provide financial advice and should not be relied upon as a sole basis for making investment decisions. Market conditions can change, and there is no guarantee of accuracy. Always do your own research and consult a licensed financial professional before trading or investing.

Nifty Advance/Decline Ratio - First 20 StocksNifty 20 Advance/Decline Ratio Indicator
This Pine Script tracks the Advance/Decline Ratio of the top 20 Nifty stocks (by weightage as of March 31, 2025). It helps gauge the market's strength by comparing the number of advancing vs. declining stocks among major Nifty heavyweights. The script calculates and plots the ratio, with a reference line at 1 (neutral point). This indicator resets daily and provides insights into overall market trends based on the performance of the top Nifty stocks.
Key Features:
Tracks advance/decline movements of top 20 Nifty stocks.
Plots the Advance/Decline Ratio on the chart.
Resets daily for fresh analysis.

NIFTY VWAP DistanceNIFTY Futures VWAP Distance Indicator
Track price deviation from Volume-Weighted Average Price in real-time
📈 Key Features:
Measures absolute (points) and percentage distance from VWAP
Daily session reset aligned with NSE trading hours
Dual-axis visualization with clear zero reference line
Real-time data table display for instant analysis
Typical price calculation: (H+L+C)/3 formula
Built-in safeguards against division errors
🎯 Ideal For:
Intraday traders monitoring mean reversion opportunities
Algorithmic traders needing VWAP deviation metrics
Swing traders identifying overextended price moves
Market profile analysts studying auction theory
📊 How to Use:
Apply to NIFTY Futures chart (1m-1h timeframes recommended)
Blue line = Points above/below VWAP
Red line = Percentage deviation
Positive values = Price > VWAP (bullish territory)
Negative values = Price < VWAP (bearish territory)
💡 Pro Tips:
Combine with volume profile for confirmation
Watch for >1% deviations for potential reversals
Use divergence patterns for early trend change signals
Works best with raw futures data (not continuous contracts)
🔧 Technical Specs:
Pine Script v5+
No repainting
Low latency calculations
Mobile-friendly display
"Know when price strays too far from fair value"

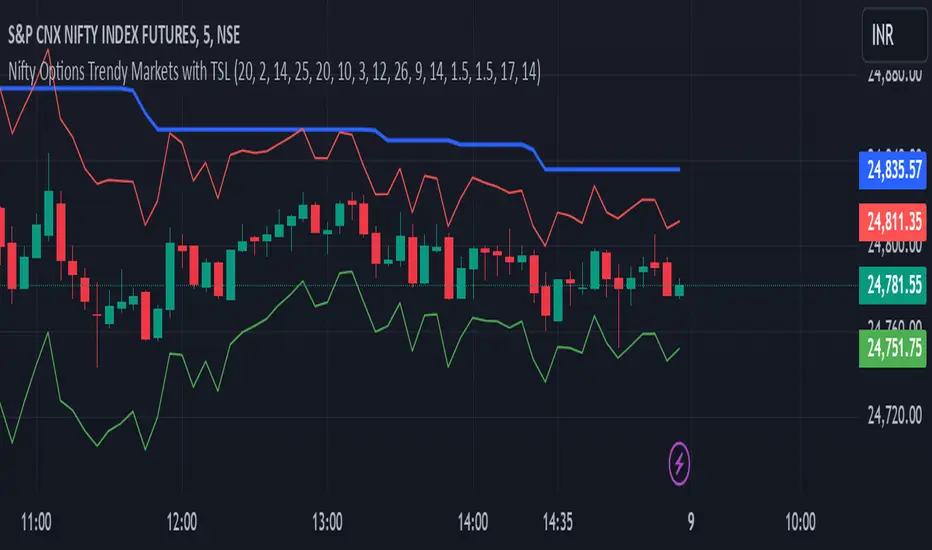
Nifty Options Trendy Markets with TSLNifty options strategy that works on volume, technical analysis etc
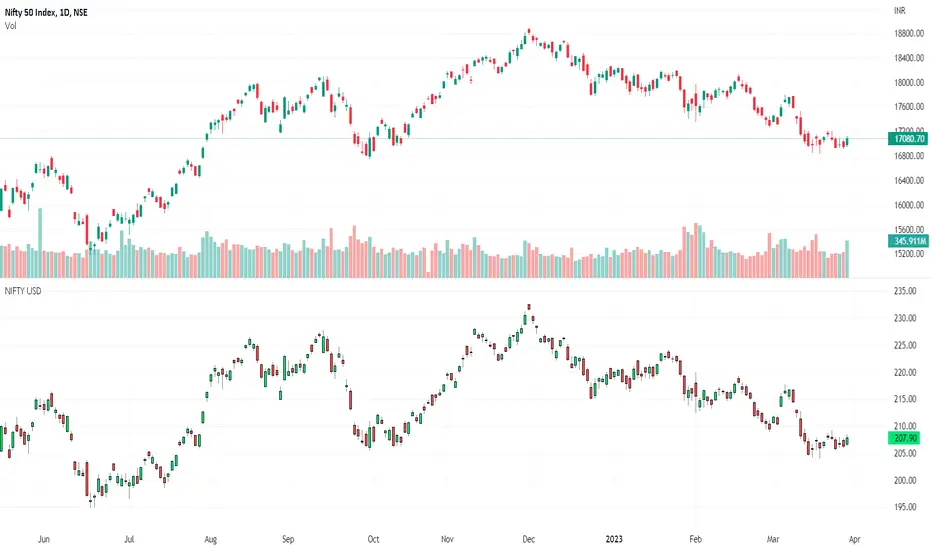
NIFTY USDNifty in terms of USD value over time.
Nifty 50 index of Indian Stock Market, in terms of US Dollar terms at that specific time.
ILM NSE Nifty DashboardUse this indicator on Daily Timeframe
This indicator shows important metrics of NIFTY and its top 7 constituent stocks (Banks are excluded as there is a separate dashboard for BANKNIFTY).
This indicator is similar to Open Interest indicator but consolidates the data for NIFTY stocks
For more information, look at the Open Interest Indicator

nifty gann & 100 levelsnifty gannlevels with 100 points defference
gann levels with manual entry of cuurent gann level
manual entry of diffeence between two gann levels

Artharjan INDIA VIX v/s Nifty Volatility DashboardHi,
I have created Artharjan INDIA VIX v/s Nifty Volatility Dashboard to forecast the Annual, Quarterly, Monthly, Weekly, Daily and Hourly Volatility of NIFTY Benchmark Index based on current value of INDIA VIX. This will help Index Options Sellers to decide the range of Nifty for the given period based on current level of volatility indicated by INDIA VIX.
Options Sellers may make use of the Min Range and Max Range values for the Strike Price Selection.
Regards
Rahul Desai
@Artharjan

Heavy Weight Stocks for Bank NiftyHeavy Weight Stocks for Bank Nifty
Stocks which are part of Bank Nifty are displayed in the table.
If the %Change > 1 then bold green
If the %Change <1 and >0, then light green
If the %Change < -1 then bold red
If the %Change > -1 and <0 then light green
NSE:BANKNIFTY
NSE:HDFCBANK
NSE:ICICIBANK
NSE:AXISBANK
NSE:KOTAKBANK
NSE:SBIN
NSE:NIFTY
NSE:RELIANCE
NSE:HDFC

QuantAnna: Nifty VIX CorrelationNSE:NIFTY
Simple correlation indicator which oscillates around zero
Shows default correlation with NSE:IndiaVix
You can use it to check correlation with any other trading symbol or indices by simply selecting it in the settings.

Relative Strength : Indian Stocks VS NIFTYIt measures the Relative strength of Indian Stocks vs NIFTY Index

Nifty 50 5mint Strategy
The script defines a specific trading session based on user inputs. This session is specified by a time range (e.g., "1000-1510") and selected days of the week (e.g., Monday to Friday). This session definition is crucial for trading only during specific times.
Lookback and Breakout Conditions:
The script uses a lookback period and the highest high and lowest low values to determine potential breakout points. The lookback period is user-defined (default is 10 periods).
The script also uses Bollinger Bands (BB) to identify potential breakout conditions. Users can enable or disable BB crossover conditions. BB consists of an upper and lower band, with the basis.
Additionally, the script uses Dema (Double Exponential Moving Average) and VWAP (Volume Weighted Average Price) . Users can enable or disable this condition.
Buy and Sell Conditions:
Buy conditions are met when the close price exceeds the highest high within the specified lookback period, Bollinger Bands conditions are satisfied, Dema-VWAP conditions are met, and the script is within the defined trading session.
Sell conditions are met when the close price falls below the lowest low within the lookback period, Bollinger Bands conditions are satisfied, Dema-VWAP conditions are met, and the script is within the defined trading session.
When either condition is met, it triggers a "long" or "short" position entry.
Trailing Stop Loss (TSL):
Users can choose between fixed points ( SL by points ) or trailing stop (Profit Trail).
For fixed points, users specify the number of points for the stop loss. A fixed stop loss is set at a certain distance from the entry price if a position is opened.
For Profit Trail, users can enable or disable this feature. If enabled, the script uses a "trail factor" (lookback period) to determine when to adjust the stop loss.
If the price moves in the direction of the trade and reaches a certain level (determined by the trail factor), the stop loss is adjusted, trailing behind the price to lock in profits.
If the close price falls below a certain level (lowest low within the trail factor(lookback)), and a position is open, the "long" position is closed (strategy.close("long")).
If the close price exceeds a certain level (highest high within the specified trail factor(lookback)), and a position is open, the "short" position is closed (strategy.close("short")).
Positions are also closed if they are open outside of the defined trading session.
Background Color:
The script changes the background color of the chart to indicate buy (green) and sell (red) signals, making it visually clear when the strategy conditions are met.
In summary, this script implements a breakout trading strategy with various customizable conditions, including Bollinger Bands, Dema-VWAP crossovers, and session-specific rules. It also includes options for setting stop losses and trailing stop losses to manage risk and lock in profits. The "trail factor" helps adjust trailing stops dynamically based on recent price movements. Positions are closed under certain conditions to manage risk and ensure compliance with the defined trading session.
CE=Buy, CE_SL=stoploss_buy, tCsl=Trailing Stop_buy.
PE=sell, PE_SL= stoploss_sell, tpsl=Trailing Stop_sell.
Remember that trading involves inherent risks, and past performance is not indicative of future results. Exercise caution, manage risk diligently, and consider the advice of financial experts when using this script or any trading strategy.

Nifty50 Swing Trading Super Indicator# 🚀 Nifty50 Swing Trading Super Indicator - Complete Guide
**Created by:** Gaurav
**Date:** August 8, 2025
**Version:** 1.0 - Optimized for Indian Markets
---
## 📋 Table of Contents
1. (#quick-start-guide)
2. (#indicator-overview)
3. (#installation-instructions)
4. (#parameter-settings)
5. (#signal-interpretation)
6. (#trading-strategy)
7. (#risk-management)
8. (#optimization-tips)
9. (#troubleshooting)
---
## 🎯 Quick Start Guide
### What You Get
✅ **2 Complete Pine Script Indicators:**
- `swing_trading_super_indicator.pine` - Universal version for all markets
- `nifty_optimized_super_indicator.pine` - Specifically optimized for Nifty50 & Indian stocks
✅ **Key Features:**
- Multi-component signal confirmation system
- Optimized for daily and 3-hour timeframes
- Built-in risk management with dynamic stops and targets
- Real-time signal strength monitoring
- Gap analysis for Indian market characteristics
### Immediate Setup
1. Copy the Pine Script code from `nifty_optimized_super_indicator.pine`
2. Paste into TradingView Pine Editor
3. Add to chart on daily or 3-hour timeframe
4. Look for 🚀BUY and 🔻SELL signals
5. Use the information table for signal confirmation
---
## 🔍 Indicator Overview
### Core Components Integration
**🎯 Range Filter (35% Weight)**
- Primary trend identification using adaptive volatility filtering
- Optimized sampling period: 21 bars for Indian market volatility
- Enhanced range multiplier: 3.0 to handle market gaps
- Provides trend direction and strength measurement
**⚡ PMAX (30% Weight)**
- Volatility-adjusted trend confirmation using ATR-based calculations
- Dynamic multiplier adjustment based on market volatility
- 14-period ATR with 2.5 multiplier for swing trading sensitivity
- Offers trailing stop functionality
**🏗️ Support/Resistance (20% Weight)**
- Dynamic level identification using pivot point analysis
- Tighter channel width (3%) for precise Indian market levels
- Enhanced strength calculation with historical interaction weighting
- Provides entry/exit timing and breakout signals
**📊 EMA Alignment (15% Weight)**
- Multi-timeframe moving average confirmation
- Key EMAs: 9, 21, 50, 200 (popular in Indian markets)
- Hierarchical alignment scoring for trend strength
- Additional trend validation layer
### Advanced Features
**🌅 Gap Analysis**
- Automatic detection of significant price gaps (>2%)
- Gap strength measurement and impact on signals
- Specific optimization for Indian market overnight gaps
- Visual gap markers on chart
**⏰ Multi-Timeframe Integration**
- Higher timeframe bias from daily/weekly data
- Configurable daily bias weight (default 70%)
- 3-hour confirmation for precise entry timing
- Prevents counter-trend trades against major timeframe
**🛡️ Risk Management**
- Dynamic stop-loss calculation using multiple methods
- Automatic profit target identification
- Position sizing guidance based on signal strength
- Anti-whipsaw logic to prevent false signals
---
## 📥 Installation Instructions
### Step 1: Access TradingView
1. Open TradingView.com
2. Navigate to Pine Editor (bottom panel)
3. Create a new indicator
### Step 2: Copy the Code
**For Nifty50 & Indian Stocks (Recommended):**
```pinescript
// Copy entire content from nifty_optimized_super_indicator.pine
```
**For Universal Use:**
```pinescript
// Copy entire content from swing_trading_super_indicator.pine
```
### Step 3: Configure and Apply
1. Click "Add to Chart"
2. Select daily or 3-hour timeframe
3. Adjust parameters if needed (defaults are optimized)
4. Enable alerts for signal notifications
### Step 4: Verify Installation
- Check that all components are visible
- Confirm information table appears in top-right
- Test with known trending stocks for signal validation
---
## ⚙️ Parameter Settings
### 🎯 Range Filter Settings
```
Sampling Period: 21 (optimized for Indian market volatility)
Range Multiplier: 3.0 (handles overnight gaps effectively)
Source: Close (most reliable for swing trading)
```
### ⚡ PMAX Settings
```
ATR Length: 14 (standard for daily/3H timeframes)
ATR Multiplier: 2.5 (balanced for swing trading sensitivity)
Moving Average Type: EMA (responsive to price changes)
MA Length: 14 (matches ATR period for consistency)
```
### 🏗️ Support/Resistance Settings
```
Pivot Period: 8 (shorter for Indian market dynamics)
Channel Width: 3% (tighter for precise levels)
Minimum Strength: 3 (higher quality levels only)
Maximum Levels: 4 (focus on strongest levels)
Lookback Period: 150 (sufficient historical data)
```
### 🚀 Super Indicator Settings
```
Signal Sensitivity: 0.65 (balanced for swing trading)
Trend Strength Requirement: 0.75 (high quality signals)
Gap Threshold: 2.0% (significant gap detection)
Daily Bias Weight: 0.7 (strong higher timeframe influence)
```
### 🎨 Display Options
```
Show Range Filter: ✅ (trend visualization)
Show PMAX: ✅ (trailing stops)
Show S/R Levels: ✅ (key price levels)
Show Key EMAs: ✅ (trend confirmation)
Show Signals: ✅ (buy/sell alerts)
Show Trend Background: ✅ (visual trend state)
Show Gap Markers: ✅ (gap identification)
```
---
## 📊 Signal Interpretation
### 🚀 BUY Signals
**Requirements for BUY Signal:**
- Price above Range Filter with upward trend
- PMAX showing bullish direction (MA > PMAX line)
- Support/resistance breakout or favorable positioning
- EMA alignment supporting upward movement
- Higher timeframe bias confirmation
- Overall signal strength > 75%
**Signal Strength Indicators:**
- **90-100%:** Extremely strong - Maximum position size
- **80-89%:** Very strong - Large position size
- **75-79%:** Strong - Standard position size
- **65-74%:** Moderate - Reduced position size
- **<65%:** Weak - Wait for better opportunity
### 🔻 SELL Signals
**Requirements for SELL Signal:**
- Price below Range Filter with downward trend
- PMAX showing bearish direction (MA < PMAX line)
- Resistance breakdown or unfavorable positioning
- EMA alignment supporting downward movement
- Higher timeframe bias confirmation
- Overall signal strength > 75%
### ⚖️ NEUTRAL Signals
**Characteristics:**
- Conflicting signals between components
- Low overall signal strength (<65%)
- Range-bound market conditions
- Wait for clearer directional bias
### 📈 Information Table Guide
**Component Status:**
- **BULL/BEAR:** Current signal direction
- **Strength %:** Component contribution strength
- **Status:** Additional context (STRONG/WEAK/ACTIVE/etc.)
**Overall Signal:**
- **🚀 STRONG BUY:** All systems aligned bullish
- **🔻 STRONG SELL:** All systems aligned bearish
- **⚖️ NEUTRAL:** Mixed or weak signals
---
## 💼 Trading Strategy
### Daily Timeframe Strategy
**Setup:**
1. Apply indicator to daily chart of Nifty50 or Indian stocks
2. Wait for 🚀BUY or 🔻SELL signal with >75% strength
3. Confirm higher timeframe bias alignment
4. Check for significant support/resistance levels
**Entry:**
- Enter on signal bar close or next bar open
- Use 3-hour chart for precise entry timing
- Avoid entries during major news events
- Consider gap analysis for overnight positions
**Position Sizing:**
- **>90% Strength:** 3-4% of portfolio
- **80-89% Strength:** 2-3% of portfolio
- **75-79% Strength:** 1-2% of portfolio
- **<75% Strength:** Avoid or minimal size
### 3-Hour Timeframe Strategy
**Setup:**
1. Confirm daily timeframe bias first
2. Apply indicator to 3-hour chart
3. Look for signals aligned with daily trend
4. Use for entry/exit timing optimization
**Entry Refinement:**
- Wait for 3H signal confirmation
- Enter on pullbacks to key levels
- Use tighter stops for better risk/reward
- Monitor intraday support/resistance
### Risk Management Rules
**Stop Loss Placement:**
1. **Primary:** Use indicator's dynamic stop level
2. **Secondary:** Below/above nearest support/resistance
3. **Maximum:** 2-3% of portfolio per trade
4. **Trailing:** Move stops with PMAX line
**Profit Taking:**
1. **Target 1:** First resistance/support level (50% position)
2. **Target 2:** Second resistance/support level (30% position)
3. **Runner:** Trail remaining 20% with PMAX
**Position Management:**
- Review positions at daily close
- Adjust stops based on new signals
- Exit if trend changes to opposite direction
- Reduce size during high volatility periods
---
## 🎯 Optimization Tips
### For Nifty50 Trading
- Use daily timeframe for primary signals
- Monitor sector rotation impact
- Consider index futures for better liquidity
- Watch for RBI policy and global cues impact
### For Individual Stocks
- Verify stock follows Nifty correlation
- Check sector-specific news and events
- Ensure adequate liquidity for position size
- Monitor earnings calendar for volatility
### Market Condition Adaptations
**Trending Markets:**
- Increase position sizes for strong signals
- Use wider stops to avoid whipsaws
- Focus on trend continuation signals
- Reduce counter-trend trading
**Range-Bound Markets:**
- Reduce position sizes
- Use tighter stops and quicker profits
- Focus on support/resistance bounces
- Increase signal strength requirements
**High Volatility Periods:**
- Reduce overall exposure
- Use smaller position sizes
- Increase stop-loss distances
- Wait for clearer signals
### Performance Monitoring
- Track win rate and average profit/loss
- Monitor signal quality over time
- Adjust parameters based on market changes
- Keep trading journal for pattern recognition
---
## 🔧 Troubleshooting
### Common Issues
**Q: Signals appear too frequently**
A: Increase "Trend Strength Requirement" to 0.8-0.9
**Q: Missing obvious trends**
A: Decrease "Signal Sensitivity" to 0.5-0.6
**Q: Too many false signals**
A: Enable "3H Confirmation" and increase strength requirements
**Q: Indicator not loading**
A: Check Pine Script version compatibility (requires v5)
### Parameter Adjustments
**For More Sensitive Signals:**
- Decrease Signal Sensitivity to 0.5-0.6
- Decrease Trend Strength Requirement to 0.6-0.7
- Increase Range Filter multiplier to 3.5-4.0
**For More Conservative Signals:**
- Increase Signal Sensitivity to 0.7-0.8
- Increase Trend Strength Requirement to 0.8-0.9
- Enable all confirmation features
### Performance Issues
- Reduce lookback periods if chart loads slowly
- Disable some visual elements for better performance
- Use on liquid stocks/indices for best results
---
## 📞 Support & Updates
This super indicator combines the best of Range Filter, PMAX, and Support/Resistance analysis specifically optimized for Indian market swing trading. The multi-component approach significantly improves signal quality while the built-in risk management features help protect capital.
**Remember:** No indicator is 100% accurate. Always combine with proper risk management, market analysis, and your trading experience for best results.
**Happy Trading! 🚀**
