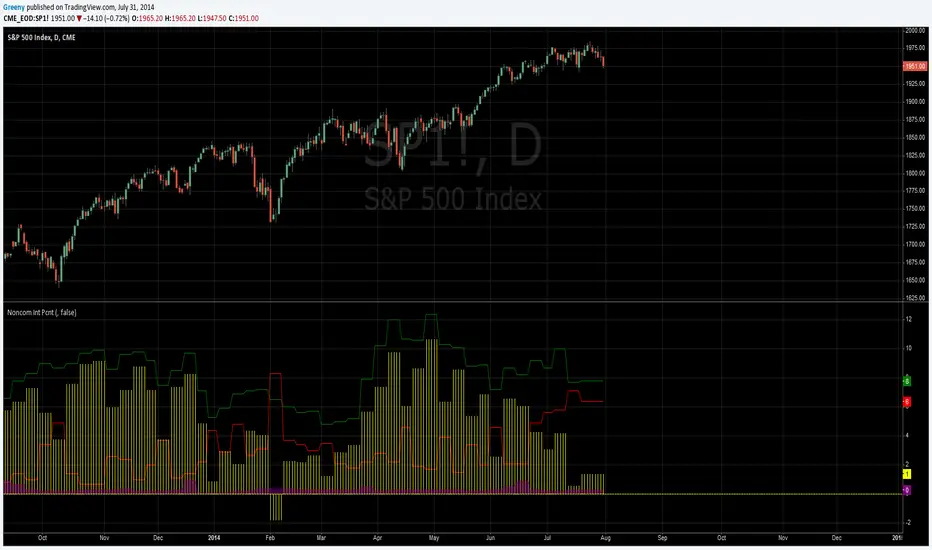
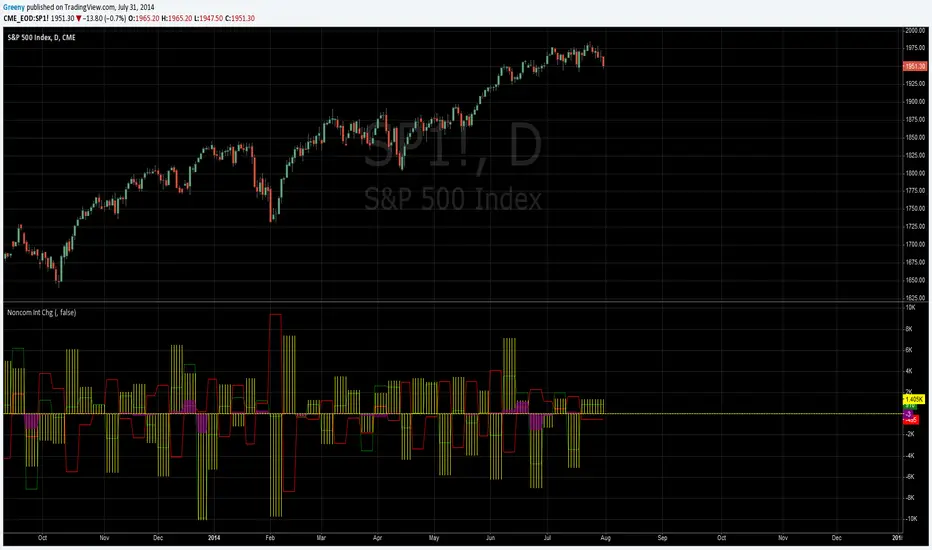
Non-commercial Interest Percent Comparison Non-FXThis script compares IMM CFTC net positioning in percentage terms for several instruments.
Load it onto any weekly chart. The data displayed is independent of the chart instrument.
On the Inputs tab, uncheck "Show Legend" to hide the legend (useful if you want to change the plot colours or it is getting in the way).
On the Inputs tab, select "Total OI" to show the net positions expressed as a percentage of Total Open Interest; or "Non-com positions" to show them expressed as a percentage of Non-commercial Longs + Shorts. The default is "Total OI".
On the Style tab, change the plot colours, etc. as necessary. Note that the legend will not reflect the new colours.
This is the second version. I had to rename it and publish it as new because I couldn't update the published version, despite it being almost exactly the same. Please feel free to copy and modify it however you wish.
An FX version is also available.
Cari dalam skrip untuk "open interest"

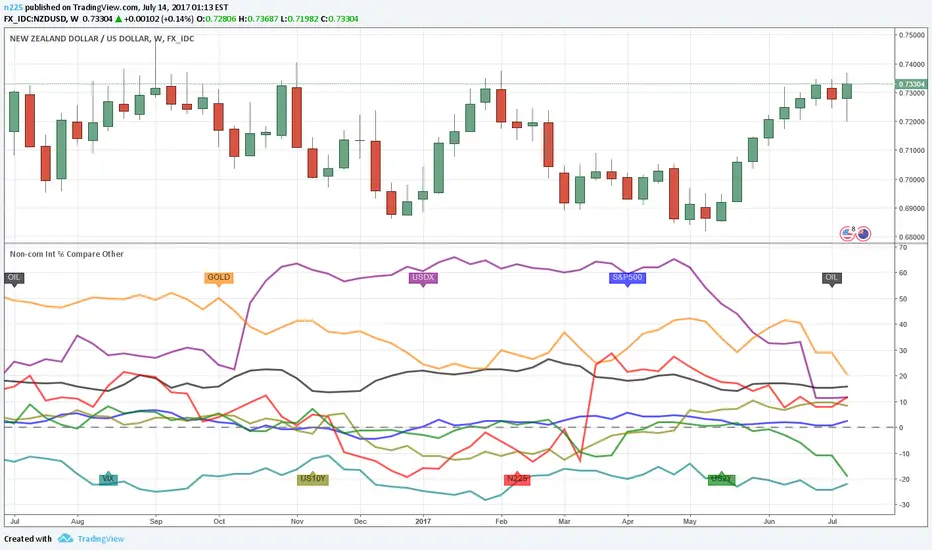
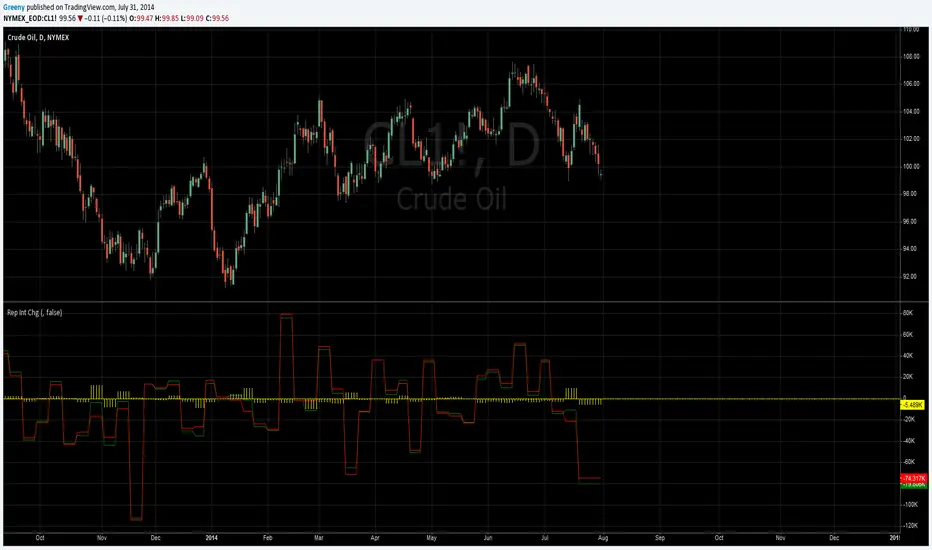
Non-commercial Interest Percent Comparison OtherThis script compares IMM CFTC net positioning in percentage terms for several instruments.
Load it onto any weekly chart. The data displayed is independent of the chart instrument.
On the Inputs tab, uncheck "Show Legend" to hide the legend (useful if you want to change the plot colours or it is getting in the way).
On the Inputs tab, select "Total OI" to show the net positions expressed as a percentage of Total Open Interest; or "Non-com positions" to show them expressed as a percentage of Non-commercial Longs + Shorts. The default is "Total OI".
On the Style tab, change the plot colours, etc. as necessary. Note that the legend will not reflect the new colours.
This is my first script and I couldn't get some things working as I wanted (such as multi-line declared functions and if-then-else blocks), so sorry the code's a bit clunky. Please feel free to copy and modify it however you wish.
An FX version is also available.
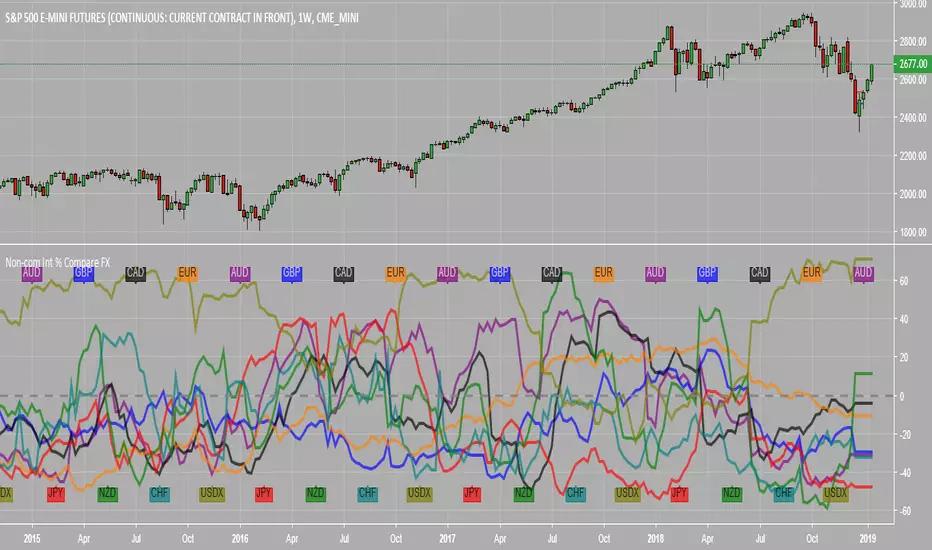
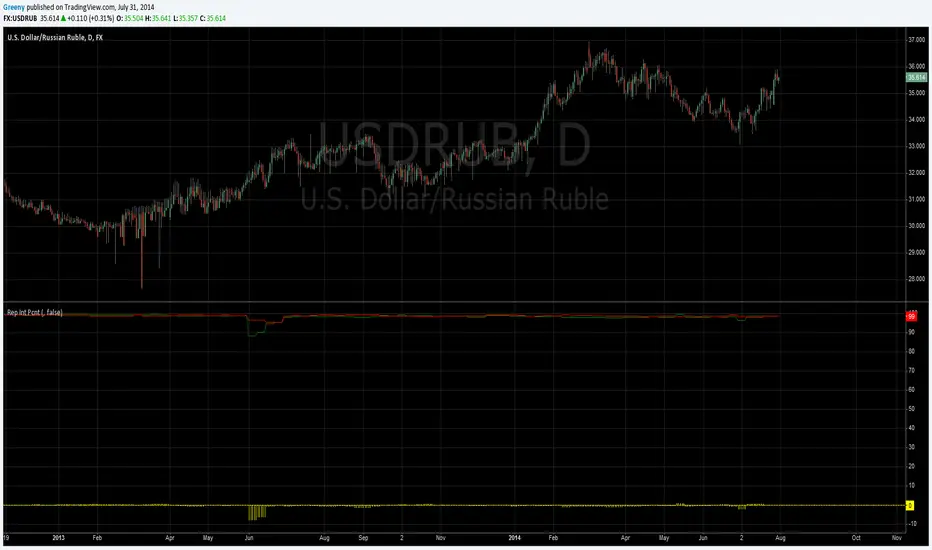
Non-commercial Interest Percent Comparison FXThis script compares IMM CFTC net positioning in percentage terms for several FX instruments.
Load it onto any weekly chart. The data displayed is independent of the chart instrument.
On the Inputs tab, uncheck "Show Legend" to hide the legend (useful if you want to change the plot colours or it is getting in the way).
On the Inputs tab, select "Total OI" to show the net positions expressed as a percentage of Total Open Interest; or "Non-com positions" to show them expressed as a percentage of Non-commercial Longs + Shorts. The default is "Total OI".
On the Style tab, change the plot colours, etc. as necessary. Note that the legend will not reflect the new colours.
This is my first script and I couldn't get some things working as I wanted (such as multi-line declared functions and if-then-else blocks), so sorry the code's a bit clunky. Please feel free to copy and modify it however you wish.
A non-FX version is also available.
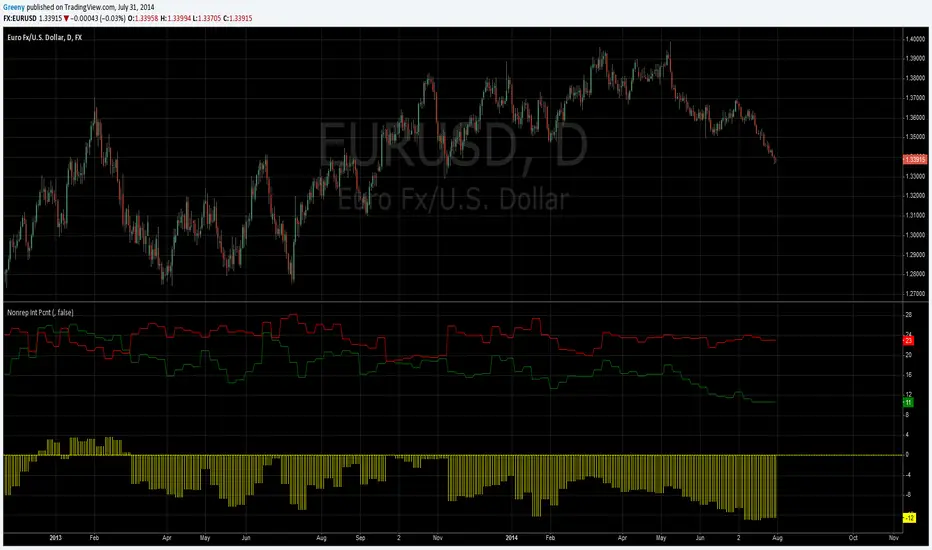
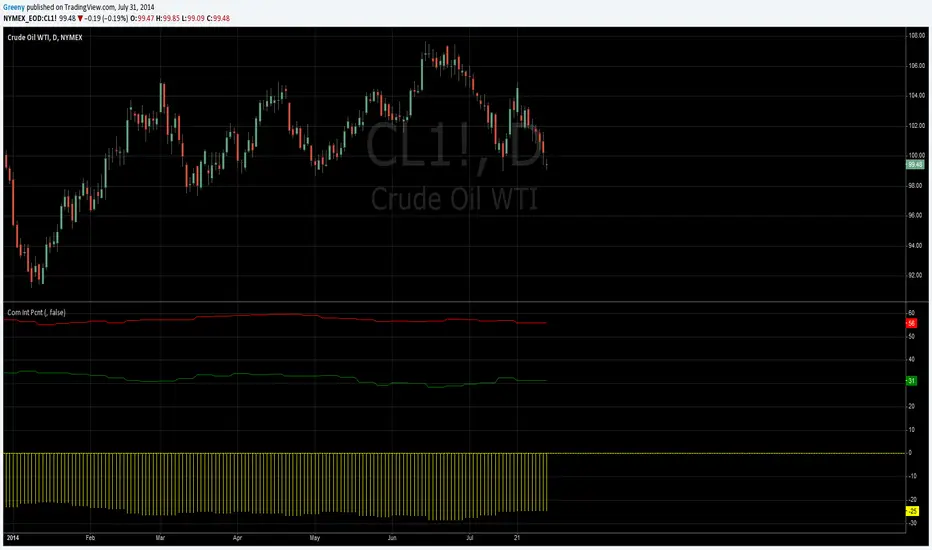
COT (Legacy): Non-Reportable Interest PercentPercent in Open Interest for non reportable traders from legacy commitment of traders (COT) report. For the main symbol but also allows to override it. Also allows to include options in consideration.
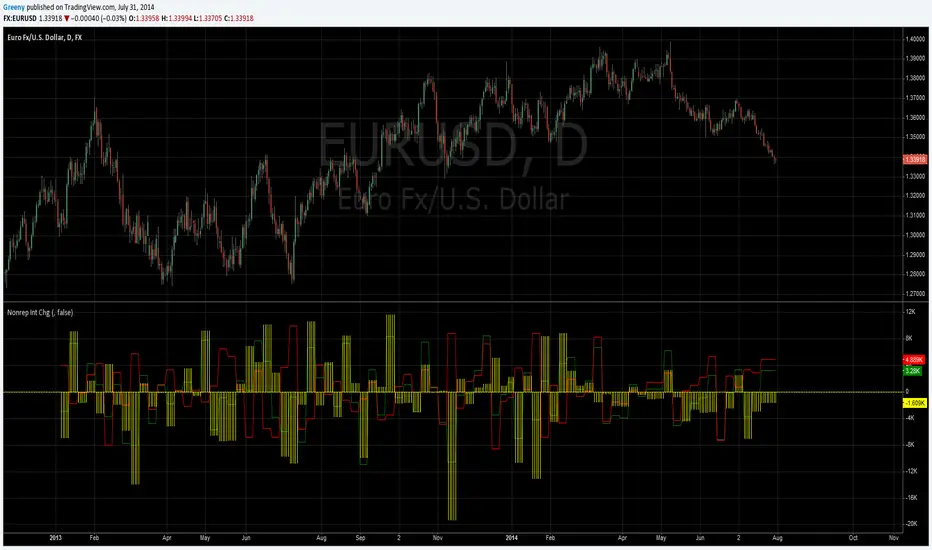
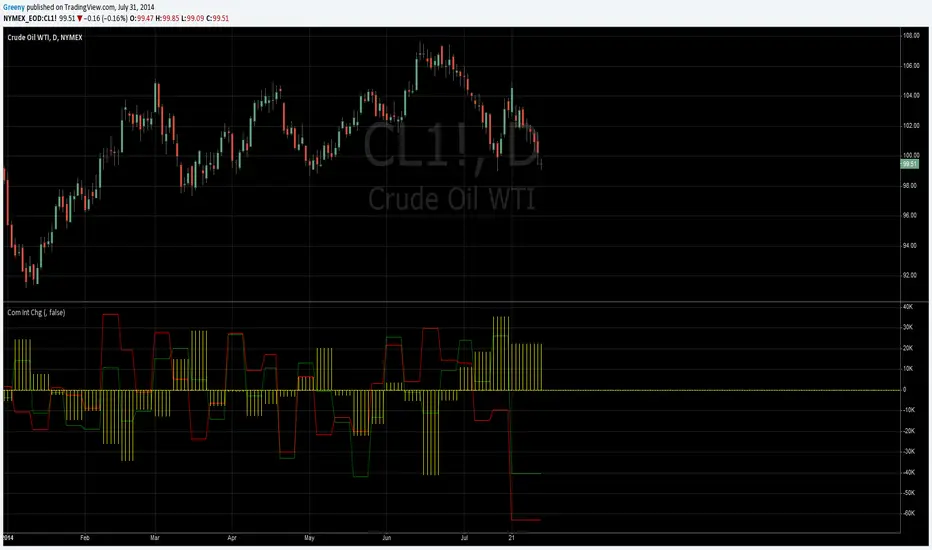
COT (Legacy): Non-Reportable Interest ChangeChange in Open Interest for non reportable traders from legacy commitment of traders (COT) report. For the main symbol but also allows to override it. Also allows to include options in consideration.
COT (Legacy): Reportable Interest PercentPercent of Open Interest for all reportable traders from legacy commitment of traders (COT) report. For the main symbol but also allows to override it. Also allows to include options in consideration.
COT (Legacy): Reportable Interest ChangeChange in Open Interest for all reportable traders from legacy commitment of traders (COT) report. For the main symbol but also allows to override it. Also allows to include options in consideration.
COT (Legacy): Noncommercial Interest PercentPercent of Open Interest for non commercial traders from legacy commitment of traders (COT) report. For the main symbol but also allows to override it. Also allows to include options in consideration.
COT (Legacy): Noncommercial Interest ChangeChange in Open Interest for non commercial traders from legacy commitment of traders (COT) report. For the main symbol but also allows to override it. Also allows to include options in consideration.
COT (Legacy): Commercial Interest PercentPercent of Open Interest for commercial traders from legacy commitment of traders (COT) report. For the main symbol but also allows to override it. Also allows to include options in consideration.
COT (Legacy): Commercial Interest ChangeChange in Open Interest for commercial traders from legacy commitment of traders (COT) report. For the main symbol but also allows to override it. Also allows to include options in consideration.
Sinal de Shorts e Longs (OI + OBV + RSI)This indicator combines Open Interest (OI), On-Balance Volume (OBV), and RSI to identify potential short and long pressures in the market.
When OI increases, OBV decreases, and RSI > 40, it signals short entries and possible bearish pressure.
When OI increases, OBV also increases, and RSI < 60, it signals long entries and potential bullish reversals.
Visual signals (S and L) are displayed directly on the chart for quick interpretation.
Useful for tracking futures market sentiment and spotting shifts in trader positioning.

Friday’s Close – Futures Weekend AnchorPurpose:
This indicator highlights the US futures weekend close price — the exact level where CME markets end trading on Friday at 4:00 PM CT / 5:00 PM ET.
It’s designed primarily for crypto traders who want to compare weekend market behavior to the traditional finance (TradFi) close.
Why it matters:
Crypto trades 24/7, but global liquidity and sentiment still pivot around the Friday futures close. During the weekend, crypto can “drift” relative to traditional markets — this line shows exactly where the week ended for Wall Street, giving you a clean reference point until futures reopen on Sunday evening.
Features
Precise Friday close capture (CME weekend close minute, not just daily bar)
Works on any ticker — especially useful for BTC, ETH, or other crypto assets
Adjustable for time zone (New York / Chicago / custom)
Option to select prior weeks with weekOffset
Draws a single clean line from Friday’s close forward — no clutter, no vertical stitches
Optional right-edge label with the close value and timestamp
Usage Tips
Keep the chart’s timezone in sync with your anchor (America/New_York = 5 PM ET, America/Chicago = 4 PM CT).
Use weekOffset = 1 to view last week’s Friday close.
Combine with volume, funding, or open interest indicators to see how weekend moves relate to the TradFi close.
Ideal for weekend analysis — shows whether crypto is trading rich or cheap vs. the Friday benchmark before futures reopen.
Recommended For
Crypto traders, analysts, and quant enthusiasts who monitor TradFi–crypto decoupling or weekend premium behavior.

BTC Flow Dashboard : Spot Premium + OI + Funding + Cycle SignalsSpot Premium vs Perpetual Basket (%):
Tracks how aggressively perps are trading relative to spot, a leading indicator of speculative activity and leverage buildup.
Aggregated Open Interest Z-Score:
A normalized view of OI expansion/contraction across major exchanges (Binance, BitMEX, Bybit, Kraken, etc.), highlighting when leverage enters overheated zones.
Composite Funding Rate Analysis:
Calculates a TWAP-smoothed funding composite across major venues, with optional APR scaling, showing where perpetual markets are paying for long or short exposure.
Confluence Signal Engine:
Dynamically flags bullish or bearish market conditions based on premium behavior and leverage environment — including over-leverage warnings that often precede volatility spikes.
Extreme Cycle Tops & Bottoms (Experimental):
Optional signal module that highlights historically significant extremes (e.g., 2020 bottom or 2021 top) based on statistical Z-score thresholds across the three core metrics.
Notes & Tips
Works best on weekly or monthly timeframes for macro cycle analysis.
Daily and 3D views provide short-term leverage context but may produce more frequent signals.
The Extreme Signal Engine is experimental — not a trading signal on its own, but a contextual tool to support macro decision-making.

BTC Flow Dashboard (Spot Premium + OI + Funding)It builds a single flows dashboard that shows whether real spot demand (fiat buyers) or leveraged perps (futures traders) are driving BTC, and then cross-checks that with Open Interest (OI) and funding pressure—all normalized so you can spot regime shifts and squeeze risk fast.
How to read it (practical playbook)
Continuation (healthier trend)
Price ↑, premium > 0 and rising, oiZ ≥ 0 → spot sponsoring the move; perps chase → add on pullbacks.
Leverage-led & vulnerable
Price ↑, premium < 0, fundZ > 0 (expensive longs) → crowding → fade extensions / expect sharp pullbacks.
Buyable dip / absorption
Price ↓, premium ≥ 0 (spot supporting), oiZ flat/down, fundZ ≤ 0 → selling looks weak → scale into reversals.
Exhaustion / mean reversion
premZ ≥ +2 after a run → flows unusually hot → take profits / tighten risk.
premZ ≤ −2 into key support → capitulation risk but also bounce setups if OI/funding aren’t pressuring.

Swing Points & Liquidity — ENHANCED PRO (Dark/Light Mode)This indicator — “Swing Points & Liquidity — ENHANCED PRO (Dark/Light Mode)” — automatically detects and visualizes swing highs, swing lows, and liquidity levels on the chart with rich analytics and customizable visuals.
🔍 Core Features
Smart Swing Detection: Identifies pivot highs/lows based on adjustable left/right bar settings.
Liquidity Visualization: Draws dynamic boxes and lines for liquidity pools and swing zones.
Volume & OI Integration: Filters and colors levels using volume and Open Interest Δ (change).
Strength Meter: Highlights strong liquidity levels with color gradients based on OI + volume intensity.
Automatic Trendlines: Connects swing points with selectable style and width.
Fibonacci Mapping: Automatically projects fib retracements (23.6%, 38.2%, 50%, 61.8%, 78.6%) from swing-to-swing for confluence zones.
Statistics Panel: Displays live metrics — total levels, active/filled count, success rate, and average strength.
Alerts System: Alerts for new swing formations and when price touches or breaks a level.
Multi-Timeframe Option: Analyze swing structures from higher timeframes on any chart.
Dual Theme Mode: Fully optimized for both Dark and Light interface preferences.
⚙️ Advanced Options
Adjustable lookback range
Hide or extend filled levels
Configurable volume and OI thresholds
Supports multiple OI data sources (Binance, BitMEX, Kraken)
Fully dynamic text, color, and label alignment settings
💡 Use Case
Perfect for Smart Money Concept (SMC) and ICT-style analysis, liquidity sweeps, and swing-based trading.
Traders can quickly visualize where liquidity sits, track how it gets filled, and monitor structure shifts in real time.

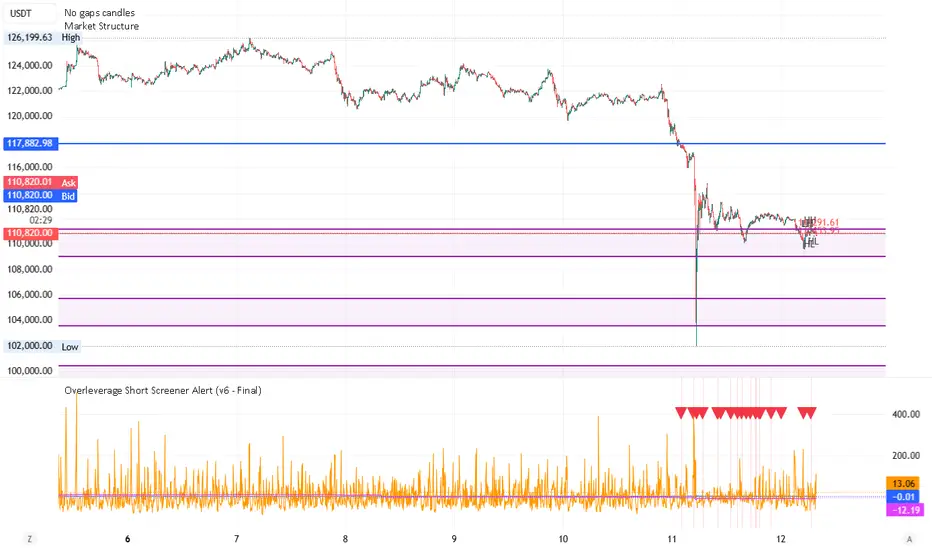
Overleverage Short Screener Alert Overleverage Short Screener Alert Guide (inspired by a posting "an on-chain trader nicknamed "Calm Order King" has reportedly made over $10 million in porfit this month - mainly by shorting BTC and SOL at precise reversal points", this script tries to guess his work.
🎯 Purpose of the Script
The script aims to identify potential **shorting opportunities** in derivatives markets (Perpetual Futures).
It looks for a setup often associated with a "long squeeze" or "blow-off top" by checking three criteria simultaneously: **High Excitement**, **Liquidity Buildup**, and the start of a **Price Dip**.
***
### 🛠️ Customize Inputs (Settings)
Access the indicator's settings window to adjust the following values:
Funding Rate Threshold (%):** Controls the required bar momentum (proxy for excitement). *Adjust between 0.01 and 0.05.*
OI MA Period:** Sets the lookback period for the Open Interest/Volume trend. *Use 7 to 14.*
OI Spike % Above MA:** Defines how far above its trend the Volume/OI must be to signal high liquidity buildup. *Try 20.0 to 50.0.*
Price Drop % From X-Period High:** Sets the minimum percentage drop required from the recent high to confirm the setup. *Use 3.0 to 7.0.*
High Timeframe:** The period used to calculate the "recent high." *Use '7D' (7 Days) or '1D' (1 Day).*
***
🔔 Reading the Signal and Setting Alerts
Visual Signal (Short\_Alert):** A **red triangle down** will appear at the top of the indicator pane when all three conditions are met. The background will also turn light red.
Signal Confirmation:**
* The **FR Proxy % (Blue Line)** must be **above** its blue threshold line.
* The **OI Spike % (Orange Line)** must be **above** its orange threshold line.
* The **Price Drop % (Fuchsia Line)** must be **below** its fuchsia threshold line.
Setting Alerts:**
1. Click the **"Alert"** button (bell icon) on the chart.
2. Set the **Condition** to the indicator's name: **"Overleverage Short Screener Alert
3. Set the specific condition to: **"Overleverage Short Alert"**.
4. The default alert message includes the current percentage values for all three factors for quick review.
Crypto Exchange PremiumDescription: Crypto Exchange Premium
The Crypto Exchange Premium indicator is designed to quantify and visualize price disparities between different types of crypto markets — specifically between spot and perpetual futures markets, or between any two customizable sources of price data. By consolidating live data from multiple major exchanges, it creates a unified, cross-market measure of premium (or discount), helping traders identify institutional activity (i. e. by comparing exchanges with high institutional activity against others), arbitrage opportunities, and shifts in market sentiment before they become visible in price action alone.
Concept and Purpose
In cryptocurrency markets, price divergence between spot and perpetual pairs reflects the real-time interaction of demand and liquidity across market segments.
When perpetual prices trade above spot, it implies aggressive long positioning or bullish leverage (positive funding expectations).
Conversely, when spot trades above perps, it may reflect net selling pressure in futures or strong spot accumulation.
Unlike most tools that rely on funding rates or open interest alone, this indicator measures the actual traded price spread dynamically across exchanges. This allows traders to visualize the “premium curve” of the crypto market in a clear, data-driven format.
How It Works
The indicator aggregates real-time prices from a wide selection of exchanges, normalizes them into groups, and computes the difference (“premium”) between two chosen reference markets.
1. Exchange Aggregation:
Users can toggle individual exchanges for both spot and perpetual aggregation groups.
The script automatically calculates group averages by dividing the sum of all enabled exchange prices by the number of valid feeds.
Non-USD exchanges (e.g., KRW pairs on Upbit or Bithumb) are automatically converted into USD using live FX data (USDKRW) for accurate normalization.
2. Flexible Comparison Logic:
Each leg of the comparison (First vs. Second Source) can be chosen as one of:
Local chart symbol
Custom symbol
Aggregated Spot group
Aggregated Perpetual group
This allows users to compare, for example:
Binance Spot vs. Global Perp Average
Coinbase Spot vs. Binance Perp
BTCUSD vs. BTCUSDT.P (or any cross-exchange combination)
3. Premium Calculation:
The final value is computed as:
Premium = First Source Price − Second Source Price
and is plotted as a histogram (positive = green, negative = red). This visual instantly shows whether the first source trades at a premium or discount relative to the second.
How to Use
Select Data Sources:
Configure the “First Symbol” and “Second Symbol” in the settings. For most use cases:
First Symbol → Perps (Aggregated)
Second Symbol → Spot (Aggregated)
Adjust Exchange Selection:
Enable or disable individual exchanges to fine-tune your data set. For instance, disabling Korean exchanges filters out regional FX distortions.
Originality and Value
While many exchange difference or “premium indicators” track one or two exchanges, this script introduces multi-exchange aggregation, cross-market normalization, and user-configurable pairing, resulting in a more holistic and accurate reflection of market structure.
It bridges a gap between macro market breadth and microstructural price dynamics, empowering traders to:
Detect arbitrage inefficiencies between spot and perps.
Track regional price dislocations (USD vs. KRW).
Gauge the intensity of speculative leverage over time.
Anticipate funding rate shifts and liquidation clusters before they happen.

eksOr - Charm + Vanna Window (Monthly OPEX)What This Does
This indicator highlights the monthly “Charm + Vanna window” around standard monthly options expiration (the 3rd Friday, i.e., monthly OPEX). It’s a time-based overlay that shades either:
Pre-OPEX: from the first calendar day of the month through the day before OPEX, or
Post-OPEX: from OPEX (3rd Friday) through month-end.
Use it to quickly see periods when index/stock flows are often influenced by charm (delta change from time decay) and vanna (delta change from IV moves), which can impact intramonth behavior.
How It Works
Automatically computes the third Friday each month (monthly OPEX) in your chosen timezone.
Lets you nudge the default window with Start/End calendar-day offsets (±10) to match your playbook.
Optionally draws vertical dotted lines and S/E labels on the bars where the window starts/ends.
Shows a compact table (top-right) with the current mode and the Start/End dates of the active month.
Triggers alerts on the exact bars where the window STARTS and ENDS.
Inputs
Window Mode: Pre-OPEX (start → OPEX-1) or Post-OPEX (OPEX → month end)
Timezone: Select from common exchanges/regions
Start/End Offsets: Shift boundaries by calendar days (e.g., start +2, end −1)
Style: Toggle shading, transparency, color, and start/end lines/labels
Why it’s useful
Many traders track the pre-OPEX build-up and post-OPEX reset for potential flow-driven behavior.
This tool doesn’t predict direction; it frames time so you can align other signals (price, breadth, vol, dealer positioning, etc.) within a consistent monthly structure.
Notes & limitations
This is not a signal or guarantee of charm/vanna effects—just a calendar window commonly associated with them.
OPEX logic uses the standard 3rd Friday (monthly equity/index options). It does not account for special exchange holidays or instrument-specific settlement quirks.
For best results, combine with your own vol/positioning dashboards (IV, skew, gamma exposure, open interest changes, etc.).
Tips
Use Pre-OPEX mode to visualize potential decay/roll dynamics into OPEX.
Use Post-OPEX mode to frame potential position resets into month-end.
Adjust offsets to match how your market/instrument tends to behave (e.g., start earlier if flows show up sooner).

BTC Spread: Coinbase Spot vs CME Futures (skullcap)BTC Spread: Coinbase Spot vs CME Futures
This indicator plots the real-time spread between Coinbase Spot BTC (COINBASE:BTCUSD) and CME Bitcoin Futures (CME:BTC1!).
It allows traders to monitor the premium or discount between spot and futures markets directly in one chart.
⸻
📊 How it Works
• The script pulls Coinbase spot BTC closing prices and CME front-month BTC futures prices on your selected timeframe.
• The spread is calculated as:
Spread = CME Price – Coinbase Spot Price
🔧 How to Use
1. Add the indicator to your chart (set to any timeframe you prefer).
2. The orange line represents the spread (USD difference).
3. The grey dashed line marks the zero level (parity between CME and Coinbase).
4. Use it to:
• Compare futures vs. spot market structure
• Track premium/discount cycles around funding or expiry
• Identify arbitrage opportunities or market dislocations
⸻
⚠️ Notes
• This indicator is informational only and does not provide trading signals.
• Useful for traders analysing derivatives vs spot price action.
• Works best when paired with order flow, funding rate, and open interest data.

Gamma & Max Pain HelperGamma & Max Pain Helper
Plots Call Wall, Put Wall, and Max Pain levels directly on your chart so you can see where options positioning might influence price.
Features:
Manually enter Call Wall, Put Wall, and Max Pain strike prices.
Lines auto-update each bar — no redrawing needed.
Labels display name + strike price.
Option to only show lines near current price (within a % you choose).
Color-coded:
Red = Call Wall (potential resistance)
Green = Put Wall (potential support)
Blue = Max Pain (price magnet into expiry)
Adjustable line width & extension.
Use Case:
Perfect for traders combining options open interest/gamma analysis with price action, pivots, VWAP, and other intraday levels. Quickly spot overlaps between option walls and technical barriers for high-probability reaction zones.

Cycle Composite 3.6 WeightedThe Cycle Composite is a multi-factor market cycle model designed to classify long-term market behavior into distinct phases using normalized and weighted data inputs.
It combines ten key on-chain, dominance, volatility, sentiment, and trend-following metrics into a single composite output. The goal is to provide a clearer understanding of where the market may stand in the broader cycle (e.g., accumulation, early bull, late bull, or euphoria).
This version (3.4) introduces flexible weighting, trend strength markers, and additional context-aware signals such as risk-on confirmations and altseason flags.
Phases Identified:
The model categorizes the market into one of five zones:
Euphoria (> 85)
Late Bull (70 – 85)
Mid Bull (50 – 70)
Early Bull (30 – 50)
Fear (< 30)
Each phase is determined by a smoothed EMA of the weighted composite score.
Data Sources and Metrics Used (10 total):
BTC Dominance (CRYPTOCAP:BTC.D)
Stablecoin Dominance (USDT + USDC average) (inverted for risk-on)
ETH Dominance (CRYPTOCAP:ETH.D)
BBWP (normalized Bollinger Band Width % over 1-year window)
WVF (Williams VIX Fix for volatility spike detection)
NUPL (Net Unrealized Profit/Loss, external source)
CMF (Chaikin Money Flow, smoothed volume accumulation)
CEX Open Interest (custom input from DAO / external source)
Whale Inflows (custom input from whale exchange transfer data)
Google Trends Average (BTC, Crypto, Altcoin terms)
All inputs are normalized over a 200-bar window and combined via weighted averaging, where each weight is user-configurable.
Additional Features:
Phase Labels: Labels are printed only when a new phase is entered.
Bull Continuation Marker: Triangle up when composite makes higher highs and NUPL increases.
Weakening Marker: Triangle down when composite rolls over in Late Bull and NUPL falls.
Risk-On Signal: Green circle appears when CMF and Google Trends are both rising.
Altseason Flag: Orange diamond appears when dominance of "others.d" exceeds BTC.D and ETH.D and composite is above 50.
Background Shading: Each phase is shaded with a semi-transparent background color.
Timeframe-Aware Display: All markers and signals are shown only on weekly timeframe for clarity.
Intended Use:
This script is intended for educational and macro-trend analysis purposes.
It can be used to:
Identify macro cycle position (accumulation, bull phases, euphoria, etc.)
Spot long-term trend continuation or weakening signals
Add context to price action with external on-chain and sentiment data
Time rotation events such as altseason risk
Disclaimer:
This script does not constitute financial advice.
It is intended for informational and research purposes only.
Users should conduct their own due diligence and analysis before making investment decisions.

Options Betting Range - FixedOptions Betting Range
Options Betting Range is a powerful TradingView indicator designed to streamline options trading by visualizing high-probability price ranges for key symbols. With automated trendlines and clear labels, it empowers traders to make precise, data-driven decisions based on customizable prediction and execution dates.
## Key Features
Broad S&P 500 Coverage: Supports most S&P 500 stock symbols, excluding those with insufficient options volume for reliable data, alongside major ETFs and indices like SPY, IWM, QQQ, DIA, TLT, ^GSPC, ^IXIC, ^RUT, ^NDX, and ^SOX.
Automated Trendlines: Plots dashed and solid trendlines to mark high/low price boundaries, triggered only on specified prediction dates for clean, uncluttered charts.
Customizable Inputs: Configure prediction and execution dates to align with your trading strategy.
Clear Visuals: Color-coded labels (green for highs, purple for lows) display price ranges and percentage spreads for rapid decision-making.
Single-Execution Logic: Draws trendlines once per prediction date, ensuring chart clarity and efficiency.
## How It Works
Based on the latest daily open interest data, the indicator calculates swing ranges for different strike dates, drawing trendlines and labels to visualize potential price boundaries for options trading.
## Why Use It?
Streamlined Analysis: Automates range visualization, saving time and reducing manual charting.
Strategic Clarity: Objective price levels minimize emotional bias and enhance trade planning.
Versatile Application: Ideal for day traders, swing traders, and options strategists across multiple markets.
## Tips for Best Use
Regular Updates: To maintain the accuracy of options betting ranges, periodically update the indicator. On the view page, hover over the indicator name and click the blue whirlwind icon to complete the update.
## Get Started
Add Options Betting Range to your TradingView chart, select a supported symbol, and customize your prediction/execution dates. Leverage the visualized price ranges to execute precise options trading strategies with confidence.
