Lorentzian Harmonic Flow - Temporal Market Dynamic Lorentzian Harmonic Flow - Temporal Market Dynamic (⚡LHF)
By: DskyzInvestments
What this is
LHF Pro is a research‑grade analytical instrument that models market time as a compressible medium , extracts directional flow in curved time using heavy‑tailed kernels, and consults a history‑based memory bank for context before synthesizing a final, bounded probabilistic score . It is not a mashup; each subsystem is mathematically coupled to a single clock (time dilation via gamma) and a single lens (Lorentzian heavy‑tailed weighting). This script is dense in logic (and therefore heavy) because it prioritizes rigor, interpretability, and visual clarity.
Intended use
Education and research. This tool expresses state recognition and regime context—not guarantees. It does not place orders. It is fully functional as published and contains no placeholders. Nothing herein is financial advice.
Why this is original and useful
Curved time: Markets do not move at a constant pace. LHF Pro computes a Lorentz‑style gamma (γ) from relative speed so its analytical windows contract when the tape accelerates and relax when it slows.
Heavy‑tailed lens: Lorentzian kernels weight information with fat tails to respect rare but consequential extremes (unlike Gaussian decay).
Memory of regimes: A K‑nearest‑neighbors engine works in a multi‑feature space using Lorentz kernels per dimension and exponential age fade , returning a memory bias (directional expectation) and assurance (confidence mass).
One ecosystem: Squeeze, TCI, flow, acceleration, and memory live on the same clock and blend into a single final_score —visualized and documented on the dashboard.
Cognitive map: A 2D heat map projects memory resonance by age and flow regime, making “where the past is speaking” visible.
Shadow portfolio metaphor: Neighbor outcomes act like tiny hypothetical positions whose weighted average forms an educational pressure gauge (no execution, purely didactic).
Mathematical framework (full transparency)
1) Returns, volatility, and speed‑of‑market
Log return: rₜ = ln(closeₜ / closeₜ₋₁)
Realized vol: rv = stdev(r, vol_len); vol‑of‑vol: burst = |rv − rv |
Speed‑of‑market (analog to c): c = c_multiplier × (EMA(rv) + 0.5 × EMA(burst) + ε)
2) Trend velocity and Lorentz gamma (time dilation)
Trend velocity: v = |close − close | / (vel_len × ATR)
Relative speed: v_rel = v / c
Gamma: γ = 1 / √(1 − v_rel²), stabilized by caps (e.g., ≤10)
Interpretation: γ > 1 compresses market time → use shorter effective windows.
3) Adaptive temporal scale
Adaptive length: L = base_len / γ^power (bounded for safety)
Harmonic horizons: Lₛ = L × short_ratio, Lₘ = L × mid_ratio, Lₗ = L × long_ratio
4) Lorentzian smoothing and Harmonic Flow
Kernel weight per lag i: wᵢ = 1 / (1 + (d/γ)²), d = i/L
Horizon baselines: lw_h = Σ wᵢ·price / Σ wᵢ
Z‑deviation: z_h = (close − lw_h)/ATR
Harmonic Flow (HFL): HFL = (w_short·zₛ + w_mid·zₘ + w_long·zₗ) / (w_short + w_mid + w_long)
5) Flow kinematics
Velocity: HFL_vel = HFL − HFL
Acceleration (curvature): HFL_acc = HFL − 2·HFL + HFL
6) Squeeze and temporal compression
Bollinger width vs Keltner width using L
Squeeze: BB_width < KC_width × squeeze_mult
Temporal Compression Index: TCI = base_len / L; TCI > 1 ⇒ compressed time
7) Entropy (regime complexity)
Shannon‑inspired proxy on |log returns| with numerical safeguards and smoothing. Higher entropy → more chaotic regime.
8) Memory bank and Lorentzian k‑NN
Feature vector (5D):
Outcomes stored: forward returns at H5, H13, H34
Per‑dimension similarity: k(Δ) = 1 / (1 + Δ²), weighted by user’s feature weights
Age fading: weight_age = mem_fade^age_bars
Neighbor score: sᵢ = similarityᵢ × weight_ageᵢ
Memory bias: mem_bias = Σ sᵢ·outcomeᵢ / Σ sᵢ
Assurance: mem_assurance = Σ sᵢ (confidence mass)
Normalization: mem_bias normalized by ATR and clamped into band
Shadow portfolio metaphor: neighbors behave like micro‑positions; their weighted net forward return becomes a continuous, adaptive expectation.
9) Blended score and breakout proxy
Blend factor: α_mem = 0.45 + 0.15 × (γ − 1)
Final score: final_score = (1−α_mem)·tanh(HFL / (flow_thr·1.5)) + α_mem·tanh(mem_bias_norm)
Breakout probability (bounded): energy = cap(TCI−1) + |HFL_acc|×k + cap(γ−1)×k + cap(mem_assurance)×k; breakout_prob = sigmoid(energy). Caps avoid runaway “100%” readings.
Inputs — every control, purpose, mechanics, and tuning
🔮 Lorentz Core
Auto‑Adapt (Vol/Entropy): On = L responds to γ and entropy (breathes with regime), Off = static testing.
Base Length: Calm‑market anchor horizon. Lower (21–28) for fast tapes; higher (55–89+) for slow.
Velocity Window (vel_len): Bars used in v. Shorter = more reactive γ; longer = steadier.
Volatility Window (vol_len): Bars used for rv/burst (c). Shorter = more sensitive c.
Speed‑of‑Market Multiplier (c_multiplier): Raises/lowers c. Lower values → easier γ spikes (more adaptation). Aim for strong trends to peak around γ ≈ 2–4.
Gamma Compression Power: Exponent of γ in L. <1 softens; >1 amplifies adaptation swings.
Max Kernel Span: Upper bound on smoothing loop (quality vs CPU).
🎼 Harmonic Flow
Short/Mid/Long Horizon Ratios: Partition L into fast/medium/slow views. Smaller short_ratio → faster reaction; larger long_ratio → sturdier bias.
Weights (w_short/w_mid/w_long): Governs HFL blend. Higher w_short → nimble; higher w_long → stable.
📈 Signals
Squeeze Strictness: Threshold for BB1 = compressed (coiled spring); <1 = dilated.
v/c: Relative speed; near 1 denotes extreme pacing. Diagnostic only.
Entropy: Regime complexity; high entropy suggests caution, smaller size, or waiting for order to return.
HFL: Curved‑time directional flow; sign and magnitude are the instantaneous bias.
HFL_acc: Curvature; spikes often accompany regime ignition post‑squeeze.
Mem Bias: Directional expectation from historical analogs (ATR‑normalized, bounded). Aligns or conflicts with HFL.
Assurance: Confidence mass from neighbors; higher → more reliable memory bias.
Squeeze: ON/RELEASE/OFF from BB
Cari dalam skrip untuk "order"

FirstStrike Long 200 - Daily Trend Rider [KedArc Quant]Strategy Description
FirstStrike Long 200 is a disciplined, long-only momentum strategy designed for daily "strike-first" entries in trending markets. It scans for RSI momentum above a customizable trigger (default 50), confirmed by EMA trend filters, and limits you to *exactly one trade per day* to avoid overtrading. It uses ATR for dynamic risk management (1.5x stop, 2:1 RR target) and optional trailing stops to ride winners. Backtested with realistic commissions and sizing, it prioritizes low drawdowns (<1% max in tests) over aggressive gains—ideal for swing traders seeking quality setups in bull runs.
Why It's Different from Other Strategies
Unlike generic RSI crossover bots or EMA ribbon mashups that spam signals and bleed in chop, FirstStrike enforces a "one-and-done" daily gate, blending precision momentum (RSI modes with grace/sustain) with robust filters (volume, sessions, rearm dips).
How It Helps Traders
- Reduces Emotional Trading: One entry/day forces discipline—miss a setup? Wait for tomorrow. Perfect for busy pros avoiding screen fatigue.
- Adapts to Regimes: Switch modes for trends ("Cross+Grace") vs. ranges ("Any bar")—boosts win rates 5-10% in backtests on high-beta names like .
- Risk-First Design: ATR scales stops to vol capping DD at 0.2% while targeting 2R winners. Trailing option locks +3-5% runs without early exits.
- Quick Insights: Labels/alerts flag entries with RSI values; bgcolor highlights signals for visual scanning. Helps spot "first-strike" edges in uptrends, filtering ~60% noise.
Why This Is Not a Mashup
This isn't a Frankenstein of off-the-shelf indicators—while it uses standard RSI/EMA/ATR (core Pine primitives), the innovation lies in:
- Custom Trigger Engine: Switchable modes (e.g., "Cross+Grace+Sustain" requires post-cross hold) prevent perpetual signals, unlike basic `ta.crossover()`.
- Daily Rearm Gate: Resets eligibility only after a dip (if enabled), tying momentum to mean-reversion—original logic not found in common scripts.
- Per-Day Isolation: `var` vars + `ta.change(time("D"))` ensure zero pyramiding/overlaps, beyond simple session filters.
All formulae are derived in-house for "first-strike" (early RSI pops in trends), not copied from public repos.
Input Configurations
Let's break down every input in the FirstStrike Long 200 strategy. These settings let you tweak the strategy like a dashboard—start with defaults for quick testing,
then adjust based on your asset or timeframe (5m for intraday). They're grouped logically to keep things organized, and most have tooltips in the script for quick reminders.
RSI / Trigger Group: The Heart of Momentum Detection
This is where the magic starts—the strategy hunts for "upward energy" using RSI (Relative Strength Index), a tool that measures if a stock is overbought (too hot) or oversold (too cold) on a 0-100 scale.
- RSI Length: How many bars (candles) back to calculate RSI. Default is 14, like a 14-day window for daily charts. Shorter (e.g., 9) makes it snappier for fast markets; longer (21) smooths out noise but misses quick turns.
- Trigger Level (RSI >= this): The key RSI value where the strategy says, "Go time!" Default 50 means enter when RSI crosses or holds above the neutral midline. Why is this trigger required? It acts as your "green light" filter—without it, you'd enter on every tiny price wiggle, leading to endless losers. RSI above this shows building buyer power, avoiding weak or sideways moves. It's essential for quality over quantity, especially in one-trade-per-day setups.
- Trigger Mode: Picks how strict the RSI signal must be. Options: "Cross only" (exact RSI crossover above trigger—super precise, fewer trades); "Cross+Grace" (crossover or within a grace window after—gives a second chance); "Cross+Grace+Sustain" (crossover/grace plus RSI holding steady for bars—best for steady climbs); "Any bar >= trigger" (looser, any bar above—more opportunities but riskier in chop). Start with "Any bar" for trends, switch to "Cross only" for caution.
- Grace Window (bars after cross): If mode allows, how many bars post-RSI-cross you can still enter if RSI dips but recovers. Default 30 (about 2.5 hours on 5m). Zero means no wiggle room—pure precision.
- Sustain Bars (RSI >= trigger): In sustain mode, how many straight bars RSI must stay above trigger. Default 3 ensures it's not a fluke spike.
- Require RSI Dip Below Rearm Before Any Entry?: A yes/no toggle. If on, the strategy "rearms" only after RSI dips below a low level (like a breather), preventing back-to-back signals in overextended rallies.
- Rearm Level (if requireDip=true): The dip threshold for rearming. Default 45—RSI must go below this to reset eligibility. Lower (30) for deeper pullbacks in volatile stocks.
For the trigger level itself, presets matter a lot—default 50 is neutral and versatile for broad trends. Bump to 55-60 for "strong momentum only" (fewer but higher-win trades, great in bull runs like tech surges); drop to 40-45 for "early bird" catches in recoveries (more signals but watch for fakes in ranges). The optimize hint (40-60) lets you test these in TradingView to match your risk—higher presets cut noise by 20-30% in backtests.
Trend / Filters Group: Keeping You on the Right Side of the Market
These EMAs (Exponential Moving Averages) act like guardrails, ensuring you only long in uptrends.
- EMA (Fast) Confirmation: Short-term EMA for price action. Default 20 periods—price must be above this for "recent strength." Shorter (10) reacts faster to intraday pops.
- EMA (Trend Filter): Long-term EMA for big-picture trend. Default 200 (classic "above the 200-day" rule)—price above it confirms bull market. Minimum 50 to avoid over-smoothing.
Optional Hour Window Group: Timing Your Strikes
Avoid bad hours like lunch lulls or after-hours tricks.
- Restrict by Session?: Yes/no for using exact market hours. Default off.
- Session (e.g., 0930-1600 for NYSE): Time string like "0930-1600" for open to close. Auto-skips pre/post-market noise.
- Restrict by Hour Range?: Fallback yes/no for simple hours. Default off.
- Start Hour / End Hour: Clock times (0-23). Defaults 9-15 ET—focus on peak volume.
Volume Filter Group: No Volume, No Party
Confirms conviction—big moves need big participation.
- Require Volume > SMA?: Yes/no toggle. Default off—only fires on above-average volume.
- Volume SMA Length: Periods for the average. Default 20—compares current bar to recent norm.
Risk / Exits Group: Protecting and Profiting Smartly
Dynamic stops based on volatility (ATR = Average True Range) keep things realistic.
- ATR Length: Bars for ATR calc. Default 14—measures recent "wiggle room" in price.
- ATR Stop Multiplier: How far below entry for stop-loss. Default 1.5x ATR—gives breathing space without huge risk
- Take-Profit R Multiple: Reward target as multiple of risk. Default 2.0 (2:1 ratio)—aims for twice your stop distance.
- Use Trailing Stop?: Yes/no for profit-locking trail. Default off—activates after entry.
- Trailing ATR Multiplier: Trail distance. Default 2.0x ATR—looser than initial stop to let winners run.
These inputs make the strategy plug-and-play: Defaults work out-of-box for trending stocks, but tweak RSI trigger/modes first for your style.
Always backtest changes—small shifts can flip a 40% win rate to 50%+!
Outputs (Visuals & Alerts):
- Plots: Blue EMA200 (trend line), Orange EMA20 (price filter), Green dashed entry price.
- Labels: Green "LONG" arrow with RSI value on entries.
- Background: Light green highlight on signal bars.
- Alerts: "FirstStrike Long Entry" fires on conditions (integrates with TradingView notifications).
Entry-Exit Logic
Entry (Long Only, One Per Day):
1. Daily Reset: New day clears trade gate and (if required) rearm status.
2. Filters Pass: Time/session OK + Close > EMA200 (trend) + Close > EMA20 (price) + Volume > SMA (if enabled) + Rearmed (dip below rearm if toggled).
3. Trigger Fires: RSI >= trigger via selected mode (e.g., crossover + grace window).
4. Execute: Enter long at close; set daily flag to block repeats.
Exit:
- Stop-Loss: Entry - (ATR * 1.5) – dynamic, vol-scaled.
- Take-Profit: Entry + (Risk * 2.0) – fixed RR.
- Trailing (Optional): Activates post-entry; trails at Close - (ATR * 2.0), updating on each bar for trend extension.
No shorts or hedging—pure long bias.
Formulae Used
- RSI: `ta.rsi(close, rsiLen)` – Standard 14-period momentum oscillator (0-100).
- EMAs: `ta.ema(close, len)` – Exponential moving averages for trend/price filters.
- ATR: `ta.atr(atrLen)` – True range average for stop sizing: Stop = Entry - (ATR * mult).
- Volume SMA: `ta.sma(volume, volLen)` – Simple average for relative strength filter.
- Grace Window: `bar_index - lastCrossBarIndex <= graceBars` – Counts bars since RSI crossover.
- Sustain: `ta.barssince(rsi < trigger) >= sustainBars` – Consecutive bars above threshold.
- Session Check: `time(timeframe.period, sessionStr) != 0` – TradingView's built-in session validator.
- Risk Distance: `riskPS = entry - stop; TP = entry + (riskPS * RR)` – Asymmetric reward calc.
FAQ
Q: Why only one trade/day?
A: Prevents revenge trading in volatile sessions . Backtests show it cuts losers by 20-30% vs. multi-entry bots.
Q: Does it work on all assets/timeframes?
A: Best for trending stocks/indices on 5m-1H. Test on crypto/forex with wider ATR mult (2.0+).
Q: How to optimize?
A: Use TradingView's optimizer on RSI trigger (40-60) and EMA fast (10-30). Aim for PF >1.0 over 1Y data.
Q: Alerts don't fire—why?
A: Ensure `alertcondition` is enabled in script settings. Test with "Any alert() function calls only."
Q: Trailing stop too loose?
A: Tune `trailMult` to 1.5 for tighter; it activates alongside fixed TP/SL for hybrid protection.
Glossary
- Grace Window: Post-RSI-cross period (bars) where entry still allowed if RSI holds trigger.
- Rearm Dip: Optional pullback below a low RSI level (e.g., 45) to "reset" eligibility after signals.
- Profit Factor (PF): Gross profit / gross loss—>1.0 means winners outweigh losers.
- R Multiple: Risk units (e.g., 2R = 2x stop distance as target).
- Sustain Bars: Consecutive bars RSI stays >= trigger for mode confirmation.
Recommendations
- Backtest First: Run on your symbols (/) over 6-12M; tweak RSI to 55 for +5% win rate.
- Live Use: Start paper trading with `useSession=true` and `useVol=true` to filter noise.
- Pairs Well With: Higher TF (daily) for bias; add ADX (>25) filter for strong trends (code snippet in prior chats).
- Risk Note: 10% sizing suits $100k+ accounts; scale down for smaller. Not financial advice—past performance ≠ future.
- Publish Tip: Add tags like "momentum," "RSI," "long-only" on TradingView for visibility.
Strategy Properties & Backtesting Setup
FirstStrike Long 200 is configured with conservative, realistic backtesting parameters to ensure reliable performance simulations. These settings prioritize capital preservation and transparency, making it suitable for both novice and experienced traders testing on stocks.
Initial Capital
$100,000 Standard starting equity for portfolio-level testing; scales well for retail accounts. Adjust lower (e.g., $10k) for smaller simulations.
Base Currency
Default (USD) Aligns with most US equities (e.g., NASDAQ symbols); auto-converts for other assets.
Order Size
1 (Quantity) Fixed share contracts for simplicity—e.g., buys 1 share per trade. For % of equity, switch to "Percent of Equity" in strategy code.
Pyramiding
0 Orders No additional entries on open positions; enforces strict one-trade-per-day discipline to avoid overexposure.
Commission
0.1% Realistic broker fee (e.g., Interactive Brokers tier); factors in round-trip costs without over-penalizing winners.
Verify Price for Limit Orders
0 Ticks No slippage delay on TPs—assumes ideal fills for historical accuracy.
Slippage
0 Ticks Zero assumed slippage for clean backtests; real-world trading may add 1-2 ticks on volatile opens.
These defaults yield low drawdowns (<0.3% max in tests) while capturing trend edges. For live trading, enable slippage (1-3 ticks) to mimic execution gaps. Always forward-test before deploying!
⚠️ Disclaimer
This script is provided for educational purposes only.
Past performance does not guarantee future results.
Trading involves risk, and users should exercise caution and use proper risk management when applying this strategy.

BOCS AdaptiveBOCS Adaptive Strategy - Automated Volatility Breakout System
WHAT THIS STRATEGY DOES:
This is an automated trading strategy that detects consolidation patterns through volatility analysis and executes trades when price breaks out of these channels. Take-profit and stop-loss levels are calculated dynamically using Average True Range (ATR) to adapt to current market volatility. The strategy closes positions partially at the first profit target and exits the remainder at the second target or stop loss.
TECHNICAL METHODOLOGY:
Price Normalization Process:
The strategy begins by normalizing price to create a consistent measurement scale. It calculates the highest high and lowest low over a user-defined lookback period (default 100 bars). The current close price is then normalized using the formula: (close - lowest_low) / (highest_high - lowest_low). This produces values between 0 and 1, allowing volatility analysis to work consistently across different instruments and price levels.
Volatility Detection:
A 14-period standard deviation is applied to the normalized price series. Standard deviation measures how much prices deviate from their average - higher values indicate volatility expansion, lower values indicate consolidation. The strategy uses ta.highestbars() and ta.lowestbars() functions to track when volatility reaches peaks and troughs over the detection length period (default 14 bars).
Channel Formation Logic:
When volatility crosses from a high level to a low level, this signals the beginning of a consolidation phase. The strategy records this moment using ta.crossover(upper, lower) and begins tracking the highest and lowest prices during the consolidation. These become the channel boundaries. The duration between the crossover and current bar must exceed 10 bars minimum to avoid false channels from brief volatility spikes. Channels are drawn using box objects with the recorded high/low boundaries.
Breakout Signal Generation:
Two detection modes are available:
Strong Closes Mode (default): Breakout occurs when the candle body midpoint math.avg(close, open) exceeds the channel boundary. This filters out wick-only breaks.
Any Touch Mode: Breakout occurs when the close price exceeds the boundary.
When price closes above the upper channel boundary, a bullish breakout signal generates. When price closes below the lower boundary, a bearish breakout signal generates. The channel is then removed from the chart.
ATR-Based Risk Management:
The strategy uses request.security() to fetch ATR values from a specified timeframe, which can differ from the chart timeframe. For example, on a 5-minute chart, you can use 1-minute ATR for more responsive calculations. The ATR is calculated using ta.atr(length) with a user-defined period (default 14).
Exit levels are calculated at the moment of breakout:
Long Entry Price = Upper channel boundary
Long TP1 = Entry + (ATR × TP1 Multiplier)
Long TP2 = Entry + (ATR × TP2 Multiplier)
Long SL = Entry - (ATR × SL Multiplier)
For short trades, the calculation inverts:
Short Entry Price = Lower channel boundary
Short TP1 = Entry - (ATR × TP1 Multiplier)
Short TP2 = Entry - (ATR × TP2 Multiplier)
Short SL = Entry + (ATR × SL Multiplier)
Trade Execution Logic:
When a breakout occurs, the strategy checks if trading hours filter is satisfied (if enabled) and if position size equals zero (no existing position). If volume confirmation is enabled, it also verifies that current volume exceeds 1.2 times the 20-period simple moving average.
If all conditions are met:
strategy.entry() opens a position using the user-defined number of contracts
strategy.exit() immediately places a stop loss order
The code monitors price against TP1 and TP2 levels on each bar
When price reaches TP1, strategy.close() closes the specified number of contracts (e.g., if you enter with 3 contracts and set TP1 close to 1, it closes 1 contract). When price reaches TP2, it closes all remaining contracts. If stop loss is hit first, the entire position exits via the strategy.exit() order.
Volume Analysis System:
The strategy uses ta.requestUpAndDownVolume(timeframe) to fetch up volume, down volume, and volume delta from a specified timeframe. Three display modes are available:
Volume Mode: Shows total volume as bars scaled relative to the 20-period average
Comparison Mode: Shows up volume and down volume as separate bars above/below the channel midline
Delta Mode: Shows net volume delta (up volume - down volume) as bars, positive values above midline, negative below
The volume confirmation logic compares breakout bar volume to the 20-period SMA. If volume ÷ average > 1.2, the breakout is classified as "confirmed." When volume confirmation is enabled in settings, only confirmed breakouts generate trades.
INPUT PARAMETERS:
Strategy Settings:
Number of Contracts: Fixed quantity to trade per signal (1-1000)
Require Volume Confirmation: Toggle to only trade signals with volume >120% of average
TP1 Close Contracts: Exact number of contracts to close at first target (1-1000)
Use Trading Hours Filter: Toggle to restrict trading to specified session
Trading Hours: Session input in HHMM-HHMM format (e.g., "0930-1600")
Main Settings:
Normalization Length: Lookback bars for high/low calculation (1-500, default 100)
Box Detection Length: Period for volatility peak/trough detection (1-100, default 14)
Strong Closes Only: Toggle between body midpoint vs close price for breakout detection
Nested Channels: Allow multiple overlapping channels vs single channel at a time
ATR TP/SL Settings:
ATR Timeframe: Source timeframe for ATR calculation (1, 5, 15, 60, etc.)
ATR Length: Smoothing period for ATR (1-100, default 14)
Take Profit 1 Multiplier: Distance from entry as multiple of ATR (0.1-10.0, default 2.0)
Take Profit 2 Multiplier: Distance from entry as multiple of ATR (0.1-10.0, default 3.0)
Stop Loss Multiplier: Distance from entry as multiple of ATR (0.1-10.0, default 1.0)
Enable Take Profit 2: Toggle second profit target on/off
VISUAL INDICATORS:
Channel boxes with semi-transparent fill showing consolidation zones
Green/red colored zones at channel boundaries indicating breakout areas
Volume bars displayed within channels using selected mode
TP/SL lines with labels showing both price level and distance in points
Entry signals marked with up/down triangles at breakout price
Strategy status table showing position, contracts, P&L, ATR values, and volume confirmation status
HOW TO USE:
For 2-Minute Scalping:
Set ATR Timeframe to "1" (1-minute), ATR Length to 12, TP1 Multiplier to 2.0, TP2 Multiplier to 3.0, SL Multiplier to 1.5. Enable volume confirmation and strong closes only. Use trading hours filter to avoid low-volume periods.
For 5-15 Minute Day Trading:
Set ATR Timeframe to match chart or use 5-minute, ATR Length to 14, TP1 Multiplier to 2.0, TP2 Multiplier to 3.5, SL Multiplier to 1.2. Volume confirmation recommended but optional.
For Hourly+ Swing Trading:
Set ATR Timeframe to 15-30 minute, ATR Length to 14-21, TP1 Multiplier to 2.5, TP2 Multiplier to 4.0, SL Multiplier to 1.5. Volume confirmation optional, nested channels can be enabled for multiple setups.
BACKTEST CONSIDERATIONS:
Strategy performs best during trending or volatility expansion phases
Consolidation-heavy or choppy markets produce more false signals
Shorter timeframes require wider stop loss multipliers due to noise
Commission and slippage significantly impact performance on sub-5-minute charts
Volume confirmation generally improves win rate but reduces trade frequency
ATR multipliers should be optimized for specific instrument characteristics
COMPATIBLE MARKETS:
Works on any instrument with price and volume data including forex pairs, stock indices, individual stocks, cryptocurrency, commodities, and futures contracts. Requires TradingView data feed that includes volume for volume confirmation features to function.
KNOWN LIMITATIONS:
Stop losses execute via strategy.exit() and may not fill at exact levels during gaps or extreme volatility
request.security() on lower timeframes requires higher-tier TradingView subscription
False breakouts inherent to breakout strategies cannot be completely eliminated
Performance varies significantly based on market regime (trending vs ranging)
Partial closing logic requires sufficient position size relative to TP1 close contracts setting
RISK DISCLOSURE:
Trading involves substantial risk of loss. Past performance of this or any strategy does not guarantee future results. This strategy is provided for educational purposes and automated backtesting. Thoroughly test on historical data and paper trade before risking real capital. Market conditions change and strategies that worked historically may fail in the future. Use appropriate position sizing and never risk more than you can afford to lose. Consider consulting a licensed financial advisor before making trading decisions.
ACKNOWLEDGMENT & CREDITS:
This strategy is built upon the channel detection methodology created by AlgoAlpha in the "Smart Money Breakout Channels" indicator. Full credit and appreciation to AlgoAlpha for pioneering the normalized volatility approach to identifying consolidation patterns and sharing this innovative technique with the TradingView community. The enhancements added to the original concept include automated trade execution, multi-timeframe ATR-based risk management, partial position closing by contract count, volume confirmation filtering, and real-time position monitoring.

Continuous Accumulation Strategy [DCA] v9🇬🇧 English: Continuous Accumulation Strategy v9.4
This script is a full-featured strategy designed to backtest the "Buy the Dip" or "Dollar Cost Averaging" (DCA) philosophy. Its core feature is the Dynamic Peak Detection logic, which solves the "lock-in" problem of previous versions. Instead of getting stuck on an old high, the strategy constantly adapts to the market by referencing the most recent peak.
Key Features
* Dynamic Peak Detection: You define the "Peak Lookback Period." For example, on a Daily chart, setting it to `5` references the peak of the last business week.
* Stable Order Management: The strategy consistently uses a fixed cash amount (e.g., $100) for each entry, which prevents any runtime errors related to negative equity.
* Publishing-Ready: To meet TradingView's requirement for a backtest report, this strategy executes a symbolic, one-time "dummy trade" (one buy and one sell) at the very beginning of the test period. This first trade should be ignored when analyzing performance , as its only purpose is to enable publication.
How It Works
The main logic follows an adaptive cycle: Find Dynamic Peak -> Wait for a Drop -> Buy on Crossover -> Repeat.
1. Finds the Dynamic Peak: On every bar, it identifies the highest price within your defined lookback period.
2. Calculates the Drop: It constantly calculates the percentage drop from this moving peak.
3. Executes an Entry: The moment the price crosses below a target drop percentage, it executes a buy order.
4. Continuously Adapts: As the price moves, the dynamic peak is constantly updated, meaning the strategy never gets locked and is always ready for the next opportunity.
How to Use This Strategy
* Focus on the Strategy Tester: After adding it to the chart, analyze the Equity Curve, Net Profit, and Max Drawdown to see how this accumulation philosophy would have performed on your favorite asset.
* Optimize Parameters: Adjust the "Peak Lookback Period" and "Drop Percentages" to fit the volatility of the asset you are testing.
This is a tool for testing and analyzing a "buy and accumulate" philosophy. Its main logic does not generate sell signals.

Session Based Liquidity# Session Based Liquidity Indicator - Educational Open Source
## 📊 Overview
The Session Based Liquidity indicator is a comprehensive educational tool designed to help traders understand and visualize liquidity concepts across major trading sessions. This indicator identifies Buy-Side Liquidity (BSL) and Sell-Side Liquidity (SSL) levels created during Asia, London, and New York trading sessions, providing insights into institutional order flow and potential market reversal zones.
## 🎯 Key Features
### 📈 Multi-Session Tracking
- **Asia Session**: Tokyo/Sydney overlap (20:00-02:00 EST)
- **London Session**: European markets (03:00-07:30 EST)
- **New York Session**: US markets (09:30-16:00 EST)
- Individual session toggle controls for focused analysis
### 💧 Liquidity Level Detection
- **Buy-Side Liquidity (BSL)**: Identifies stop losses above swing highs where short positions get stopped out
- **Sell-Side Liquidity (SSL)**: Identifies stop losses below swing lows where long positions get stopped out
- Advanced filtering algorithm to identify only significant liquidity zones
- Configurable pivot strength for sensitivity adjustment
### 🎨 Visual Management System
- **Unclaimed Levels**: Active liquidity zones that haven't been hit (default: black lines)
- **Claimed Levels**: Swept liquidity zones showing historical interaction (default: red lines)
- Customizable line styles, colors, and widths for both states
- Dynamic label system showing session origin and level significance
- Real-time line extension and label positioning
### ⚙️ Advanced Configuration
- **Pivot Strength**: Adjust sensitivity (1-20) for liquidity detection
- **Max Levels Per Side**: Control number of tracked levels (1-10) per session
- **Label Offset**: Customize label positioning
- **Style Customization**: Full control over visual appearance
## 📚 Educational Value
### Core Concepts Explained
- **Liquidity Pools**: Areas where stop losses and pending orders cluster
- **Liquidity Sweeps**: When price moves through levels to trigger stops, then reverses
- **Session-Based Analysis**: How different market sessions create distinct liquidity characteristics
- **Institutional Order Flow**: Understanding how large players interact with retail liquidity
### Trading Applications
- Identify high-probability reversal zones after liquidity sweeps
- Understand where stop losses are likely clustered
- Avoid trading into obvious liquidity traps
- Use session context for timing entries and exits
- Recognize institutional accumulation and distribution patterns
### Code Learning Opportunities
- **Pine Script v6 Best Practices**: Modern syntax and efficient coding patterns
- **Object-Oriented Design**: Custom types and methods for clean code organization
- **Array Management**: Dynamic data structure handling for performance
- **Visual Programming**: Line, label, and styling management
- **Session Detection**: Time-based filtering and timezone handling
## 🔧 Technical Implementation
### Performance Optimized
- Efficient memory management with automatic cleanup
- Limited historical level tracking to maintain responsiveness
- Optimized array operations for smooth real-time updates
- Smart filtering to reduce noise and focus on significant levels
### Code Architecture
- **Modular Design**: Clean separation of concerns with dedicated methods
- **Type Safety**: Custom SessionLiquidity type for organized data management
- **Extensible Structure**: Easy to modify and enhance for specific needs
- **Educational Comments**: Comprehensive documentation throughout
## 💡 Usage Guide
### Basic Setup
1. Add indicator to chart
2. Configure session times for your timezone
3. Adjust pivot strength based on timeframe (higher for lower timeframes)
4. Enable/disable sessions based on your trading focus
### Interpretation
- **Unclaimed levels**: Watch for price interaction and potential reversals
- **Claimed levels**: Use as potential support/resistance after sweep
- **External levels**: Beyond session range, higher significance
- **Internal levels**: Within session range, may indicate ranging conditions
### Best Practices
- Use higher timeframes (15m+) for cleaner signals
- Combine with price action analysis for confirmation
- Consider session overlap periods for increased significance
- Monitor multiple sessions for comprehensive market view
## 🎓 Educational Goals
This open-source project aims to:
- Demystify liquidity concepts for retail traders
- Provide practical coding examples in Pine Script v6
- Encourage understanding of institutional trading behavior
- Foster community learning and collaboration
- Bridge the gap between theory and practical application
## 📄 License & Usage
Released under Mozilla Public License 2.0 - free for educational and commercial use with proper attribution.
## 🤝 Contributing
As an open-source educational tool, contributions are welcome! Whether it's bug fixes, feature enhancements, or educational improvements, your input helps the trading community learn and grow.
## ⚠️ Disclaimer
This indicator is for educational purposes only. All trading involves risk, and past performance does not guarantee future results. Always practice proper risk management and never risk more than you can afford to lose.
---
*By studying and using this indicator, traders can develop a deeper understanding of market microstructure and improve their ability to read institutional order flow patterns.*

Follow-up Buy / Sell Volume Pressure at Supply / Demand Zones█ Overview:
BE-Volume Footprint & Pressure Candles, is an indicator which is preliminarily designed to analyze the supply and demand patterns based on Rally Base Rally (RBR), Drop Base Drop (DBD), Drop Base Rally (DBR) & Rally Base Drop (RBD) concepts in conjunction to volume pressure. Understanding these concepts are crucial. Let's break down why the "Base" is you Best friend in this context.
Commonness in RBR, DBD, DBR, RBD patterns ?
There is an impulse price movement at first, be it rally (price moving up) or the Drop (price moving down), followed by a period of consolidation which is referred as "BASE" and later with another impulse move of price (Rally or Drop).
Why is the Base Important
1. Market Balance: Base represents a balance between buyers and sellers. This is where decisions are made.
2. Confirmation: It confirms the strength of previous impulse move which has happened.
Base & the Liquidity Play:
Supply & Demand Zone predict the presence of all large orders within the limits of the Base Zone. Price is expected to return to the zone to fill the unfilled orders placed by large players.
For the price to move in the intended direction Liquidity plays the major role. hence indicator aims to help traders in identifying those zones where liquidity exists and the volume pressure helps in confirming that liquidity is making its play.
Bottom pane in the below snapshots is a visual representation of Buyers volume pressure (Green Line & the Green filled area) making the price move upwards vs Sellers volume pressure (Red Line & the Red filled area) making the price move downwards.
Top pane in the below snapshots is a visual representation on the pattern identification (Blue marked zone & the Blue line referred as Liquidity level)
Bullish Pressure On Buy Liquidity:
Bearish Pressure On Sell Liquidity:
█ How It Works:
1. Indicator computes technical & mathematical operations such as ATR, delta of Highs & Lows of the candle and Candle ranges to identify the patterns and marks the liquidity lines accordingly.
2. Indicator then waits for price to return to the liquidity levels and checks if Directional volume pressure to flow-in while the prices hover near the Liquidity zones.
3. Once the Volume pressure is evident, loop in to the ride.
█ When It wont Work:
When there no sufficient Liquidity or sustained Opposite volume pressure, trades are expected to fail.
█ Limitations:
Works only on the scripts which has volume info. Relays on LTF candles to determine intra-bar volumes. Hence, Use on TF greater than 1 min and lesser than 15 min.
█ Indicator Features:
1. StrictEntries: employs' tighter rules (rather most significant setups) on the directional volume pressure applied for the price to move. If unchecked, liberal rules applied on the directional volume pressure leading to more setups being identified.
2. Setup Confirmation period: Indicates Waiting period to analyze the directional volume pressure. Early (lesser wait period) is Risky and Late (longer wait period) is too late for the
ride. Find the quant based on the accuracy of the setup provided in the bottom right table.
3. Algo Enabled with Place Holders:
Indicator is equipped with algo alerts, supported with necessary placeholders to trade any instrument like stock, options etc.
Accepted PlaceHolders (Case Sensitive!!)
1. {{ticker}}-->InstrumentName
2. {{datetime}}-->Date & Time Of Order Placement
3. {{close}}-->LTP Price of Script
4. {{TD}}-->Current Level:
Note: Negative Numbers for Short Setup
5. {{EN}} {{SL}} {{TGT}} {{T1}} {{T2}} --> Trade Levels
6. {{Qty}} {{Qty*x}} --> Qty -> Trade Qty mapped in Settings. Replace x with actual number of your choice for the multiplier
7. {{BS}}-->Based on the Direction of Trade Output shall be with B or S (B == Long Trade & S == Short Trade)
8. {{BUYSELL}}-->Based on the Direction of Trade Output shall be with BUY or SELL (BUY == Long Trade & SELL == Short Trade)
9. {{IBUYSELL}}-->Based on the Direction of Trade Output shall be with BUY or SELL (BUY == SHORT Trade & SELL == LONG Trade)
Dynamic Alerts:
10. { {100R0} }-->Dynamic Place Holder 100 Refers to Strike Difference and Zero refers to ATM
11. { {100R-1} }-->Dynamic Place Holder 100 Refers to Strike Difference and -1 refers to
ATM - 100 strike
12. { {50R2} }-->Dynamic Place Holder 50 Refers to Strike Difference and 2 refers to
ATM + (2 * 50 = 100) strike
13. { {"ddMMyy", 0} }-->Dynamically Picks today date in the specified format.
14. { {"ddMMyy", n} }-->replace n with actual number of your choice to Pick date post today date in the specified format.
15. { {"ddMMyy", "MON"} }-->dynamically pick Monday date (coming Monday, if today is not Monday)
Note. for the 2nd Param-->you can choose to specify either Number OR any letter from =>
16. {{CEPE}} {{ICEPE}} {{CP}} {{ICP}} -> Dynamic Option Side CE or C refers to Calls and PE or P refers to Puts. If "I" is used in PlaceHolder text, On long entries PUTs shall be used
Indicator is equipped with customizable Trade & Risk management settings like multiple Take profit levels, Trailing SL.

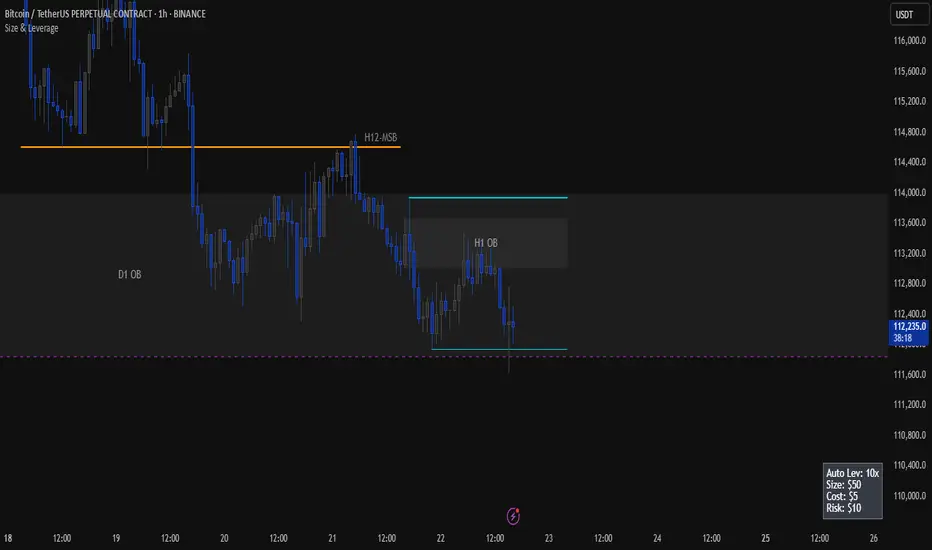
Size & LeverageSize and Leverage calculator for trading, using market orders. It will calculate maximum possible leverage by default in order to prioritize capital efficiency. If you wish to use manual leverage you need to manually enter it in the settings. The script rounds both auto leverage and size to your liking. Entry price is always last price. Size is the actual size you need to input, adjusted to your leverage, cost means the margin required to open the trade. I made this indicator as a binance futures user.
Volume Statistics - IntraweekVolume Statistics - Intraweek: For Orderflow Traders
This tool is designed for traders using volume footprint charts and orderflow methods.
Why it matters:
In orderflow trading, you care about the quality of volume behind each move. You’re not just watching price; you’re watching how much aggression is behind that price move. That’s where this indicator helps.
What to look at:
* Current Volume shows you how much volume is trading right now.
* Central Volume (median or average over 24h or 7D) gives you a baseline for what's normal volume VS abnormal volume.
* The Diff vs Central tells you immediately if current volume is above or below normal.
How this helps:
* If volume is above normal, it suggested elevated levels of buyer or seller aggression. Look for strong follow-through or continuation.
* If volume is below normal, it may signal low interest, passive participation, a lack of conviction, or a fake move.
* Use this context to decide if what you're seeing in the footprint (imbalances, absorption, traps) is actually worth acting on.
Extra context:
* The highest and lowest volume levels and their timestamps help you spot prior key reactions.
* Second and third highest bars help you see other major effort points in the recent window.
Comment with any suggestions on how to improve this indicator.

Volumetric Expansion/Contraction### Indicator Title: Volumetric Expansion/Contraction
### Summary
The Volumetric Expansion/Contraction (PCC) indicator is a comprehensive momentum oscillator designed to identify high-conviction price moves. Unlike traditional oscillators that only look at price, the PCC integrates four critical dimensions of market activity: **Price Change**, **Relative Volume (RVOL)**, **Cumulative Volume Delta (CVD)**, and **Average True Range (ATR)**.
Its primary purpose is to help traders distinguish between meaningful, volume-backed market expansions and noisy, unsustainable price action. It gives more weight to moves that occur in a controlled, low-volatility environment, highlighting potential starts of new trends or significant shifts in market sentiment.
### Key Concepts & Purpose
The indicator's unique formula synthesizes the following concepts:
1. **Price Change:** Measures the magnitude and direction of the primary move.
2. **Relative Volume (RVOL):** Confirms that the move is backed by significant volume compared to its recent average, indicating institutional participation.
3. **Cumulative Volume Delta (CVD):** Measures the underlying buying and selling pressure, confirming that the price move is aligned with the net flow of market orders.
4. **Inverse Volatility (ATR):** This is the indicator's unique twist. It normalizes the signal by the inverse of the Average True Range. This means the indicator's value is **amplified** when volatility (ATR) is low (signifying a controlled, confident expansion) and **dampened** when volatility is high (filtering out chaotic, less predictable moves).
The goal is to provide a single, easy-to-read oscillator that signals when price, volume, and order flow are all in alignment, especially during a breakout from a period of contraction.
### Features
* **Main Oscillator Line:** A single line plotted in a separate pane that represents the calculated strength of the volumetric expansion or contraction.
* **Zero Line:** A dotted reference line to easily distinguish between bullish (above zero) and bearish (below zero) regimes.
* **Visual Threshold Zones:** The background automatically changes color to highlight periods of significant strength:
* **Bright Green:** Indicates a "Strong Up Move" when the oscillator crosses above the user-defined upper threshold.
* **Bright Fuchsia:** Indicates a "Strong Down Move" when the oscillator crosses below the user-defined lower threshold.
### Configurable Settings & Filters
The indicator is fully customizable to allow for extensive testing and adaptation to different assets and timeframes.
#### Main Calculation Inputs
* **Price Change Lookback:** Sets the period for calculating the primary price change.
* **CVD Normalization Length:** The lookback period for normalizing the Cumulative Volume Delta.
* **RVOL Avg Volume Length:** The lookback for the simple moving average of volume, used to calculate RVOL.
* **RVOL Normalization Length:** The lookback period for normalizing the RVOL score.
* **ATR Length & Normalization Length:** Sets the periods for calculating the ATR and its longer-term average for normalization.
#### Weights
* Fine-tune the impact of each core component on the final calculation, allowing you to emphasize what matters most to your strategy (e.g., give more weight to CVD or RVOL).
#### External Market Filter (Powerful Feature)
* **Enable SPY/QQQ Filter for Up Moves?:** A checkbox to activate a powerful regime filter.
* **Symbol:** A dropdown to choose whether to filter signals based on the trend of **SPY** or **QQQ**.
* **SMA Period:** Sets the lookback period for the Simple Moving Average (default is 50).
* **How it works:** When enabled, this filter will **only allow "Strong Up Move" signals to appear if the chosen symbol (SPY or QQQ) is currently trading above its specified SMA**. This is an excellent tool for aligning your signals with the broader market trend and avoiding bullish entries in a bearish market.
#### Visuals
* **Upper/Lower Threshold:** Allows you to define what level the oscillator must cross to trigger the colored background zones, letting you customize the indicator's sensitivity.
***
**Disclaimer:** This tool is designed for market analysis and confluence. It is not a standalone trading system. Always use this indicator in conjunction with your own trading strategy, risk management, and other forms of analysis.

MirPapa:ICT:HTF: FVG OB Threeple# MirPapa:ICT:HTF: FVG OB (Fair Value Gap Order Block)
**Version:** Pine Script® v6
**Author:** © goodia
**License:** MPL-2.0 (Mozilla Public License 2.0)
---
## Overview
“FVG OB” (Fair Value Gap Order Block) identifies higher-timeframe candle ranges where a gap (imbalance) exists between two non-consecutive candles, signaling potential institutional order blocks. This module draws bullish or bearish FVG OB boxes on your lower-timeframe chart, extends them until price interacts a specified number of times, and then finalizes (recolors) the box.
---
## Inputs
- **Enable FVG OB Boxes** (`bool`)
Toggle drawing of HTF FVG OB boxes on the chart.
- **Enable FVG OB Midlines** (`bool`)
Toggle drawing of a midpoint line inside each FVG OB box.
- **FVG OB Close Count** (`int` 1–10)
Number of HTF closes beyond the FVG range required to finalize (recolor) the box.
- **FVG OB Bull Color** (`color`)
Fill & border color for bullish FVG OB boxes.
- **FVG OB Bear Color** (`color`)
Fill & border color for bearish FVG OB boxes.
- **FVG OB Box Transparency** (`int` 1–100)
Opacity level for FVG OB box fills (higher = more transparent).
---
## How It Works
1. **HTF Data Retrieval**
- The script uses `request.security()` (via `GetHTFrevised()`) to fetch HTF OHLC and historical values:
- `_htfHigh3` (high three bars ago) and `_htfLow1` (low one bar ago) for bullish FVG OB.
- `_htfLow3` (low three bars ago) and `_htfHigh1` (high one bar ago) for bearish FVG OB.
- It also tracks the HTF `bar_index` on the lower timeframe to align drawing.
2. **FVG OB Detection**
- **Bullish FVG OB**: Occurs when the HTF low of the previous bar (`low `) is strictly above the HTF high of three bars ago (`high `), creating a gap.
- **Bearish FVG OB**: Occurs when the HTF high of the previous bar (`high `) is strictly below the HTF low of three bars ago (`low `), creating a gap.
3. **Box Creation**
- On each new HTF bar (`ta.change(time(HTF)) != 0`), if a bullish or bearish FVG OB condition is met, the script calls `CreateBoxData()` with:
- **Bullish**: `bottom = HTF low `, `top = HTF high `, `_isBull = true`.
- **Bearish**: `bottom = HTF low `, `top = HTF high `, `_isBull = false`.
- Midline toggled by input.
- A `BoxData` struct is created and stored in either the Bull or Bear array.
4. **Box Extension & Finalization**
- On **every LTF bar**, `ProcessBoxDatas(...)` iterates over all active FVG OB boxes:
1. **Extend Right Edge**: `box.set_right(bar_index)` ensures the box follows the latest bar.
2. **Record Volume Delta**: Tracks buy/sell volume inside the box.
3. **Touch Stage Update**: `modBoxUpdateStage()` increments `_stage` when price touches its “basePoint” (for FVG OB, the basePrice is one side of the gap).
4. **Finalize**: `setBoxFinalize()` checks if the configured number of closes beyond the FVG gap (`FVG OB Close Count`) has occurred. If so:
- `_isActive := false`
- Border and background colors are changed to the “Box Close Color” (input).
- Finalized boxes remain on screen semi-transparent, indicating that the FVG OB zone has been tested.
5. **Midline (Optional)**
- If “Enable FVG OB Midlines” is checked, `ProcessBoxDatas()` also extends a horizontal midpoint line inside the box with `line.set_x2(bar_index)`.
---
## Usage Instructions
1. **Installation**
- Copy the FVG OB section of the Pine Script into TradingView’s Pine Editor (ensure the library import is included).
- Click “Add to Chart.”
2. **Configure Inputs**
- Choose a Higher Time Frame via the dropdown (e.g., “4시간” maps to a 4H timeframe).
- Toggle “Enable FVG OB Boxes” and “Enable FVG OB Midlines.”
- Select colors for bullish and bearish boxes and set transparency.
- Adjust “FVG OB Close Count” to control how many closes beyond the gap finalize the box.
3. **Interpretation**
- **Active FVG OB Boxes** extend to the right until price closes beyond the gap range the specified number of times.
- When finalized, each box changes to the “Box Close Color,” signaling that institutional orders in that gap have likely been filled.
Enjoy precise visualization of higher-timeframe Fair Value Gap Order Blocks on your lower-timeframe chart!

Super Arma Institucional PRO v6.3Super Arma Institucional PRO v6.3
Description
Super Arma Institucional PRO v6.3 is a multifunctional indicator designed for traders looking for a clear and objective analysis of the market, focusing on trends, key price levels and high liquidity zones. It combines three essential elements: moving averages (EMA 20, SMA 50, EMA 200), dynamic support and resistance, and volume-based liquidity zones. This integration offers an institutional view of the market, ideal for identifying strategic entry and exit points.
How it Works
Moving Averages:
EMA 20 (orange): Sensitive to short-term movements, ideal for capturing fast trends.
SMA 50 (blue): Represents the medium-term trend, smoothing out fluctuations.
EMA 200 (red): Indicates the long-term trend, used as a reference for the general market bias.
Support and Resistance: Calculated based on the highest and lowest prices over a defined period (default: 20 bars). These dynamic levels help identify zones where the price may encounter barriers or supports.
Liquidity Zones: Purple rectangles are drawn in areas of significantly above-average volume, indicating regions where large market participants (institutional) may be active. These zones are useful for anticipating price movements or order absorption.
Purpose
The indicator was developed to provide a clean and institutional view of the market, combining classic tools (moving averages and support/resistance) with modern liquidity analysis. It is ideal for traders operating swing trading or position trading strategies, allowing to identify:
Short, medium and long-term trends.
Key support and resistance levels to plan entries and exits.
High liquidity zones where institutional orders can influence the price.
Settings
Show EMA 20 (true): Enables/disables the 20-period EMA.
Show SMA 50 (true): Enables/disables the 50-period SMA.
Show EMA 200 (true): Enables/disables the 200-period EMA.
Support/Resistance Period (20): Sets the period for calculating support and resistance levels.
Liquidity Sensitivity (20): Period for calculating the average volume.
Minimum Liquidity Factor (1.5): Multiplier of the average volume to identify high liquidity zones.
How to Use
Moving Averages:
Crossovers between the EMA 20 and SMA 50 may indicate short/medium-term trend changes.
The EMA 200 serves as a reference for the long-term bias (above = bullish, below = bearish).
Support and Resistance: Use the red (resistance) and green (support) lines to identify reversal or consolidation zones.
Liquidity Zones: The purple rectangles highlight areas of high volume, where the price may react (reversal or breakout). Consider these zones to place orders or manage risks.
Adjust the parameters according to the asset and timeframe to optimize the analysis.
Notes
The chart should be configured only with this indicator to ensure clarity.
Use on timeframes such as 1 hour, 4 hours or daily for better visualization of liquidity zones and support/resistance levels.
Avoid adding other indicators to the chart to keep the script output easily identifiable.
The indicator is designed to be clean, without explicit buy/sell signals, following an institutional approach.
This indicator is perfect for traders who want a visually clear and powerful tool to trade based on trends, key levels and institutional behavior.

Grid Tendence V1The “Grid Tendence V1” strategy is based on the classic Grid strategy, only in this case the entries and exits are made in favor of the trend, which allows to take advantage of large movements to maximize profits, since it is also possible to enter and exit with the balance with a controlled risk, because precisely the distance between each Grid works as a natural and adaptable stop loss and take profit. This fact helps to avoid overlapping entries and exits that would result from using stop loss and take profit as limit orders.
In this version of the script the entries and exits are always at market, and based on the percentage change of the price, not on the profit or loss of the current position.
The user will notice that the strategy setup is based on a controlled risk, risking 5% on each trade, a fairly standard commission and a modest initial capital, all this in order to protect the user of the strategy from unexpected or unrealistic results.
However, it is always recommended to optimize the parameters so that the strategy is effective for each asset and for each time frame.

Quadruple EMA (QEMA)The Quadruple Exponential Moving Average (QEMA) is an advanced technical indicator that extends the concept of lag reduction beyond TEMA (Triple Exponential Moving Average) to a fourth order. By applying a sophisticated four-stage EMA cascade with optimized coefficient distribution, QEMA provides the ultimate evolution in EMA-based lag reduction techniques.
Unlike traditional compund moving averages like DEMA and TEMA, QEMA implements a progressive smoothing system that strategically distributes alphas across four EMA stages and combines them with balanced coefficients (4, -6, 4, -1). This approach creates an indicator that responds extremely quickly to price changes while still maintaining sufficient smoothness to be useful for trading decisions. QEMA is particularly valuable for traders who need the absolute minimum lag possible in trend identification.
▶️ **Core Concepts**
Fourth-order processing: Extends the EMA cascade to four stages for maximum possible lag reduction while maintaining a useful signal
Progressive alpha system: Uses mathematically derived ratio-based alpha progression to balance responsiveness across all four EMA stages
Optimized coefficients: Employs calculated weights (4, -6, 4, -1) to effectively eliminate lag while preserving compound signal stability
Numerical stability control: Implements initialization and alpha distribution to ensure consistent results from the first calculation bar
QEMA achieves its exceptional lag reduction by combining four progressive EMAs with mathematically optimized coefficients. The formula is designed to maximize responsiveness while minimizing the overshoot problems that typically occur with aggressive lag reduction techniques. The implementation uses a ratio-based alpha progression that ensures each EMA stage contributes appropriately to the final result.
▶️ **Common Settings and Parameters**
Period: Default: 15| Base smoothing period | When to Adjust: Decrease for extremely fast signals, increase for more stable output
Alpha: Default: auto | Direct control of base smoothing factor | When to Adjust: Manual setting allows precise tuning beyond standard period settings
Source: Default: Close | Data point used for calculation | When to Adjust: Change to HL2 or HLC3 for more balanced price representation
Pro Tip: Professional traders often use QEMA with longer periods than other moving averages (e.g., QEMA(20) instead of EMA(10)) since its extreme lag reduction provides earlier signals even with longer periods.
▶️ **Calculation and Mathematical Foundation**
Simplified explanation:
QEMA works by calculating four EMAs in sequence, with each EMA taking the previous one as input. It then combines these EMAs using balancing weights (4, -6, 4, -1) to create a moving average with extremely minimal lag and high level of smoothness. The alpha factors for each EMA are progressively adjusted using a mathematical ratio to ensure balanced responsiveness across all stages.
Technical formula:
QEMA = 4 × EMA₁ - 6 × EMA₂ + 4 × EMA₃ - EMA₄
Where:
EMA₁ = EMA(source, α₁)
EMA₂ = EMA(EMA₁, α₂)
EMA₃ = EMA(EMA₂, α₃)
EMA₄ = EMA(EMA₃, α₄)
α₁ = 2/(period + 1) is the base smoothing factor
r = (1/α₁)^(1/3) is the derived ratio
α₂ = α₁ × r, α₃ = α₂ × r, α₄ = α₃ × r are the progressive alphas
Mathematical Rationale for the Alpha Cascade:
The QEMA indicator employs a specific geometric progression for its smoothing factors (alphas) across the four EMA stages. This design is intentional and aims to optimize the filter's performance. The ratio between alphas is **r = (1/α₁)^(1/3)** - derived from the cube root of the reciprocal of the base alpha.
For typical smoothing (α₁ < 1), this results in a sequence of increasing alpha values (α₁ < α₂ < α₃ < α₄), meaning that subsequent EMAs in the cascade are progressively faster (less smoothed). This specific progression, when combined with the QEMA coefficients (4, -6, 4, -1), is chosen for the following reasons:
1. Optimized Frequency Response:
Using the same alpha for all EMA stages (as in a naive multi-EMA approach) can lead to an uneven frequency response, potentially causing over-shooting of certain frequencies or creating undesirable resonance. The geometric progression of alphas in QEMA helps to create a more balanced and controlled filter response across a wider range of movement frequencies. Each stage's contribution to the overall filtering characteristic is more harmonized.
2. Minimized Phase Lag:
A key goal of QEMA is extreme lag reduction. The specific alpha cascade, particularly the relationship defined by **r**, is designed to minimize the cumulative phase lag introduced by the four smoothing stages, while still providing effective noise reduction. Faster subsequent EMAs contribute to this reduced lag.
🔍 Technical Note: The ratio-based alpha progression is crucial for balanced response. The ratio r is calculated as the cube root of 1/α₁, ensuring that the combined effect of all four EMAs creates a mathematically optimal response curve. All EMAs are initialized with the first source value rather than using progressive initialization, eliminating warm-up artifacts and providing consistent results from the first bar.
▶️ **Interpretation Details**
QEMA provides several key insights for traders:
When price crosses above QEMA, it signals the beginning of an uptrend with minimal delay
When price crosses below QEMA, it signals the beginning of a downtrend with minimal delay
The slope of QEMA provides immediate insight into trend direction and momentum
QEMA responds to price reversals significantly faster than other moving averages
Multiple QEMA lines with different periods can identify immediate support/resistance levels
QEMA is particularly valuable in fast-moving markets and for short-term trading strategies where speed of signal generation is critical. It excels at capturing the very beginning of trends and identifying reversals earlier than any other EMA-derived indicator. This makes it especially useful for breakout trading and scalping strategies where getting in early is essential.
▶️ **Limitations and Considerations**
Market conditions: Can generate excessive signals in choppy, sideways markets due to its extreme responsiveness
Overshooting: The aggressive lag reduction can create some overshooting during sharp reversals
Calculation complexity: Requires four separate EMA calculations plus coefficient application, making it computationally more intensive
Parameter sensitivity: Small changes in the base alpha or period can significantly alter behavior
Complementary tools: Should be used with momentum indicators or volatility filters to confirm signals and reduce false positives
▶️ **References**
Mulloy, P. (1994). "Smoothing Data with Less Lag," Technical Analysis of Stocks & Commodities .
Ehlers, J. (2001). Rocket Science for Traders . John Wiley & Sons.
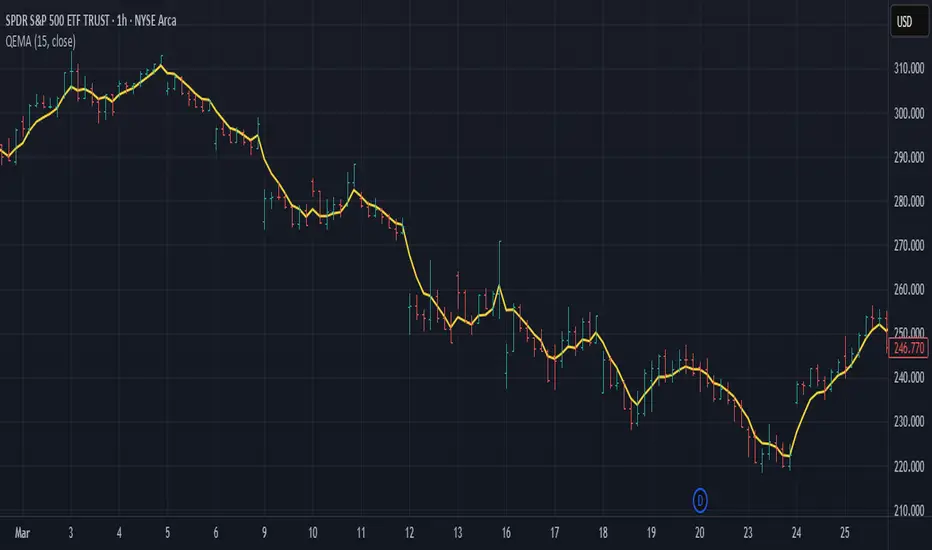
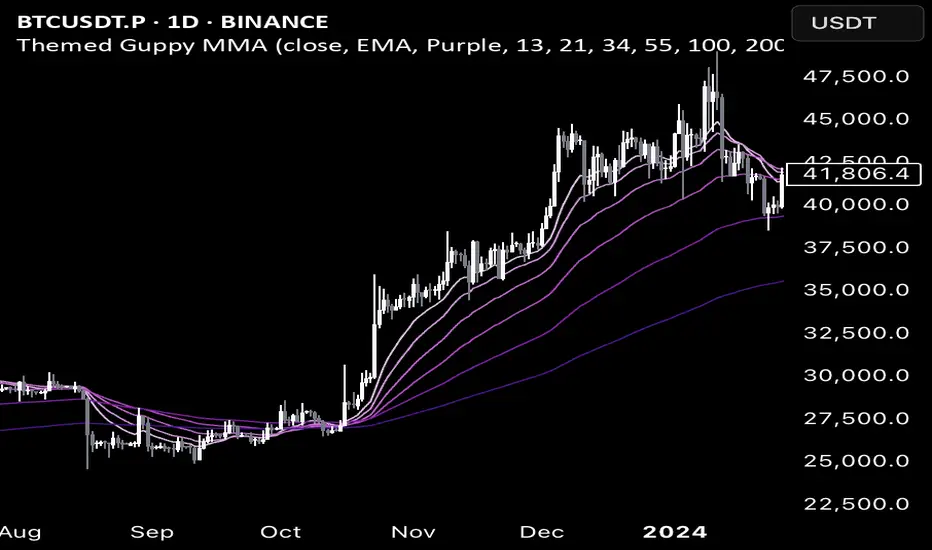
Color Themed Guppy Multiple Moving Average
========== TLDR ==========
The "Color Themed Guppy Multiple Moving Average" plots a group of 6 Moving Averages on your chart with a selection of color themes to automatically style the different length Moving Average lines. As someone who struggles with screens and colors on a busy chart, this indicator has helped me a lot in quickly identifying which Moving Average price is respecting the most - giving me better signals for trade entries and trend loss.
========== Key Features and Advantages ==========
- Show different length Moving Averages with a single indicator
- quickly make your chart more readable with 12 different color themes
- The themes will color the Moving Averages with a gradient (light - dark), with a lighter color indicating a shorter length or 'faster' Moving Average
- Select the type of Moving Average you would like to use
========== Use Cases ==========
Identify Specific Length Moving Averages That are Acting as Support or Resistance:
Having each Moving Average coloured by a theme makes it easier to track each individual line with your eyes, making it easier to quickly find the Moving Averages that price is respecting the most for a given asset and/or trend.
Get Bias Quickly:
When all 6 of the Moving Averages are 'stacked' on top of each other in order, and all are angled either up or down, it can provide a useful bias for the market on your timeframe.
For example, If the fastest (smallest length) Moving Averages are angled up and sitting above the slower (largest length) Moving Averages, it may indicate that a 'long' bias would be preferable for any trades.
Having a color gradient from the themes makes it much easier to see when the Moving Average lines are "stacked" in order.
Identify Turning Points:
When the faster (smallest length) Moving Averages start to cross over the slower (largest length) Moving Averages, it may indicate a potential price/trend reversal.
Again, having a color gradient from the themes makes it much easier to spot this
========== Theme Options ==========
- Red
- Orange
- Yellow
- Green
- Teal
- Light Blue
- Blue
- Violet
- Purple
- Pink
- Rainbow - Solid
- Rainbow - Light
If you'd like other themes added feel free to request them in the comments and I can try to add more.
[3Commas] Turtle StrategyTurtle Strategy
🔷 What it does: This indicator implements a modernized version of the Turtle Trading Strategy, designed for trend-following and automated trading with webhook integration. It identifies breakout opportunities using Donchian channels, providing entry and exit signals.
Channel 1: Detects short-term breakouts using the highest highs and lowest lows over a set period (default 20).
Channel 2: Acts as a confirmation filter by applying an offset to the same period, reducing false signals.
Exit Channel: Functions as a dynamic stop-loss (wait for candle close), adjusting based on market structure (default 10 periods).
Additionally, traders can enable a fixed Take Profit level, ensuring a systematic approach to profit-taking.
🔷 Who is it for:
Trend Traders: Those looking to capture long-term market moves.
Bot Users: Traders seeking to automate entries and exits with bot integration.
Rule-Based Traders: Operators who prefer a structured, systematic trading approach.
🔷 How does it work: The strategy generates buy and sell signals using a dual-channel confirmation system.
Long Entry: A buy signal is generated when the close price crosses above the previous high of Channel 1 and is confirmed by Channel 2.
Short Entry: A sell signal occurs when the close price falls below the previous low of Channel 1, with confirmation from Channel 2.
Exit Management: The Exit Channel acts as a trailing stop, dynamically adjusting to price movements. To exit the trade, wait for a full bar close.
Optional Take Profit (%): Closes trades at a predefined %.
🔷 Why it’s unique:
Modern Adaptation: Updates the classic Turtle Trading Strategy, with the possibility of using a second channel with an offset to filter the signals.
Dynamic Risk Management: Utilizes a trailing Exit Channel to help protect gains as trades move favorably.
Bot Integration: Automates trade execution through direct JSON signal communication with your DCA Bots.
🔷 Considerations Before Using the Indicator:
Market & Timeframe: Best suited for trending markets; higher timeframes (e.g., H4, D1) are recommended to minimize noise.
Sideways Markets: In choppy conditions, breakouts may lead to false signals—consider using additional filters.
Backtesting & Demo Testing: It is crucial to thoroughly backtest the strategy and run it on a demo account before risking real capital.
Parameter Adjustments: Ensure that commissions, slippage, and position sizes are set accurately to reflect real trading conditions.
🔷 STRATEGY PROPERTIES
Symbol: BINANCE:ETHUSDT (Spot).
Timeframe: 4h.
Test Period: All historical data available.
Initial Capital: 10000 USDT.
Order Size per Trade: 1% of Capital, you can use a higher value e.g. 5%, be cautious that the Max Drawdown does not exceed 10%, as it would indicate a very risky trading approach.
Commission: Binance commission 0.1%, adjust according to the exchange being used, lower numbers will generate unrealistic results. By using low values e.g. 5%, it allows us to adapt over time and check the functioning of the strategy.
Slippage: 5 ticks, for pairs with low liquidity or very large orders, this number should be increased as the order may not be filled at the desired level.
Margin for Long and Short Positions: 100%.
Indicator Settings: Default Configuration.
Period Channel 1: 20.
Period Channel 2: 20.
Period Channel 2 Offset: 20.
Period Exit: 10.
Take Profit %: Disable.
Strategy: Long & Short.
🔷 STRATEGY RESULTS
⚠️Remember, past results do not guarantee future performance.
Net Profit: +516.87 USDT (+5.17%).
Max Drawdown: -100.28 USDT (-0.95%).
Total Closed Trades: 281.
Percent Profitable: 40.21%.
Profit Factor: 1.704.
Average Trade: +1.84 USDT (+1.80%).
Average # Bars in Trades: 29.
🔷 How to Use It:
🔸 Adjust Settings:
Select your asset and timeframe suited for trend trading.
Adjust the periods for Channel 1, Channel 2, and the Exit Channel to align with the asset’s historical behavior. You can visualize these channels by going to the Style tab and enabling them.
For example, if you set Channel 2 to 40 with an offset of 40, signals will take longer to appear but will aim for a more defined trend.
Experiment with different values, a possible exit configuration is using 20 as well. Compare the results and adjust accordingly.
Enable the Take Profit (%) option if needed.
🔸Results Review:
It is important to check the Max Drawdown. This value should ideally not exceed 10% of your capital. Consider adjusting the trade size to ensure this threshold is not surpassed.
Remember to include the correct values for commission and slippage according to the symbol and exchange where you are conducting the tests. Otherwise, the results will not be realistic.
If you are satisfied with the results, you may consider automating your trades. However, it is strongly recommended to use a small amount of capital or a demo account to test proper execution before committing real funds.
🔸Create alerts to trigger the DCA Bot:
Verify Messages: Ensure the message matches the one specified by the DCA Bot.
Multi-Pair Configuration: For multi-pair setups, enable the option to add the symbol in the correct format.
Signal Settings: Enable the option to receive long or short signals (Entry | TP | SL), copy and paste the messages for the DCA Bots configured.
Alert Setup:
When creating an alert, set the condition to the indicator and choose "alert() function call only".
Enter any desired Alert Name.
Open the Notifications tab, enable Webhook URL, and paste the Webhook URL.
For more details, refer to the section: "How to use TradingView Custom Signals".
Finalize Alerts: Click Create, you're done! Alerts will now be sent automatically in the correct format.
🔷 INDICATOR SETTINGS
Period Channel 1: Period of highs and lows to trigger signals
Period Channel 2: Period of highs and lows to filter signals
Offset: Move Channel 2 to the right x bars to try to filter out the favorable signals.
Period Exit: It is the period of the Donchian channel that is used as trailing for the exits.
Strategy: Order Type direction in which trades are executed.
Take Profit %: When activated, the entered value will be used as the Take Profit in percentage from the entry price level.
Use Custom Test Period: When enabled signals only works in the selected time window. If disabled it will use all historical data available on the chart.
Test Start and End: Once the Custom Test Period is enabled, here you select the start and end date that you want to analyze.
Check Messages: Check Messages: Enable this option to review the messages that will be sent to the bot.
Entry | TP | SL: Enable this options to send Buy Entry, Take Profit (TP), and Stop Loss (SL) signals.
Deal Entry and Deal Exit: Copy and paste the message for the deal start signal and close order at Market Price of the DCA Bot. This is the message that will be sent with the alert to the Bot, you must verify that it is the same as the bot so that it can process properly.
DCA Bot Multi-Pair: You must activate it if you want to use the signals in a DCA Bot Multi-pair in the text box you must enter (using the correct format) the symbol in which you are creating the alert, you can check the format of each symbol when you create the bot.
👨🏻💻💭 We hope this tool helps enhance your trading. Your feedback is invaluable, so feel free to share any suggestions for improvements or new features you'd like to see implemented.
__
The information and publications within the 3Commas TradingView account are not meant to be and do not constitute financial, investment, trading, or other types of advice or recommendations supplied or endorsed by 3Commas and any of the parties acting on behalf of 3Commas, including its employees, contractors, ambassadors, etc.

Anchor Buy Sell LevelsDaily Validity:
The indicator generates a single horizontal line (either a Buy Level or a Sell Level) that remains valid throughout the entire trading day.
Source of the Signal:
The level (buy or sell) is determined using candles that were generated before the day in question.
Selection Logic:
When determining the level, the indicator checks past candles in descending order (from the most recent backward).
The very first candle encountered that meets the respective logic (either the buy or sell condition) sets the level.
Buy and Sell Logic:
Buy Signal: Generated when a candle’s close is lower than both the previous candle’s close and the next candle’s close (i.e., a local minimum). The Buy Level is drawn at the low of that qualifying candle.
Sell Signal: Generated when a candle’s close is higher than both the previous candle’s close and the next candle’s close (i.e., a local maximum). The Sell Level is drawn at the high of that qualifying candle.
One Signal per Day:
For any given day, the indicator will display either a Buy Level or a Sell Level—not both. The decision is based on which qualifying candle (and its corresponding condition) is found first when scanning the historical data in descending order.

EMA POD Indicator #gangesThis script is a technical analysis indicator that uses multiple Exponential Moving Averages (EMAs) to identify trends and track price changes in the market. Here's a breakdown:
EMA Calculation: It calculates six different EMAs (for periods 5, 10, 20, 50, 100, and 150) to track short- and long-term trends.
Trend Identification:
Uptrend: The script identifies an uptrend when the EMAs are in ascending order (EMA5 > EMA10 > EMA20 > EMA50 > EMA100 > EMA150).
Downtrend: A downtrend is identified when the EMAs are not in ascending order.
Trend Change Tracking: It tracks when an uptrend starts and ends, displaying the duration of the trend and the percentage price change during the trend.
Visuals:
It plots the EMAs on the chart with different colors.
It adds green and red lines to represent the ongoing uptrend and downtrend.
Labels are displayed showing when the uptrend starts and ends, along with the trend's duration and price change percentage.
In short, this indicator helps visualize trends, track their changes, and measure the impact of those trends on price.

[3Commas] HA & MAHA & MA
🔷What it does: This tool is designed to test a trend-following strategy using Heikin Ashi candles and moving averages. It enters trades after pullbacks, aiming to let profits run once the risk-to-reward ratio reaches 1:1 while securing the position.
🔷Who is it for: It is ideal for traders looking to compare final results using fixed versus dynamic take profits by adjusting parameters and trade direction—a concept applicable to most trading strategies.
🔷How does it work: We use moving averages to define the market trend, then wait for opposite Heikin Ashi candles to form against it. Once these candles reverse in favor of the trend, we enter the trade, using the last swing created by the pullback as the stop loss. By applying the breakeven ratio, we protect the trade and let it run, using the slower moving average as a trailing stop.
A buy signal is generated when:
The previous candle is bearish (ha_bear ), indicating a pullback.
The fast moving average (ma1) is above the slow moving average (ma2), confirming an uptrend.
The current candle is bullish (ha_bull), showing trend continuation.
The Heikin Ashi close is above the fast moving average (ma1), reinforcing the bullish bias.
The real price close is above the open (close > open), ensuring bullish momentum in actual price data.
The signal is confirmed on the closed candle (barstate.isconfirmed) to avoid premature signals.
dir is undefined (na(dir)), preventing repeated signals in the same direction.
A sell signal is generated when:
The previous candle is bullish (ha_bull ), indicating a temporary upward move before a potential reversal.
The fast moving average (ma1) is below the slow moving average (ma2), confirming a downtrend.
The current candle is bearish (ha_bear), showing trend continuation to the downside.
The Heikin Ashi close is below the fast moving average (ma1), reinforcing bearish pressure.
The real price close is below the open (close < open), confirming bearish momentum in actual price data.
The signal is confirmed after the candle closes (barstate.isconfirmed), avoiding premature entries.
dir is undefined (na(dir)), preventing consecutive signals in the same direction.
In simple terms, this setup looks for trend continuation after a pullback, confirming entries with both Heikin Ashi and real price action, supported by moving average alignment to avoid false signals.
If the price reaches a 1:1 risk-to-reward ratio, the stop will be moved to the entry point. However, if the slow moving average surpasses this level, it will become the new exit point, acting as a trailing stop
🔷Why It’s Unique
Easily visualizes the benefits of using risk-to-reward ratios when trading instead of fixed percentages.
Provides a simple and straightforward approach to trading, embracing the "keep it simple" concept.
Offers clear visualization of DCA Bot entry and exit points based on user preferences.
Includes an option to review the message format before sending signals to bots, with compatibility for multi-pair and futures contract pairs.
🔷 Considerations Before Using the Indicator
⚠️Very important: The indicator must be used on charts with real price data, such as Japanese candlesticks, line charts, etc. Do not use it on Heikin Ashi charts, as this may lead to unrealistic results.
🔸Since this is a trend-following strategy, use it on timeframes above 4 hours, where market noise is reduced and trends are clearer. Also, carefully review the statistics before using it, focusing on pairs that tend to have long periods of well-defined trends.
🔸Disadvantages:
False Signals in Ranges: Consolidating markets can generate unreliable signals.
Lagging Indicator: Being based on moving averages, it may react late to sudden price movements.
🔸Advantages:
Trend Focused: Simplifies the identification of trending markets.
Noise Reduction: Uses Heikin Ashi candles to identify trend continuation after pullbacks.
Broad Applicability: Suitable for forex, crypto, stocks, and commodities.
🔸The strategy provides a systematic way to analyze markets but does not guarantee successful outcomes. Use it as an additional tool rather than relying solely on an automated system.
Trading results depend on various factors, including market conditions, trader discipline, and risk management. Past performance does not ensure future success, so always approach the market cautiously.
🔸Risk Management: Define stop-loss levels, position sizes, and profit targets before entering any trade. Be prepared for potential losses and ensure your approach aligns with your overall trading plan.
🔷 STRATEGY PROPERTIES
Symbol: BINANCE:BTCUSDT (Spot).
Timeframe: 4h.
Test Period: All historical data available.
Initial Capital: 10000 USDT.
Order Size per Trade: 1% of Capital, you can use a higher value e.g. 5%, be cautious that the Max Drawdown does not exceed 10%, as it would indicate a very risky trading approach.
Commission: Binance commission 0.1%, adjust according to the exchange being used, lower numbers will generate unrealistic results. By using low values e.g. 5%, it allows us to adapt over time and check the functioning of the strategy.
Slippage: 5 ticks, for pairs with low liquidity or very large orders, this number should be increased as the order may not be filled at the desired level.
Margin for Long and Short Positions: 100%.
Indicator Settings: Default Configuration.
MA1 Length: 9.
MA2 Length: 18.
MA Calculations: EMA.
Take Profit Ratio: Disable. Ratio 1:4.
Breakeven Ratio: Enable, Ratio 1:1.
Strategy: Long & Short.
🔷 STRATEGY RESULTS
⚠️Remember, past results do not guarantee future performance.
Net Profit: +324.88 USDT (+3.25%).
Max Drawdown: -81.18 USDT (-0.78%).
Total Closed Trades: 672.
Percent Profitable: 35.57%.
Profit Factor: 1.347.
Average Trade: +0.48 USDT (+0.48%).
Average # Bars in Trades: 13.
🔷 HOW TO USE
🔸 Adjust Settings:
The default values—MA1 (9) and MA2 (18) with EMA calculation—generally work well. However, you can increase these values, such as 20 and 40, to better identify stronger trends.
🔸 Choose a Symbol that Typically Trends:
Select an asset that tends to form clear trends. Keep in mind that the Strategy Tester results may show poor performance for certain assets, making them less suitable for sending signals to bots.
🔸 Experiment with Ratios:
Test different take profit and breakeven ratios to compare various scenarios—especially to observe how the strategy performs when only the trade is protected.
🔸This is an example of how protecting the trade works: once the price moves in favor of the position with a 1:1 risk-to-reward ratio, the stop loss is moved to the entry price. If the Slow MA surpasses this level, it will act as a trailing stop, aiming to follow the trend and maximize potential gains.
🔸In contrast, in this example, for the same trade, if we set a take profit at a 1:3 risk-to-reward ratio—which is generally considered a good risk-reward relationship—we can see how a significant portion of the upward move is left on the table.
🔸Results Review:
It is important to check the Max Drawdown. This value should ideally not exceed 10% of your capital. Consider adjusting the trade size to ensure this threshold is not surpassed.
Remember to include the correct values for commission and slippage according to the symbol and exchange where you are conducting the tests. Otherwise, the results will not be realistic.
If you are satisfied with the results, you may consider automating your trades. However, it is strongly recommended to use a small amount of capital or a demo account to test proper execution before committing real funds.
🔸Create alerts to trigger the DCA Bot:
Verify Messages: Ensure the message matches the one specified by the DCA Bot.
Multi-Pair Configuration: For multi-pair setups, enable the option to add the symbol in the correct format.
Signal Settings: Enable whether you want to receive long or short signals (Entry | TP | SL), copy and paste the the messages for the DCA Bots configured.
Alert Setup:
When creating an alert, set the condition to the indicator and choose "alert() function call only.
Enter any desired Alert Name.
Open the Notifications tab, enable Webhook URL, and paste the Webhook URL.
For more details, refer to the section: "How to use TradingView Custom Signals".
Finalize Alerts: Click Create, you're done! Alerts will now be sent automatically in the correct format.
🔷 INDICATOR SETTINGS
MA 1: Fast MA Length
MA 2: Slow MA Length
MA Calc: MA's Calculations (SMA,EMA, RMA,WMA)
TP Ratio: This is the take profit ratio relative to the stop loss, where the trade will be closed in profit.
BE Ratio: This is the breakeven ratio relative to the stop loss, where the stop loss will be updated to breakeven or if the MA2 is greater than this level.
Strategy: Order Type direction in which trades are executed.
Use Custom Test Period: When enabled signals only works in the selected time window. If disabled it will use all historical data available on the chart.
Test Start and End: Once the Custom Test Period is enabled, here you select the start and end date that you want to analyze.
Check Messages: Enable the table to review the messages to be sent to the bot.
Entry | TP | SL: Enable this options to send Buy Entry, Take Profit (TP), and Stop Loss (SL) signals.
Deal Entry and Deal Exit : Copy and paste the message for the deal start signal and close order at Market Price of the DCA Bot. This is the message that will be sent with the alert to the Bot, you must verify that it is the same as the bot so that it can process properly so that it executes and starts the trade.
DCA Bot Multi-Pair: You must activate it if you want to use the signals in a DCA Bot Multi-pair in the text box you must enter (using the correct format) the symbol in which you are creating the alert, you can check the format of each symbol when you create the bot.
👨🏻💻💭 We hope this tool helps enhance your trading. Your feedback is invaluable, so feel free to share any suggestions for improvements or new features you'd like to see implemented.
__
The information and publications within the 3Commas TradingView account are not meant to be and do not constitute financial, investment, trading, or other types of advice or recommendations supplied or endorsed by 3Commas and any of the parties acting on behalf of 3Commas, including its employees, contractors, ambassadors, etc.

Honest Volatility Grid [Honestcowboy]The Honest Volatility Grid is an attempt at creating a robust grid trading strategy but without standard levels.
Normal grid systems use price levels like 1.01;1.02;1.03;1.04... and place an order at each of these levels. In this program instead we create a grid using keltner channels using a long term moving average.
🟦 IS THIS EVEN USEFUL?
The idea is to have a more fluid style of trading where levels expand and follow price and do not stick to precreated levels. This however also makes each closed trade different instead of using fixed take profit levels. In this strategy a take profit level can even be a loss. It is useful as a strategy because it works in a different way than most strategies, making it a good tool to diversify a portfolio of trading strategies.
🟦 STRATEGY
There are 10 levels below the moving average and 10 above the moving average. For each side of the moving average the strategy uses 1 to 3 orders maximum (3 shorts at top, 3 longs at bottom). For instance you buy at level 2 below moving average and you increase position size when level 6 is reached (a cheaper price) in order to spread risks.
By default the strategy exits all trades when the moving average is reached, this makes it a mean reversion strategy. It is specifically designed for the forex market as these in my experience exhibit a lot of ranging behaviour on all the timeframes below daily.
There is also a stop loss at the outer band by default, in case price moves too far from the mean.
What are the risks?
In case price decides to stay below the moving average and never reaches the outer band one trade can create a very substantial loss, as the bands will keep following price and are not at a fixed level.
Explanation of default parameters
By default the strategy uses a starting capital of 25000$, this is realistic for retail traders.
Lot sizes at each level are set to minimum lot size 0.01, there is no reason for the default to be risky, if you want to risk more or increase equity curve increase the number at your own risk.
Slippage set to 20 points: that's a normal 2 pip slippage you will find on brokers.
Fill limit assumtion 20 points: so it takes 2 pips to confirm a fill, normal forex spread.
Commission is set to 0.00005 per contract: this means that for each contract traded there is a 5$ or whatever base currency pair has as commission. The number is set to 0.00005 because pinescript does not know that 1 contract is 100000 units. So we divide the number by 100000 to get a realistic commission.
The script will also multiply lot size by 100000 because pinescript does not know that lots are 100000 units in forex.
Extra safety limit
Normally the script uses strategy.exit() to exit trades at TP or SL. But because these are created 1 bar after a limit or stop order is filled in pinescript. There are strategy.orders set at the outer boundaries of the script to hedge against that risk. These get deleted bar after the first order is filled. Purely to counteract news bars or huge spikes in price messing up backtest.
🟦 VISUAL GOODIES
I've added a market profile feature to the edge of the grid. This so you can see in which grid zone market has been the most over X bars in the past. Some traders may wish to only turn on the strategy whenever the market profile displays specific characteristics (ranging market for instance).
These simply count how many times a high, low, or close price has been in each zone for X bars in the past. it's these purple boxes at the right side of the chart.
🟦 Script can be fully automated to MT5
There are risk settings in lot sizes or % for alerts and symbol settings provided at the bottom of the indicator. The script will send alert to MT5 broker trying to mimic the execution that happens on tradingview. There are always delays when using a bridge to MT5 broker and there could be errors so be mindful of that. This script sends alerts in format so they can be read by tradingview.to which is a bridge between the platforms.
Use the all alert function calls feature when setting up alerts and make sure you provide the right webhook if you want to use this approach.
Almost every setting in this indicator has a tooltip added to it. So if any setting is not clear hover over the (?) icon on the right of the setting.

Liquidity Pools [LuxAlgo]The Liquidity Pools indicator identifies and displays estimated liquidity pools on the chart by analyzing high and low wicked price areas, along with the amount, and frequency of visits to each zone.
🔶 USAGE
Liquidity Pools are areas where smaller participants are likely to place stop-limit orders to manage risks at reasonable swing points. These zones attract institutional traders who use the pending orders as liquidity to enter larger positions, aiming to influence price movements. By monitoring these zones, traders can anticipate market movements and potentially benefit from these dynamics.
Beyond general liquidity theory, identifying zones consistently visited by price aids in using them as support and resistance zones. By analyzing these areas, we can assess how effectively participants enter or exit these zones, helping to gauge their importance.
In the screenshots below, we will explore both sides of the same chart in more detail to display how each zone could be viewed from a bullish and bearish perspective.
Bullish Zones Example:
Bearish Zones Example:
🔶 DETAILS
The method behind this indicator focuses on identifying a swing point and tracking future interactions with it. It adaptively identifies high and low "potential zones". These zones are monitored over time; if a zone meets the user-defined criteria, the script marks and displays these zones on the chart.
🔹 Identification
The method to identify Liquidity Pools in this indicator revolves around 3 main parameters. By utilizing these settings, the indicator can be tailored to produce zones that fit the specific strategic needs of each trader.
Zone Identification Parameters
Zone Contact Amount: This setting determines the number of times each zone must be in contact with the price (and bought or sold out of) before being identified by the indicator as a Liquidity Pool.
For example: When a zone is first displayed, it is considered as having been reached 1 time. When the zone is re-tested for the first time, this is considered the 2nd contact, since the price has seen the zone a total of 2 times.
Bars Required Between Each Contact: This is used to rule out (or in) consecutive candles reaching each zone from the calculation, adding a separation length between zone contact points to refine the zones produced.
For example: When set to "2", the first contact point (first re-test) will be ignored by the script if it is not at least 2 bars away from the initial zone proposal point.
Confirmation Bars: After a zone has reached the desired Contact Amount, this setting will cause the script to wait a specified number of bars before identifying a zone. While this might initially seem counterintuitive, by waiting, we are able to watch the market's reaction to the proposed zone and respond accordingly. If the price were to continue through the potential liquidity zone Immediately, it would not be logical to consider this area as a valid Liquidity Pool.
Displayed in this screenshot, you will see the specific points we are looking for in order to identify these zones.
🔹 Display
After a Liquidity Pool is identified, its boundary line is extended to the current price to keep it in view for reference. This extension will continue until the zone is mitigated (price has closed above or below the zone), after which it will stop extending.
Candles can optionally be colored when returning to the most recent Liquidity Pool if it is still unmitigated, and will only color after the zone is displayed on the chart. Because of this, if a candle is colored within a zone, then its color comes from being inside a previously unmitigated zone.
🔹 Volume
Each time a candle overlaps an Unmitigated Zone, a percentage of its volume will be accumulated to the total for each specific zone. The volume total is displayed on the right end of the extended boundary lines.
This volume data could help to determine the importance of specific zones based on the amount of volume traded within.
Note: This volume is fractional to the percentage of candles that are contained within the zone. If a candle is 50% within a zone, The zone will receive 50% of the candle's volume added to its current total.
🔶 SETTINGS
See above for a more detailed explanation of the "Zone Identification" parameters.
Zone Contact Amount: The number of times the price must bounce from this zone before considering it as a liquidity pool.
Bars Required Between Each Contact: The number of bars to wait before checking for another zone contact.
Confirmation Bars: The number of bars to wait before identifying a zone to confirm validity.
Display Volume Labels: Toggles the display for the volume readout for each Liquidity Pool.
Fill Candles Inside Zones: Toggles the display of colored candles within Liquidity Pools.
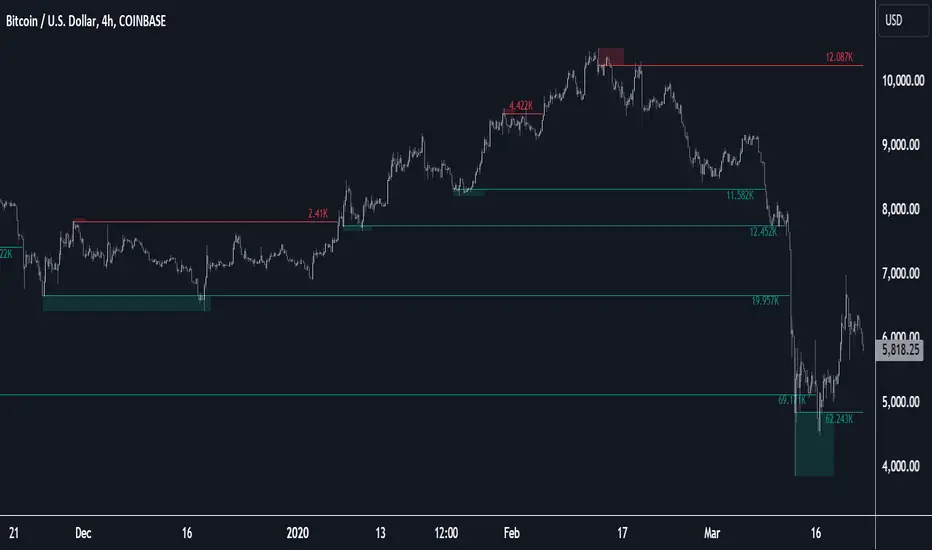
Pivot Points LIVE [CHE]Title:
Pivot Points LIVE Indicator
Subtitle:
Advanced Pivot Point Analysis for Real-Time Trading
Presented by:
Chervolino
Date:
September 24, 2024
Introduction
What are Pivot Points?
Definition:
Pivot Points are technical analysis indicators used to determine potential support and resistance levels in financial markets.
Purpose:
They help traders identify possible price reversal points and make informed trading decisions.
Overview of Pivot Points LIVE :
A comprehensive indicator designed for real-time pivot point analysis.
Offers advanced features for enhanced trading strategies.
Key Features
Pivot Points LIVE Includes:
Dynamic Pivot Highs and Lows:
Automatically detects and plots pivot high (HH, LH) and pivot low (HL, LL) points.
Customizable Visualization:
Multiple options to display markers, price labels, and support/resistance levels.
Fractal Breakouts:
Identifies and marks breakout and breakdown events with symbols.
Line Connection Modes:
Choose between "All Separate" or "Sequential" modes for connecting pivot points.
Pivot Extension Lines:
Extends lines from the latest pivot point to the current bar for trend analysis.
Alerts:
Configurable alerts for breakout and breakdown events.
Inputs and Configuration
Grouping Inputs for Easy Customization:
Source / Length Left / Length Right:
Pivot High Source: High price by default.
Pivot Low Source: Low price by default.
Left and Right Lengths: Define the number of bars to the left and right for pivot detection.
Colors: Customizable colors for pivot high and low markers.
Options:
Display Settings:
Show HH, LL, LH, HL markers and price labels.
Display support/resistance level extensions.
Option to show levels as a fractal chaos channel.
Enable fractal breakout/down symbols.
Line Connection Mode:
Choose between "All Separate" or "Sequential" for connecting lines.
Line Management:
Set maximum number of lines to display.
Customize line colors, widths, and styles.
Pivot Extension Line:
Visibility: Toggle the display of the last pivot extension line.
Customization: Colors, styles, and width for extension lines.
How It Works - Calculating Pivot Points
Pivot High and Pivot Low Detection:
Pivot High (PH):
Identified when a high price is higher than a specified number of bars to its left and right.
Pivot Low (PL):
Identified when a low price is lower than a specified number of bars to its left and right.
Higher Highs, Lower Highs, Higher Lows, Lower Lows:
Higher High (HH): Current PH is higher than the previous PH.
Lower High (LH): Current PH is lower than the previous PH.
Higher Low (HL): Current PL is higher than the previous PL.
Lower Low (LL): Current PL is lower than the previous PL.
Visual Elements
Markers and Labels:
Shapes:
HH and LH: Downward triangles above the bar.
HL and LL: Upward triangles below the bar.
Labels:
Optionally display the price levels of HH, LH, HL, and LL on the chart.
Support and Resistance Levels:
Extensions:
Lines extending from pivot points to indicate potential support and resistance zones.
Chaos Channels:
Display levels as a fractal chaos channel for enhanced trend analysis.
Fractal Breakout Symbols:
Buy Signals: Upward triangles below the bar.
Sell Signals: Downward triangles above the bar.
Slide 7: Line Connection Modes
All Separate Mode:
Description:
Connects pivot highs with pivot highs and pivot lows with pivot lows separately.
Use Case:
Ideal for traders who want to analyze highs and lows independently.
Sequential Mode:
Description:
Connects all pivot points in the order they occur, regardless of being high or low.
Use Case:
Suitable for identifying overall trend direction and momentum.
Pivot Extension Lines
Purpose:
Trend Continuation:
Visualize the continuation of the latest pivot point's price level.
Customization:
Colors:
Differentiate between bullish and bearish extensions.
Styles:
Solid, dashed, or dotted lines based on user preference.
Width:
Adjustable line thickness for better visibility.
Dynamic Updates:
The extension line updates in real-time as new bars form, providing ongoing trend insights.
Alerts and Notifications
Configurable Alerts:
Fractal Break Arrow:
Triggered when a breakout or breakdown occurs.
Long and Short Signals:
Specific alerts for bullish breakouts (Long) and bearish breakdowns (Short).
Benefits:
Timely Notifications:
Stay informed of critical market movements without constant monitoring.
Automated Trading Strategies:
Integrate with trading bots or automated systems for executing trades based on alerts.
Customization and Optimization
User-Friendly Inputs:
Adjustable Parameters:
Tailor pivot detection sensitivity with left and right lengths.
Color and Style Settings:
Match the indicator aesthetics to personal or platform preferences.
Line Management:
Maximum Lines Displayed:
Prevent chart clutter by limiting the number of lines.
Dynamic Line Handling:
Automatically manage and delete old lines to maintain chart clarity.
Flexibility:
Adapt to Different Markets:
Suitable for various financial instruments including stocks, forex, and cryptocurrencies.
Scalability:
Efficiently handles up to 500 labels and 100 lines for comprehensive analysis.
Practical Use Cases
Identifying Key Support and Resistance:
Entry and Exit Points:
Use pivot levels to determine optimal trade entry and exit points.
Trend Confirmation:
Validate market trends through the connection of pivot points.
Breakout and Breakdown Strategies:
Trading Breakouts:
Enter long positions when price breaks above pivot highs.
Trading Breakdowns:
Enter short positions when price breaks below pivot lows.
Risk Management:
Setting Stop-Loss and Take-Profit Levels:
Utilize pivot levels to place strategic stop-loss and take-profit orders.
Slide 12: Benefits for Traders
Real-Time Analysis:
Provides up-to-date pivot points for timely decision-making.
Enhanced Visualization:
Clear markers and lines improve chart readability and analysis efficiency.
Customizable and Flexible:
Adapt the indicator to fit various trading styles and strategies.
Automated Alerts:
Stay ahead with instant notifications on key market events.
Comprehensive Toolset:
Combines pivot points with fractal analysis for deeper market insights.
Conclusion
Pivot Points LIVE is a robust and versatile indicator designed to enhance your trading strategy through real-time pivot point analysis. With its advanced features, customizable settings, and automated alerts, it equips traders with the tools needed to identify key market levels, execute timely trades, and manage risks effectively.
Ready to Elevate Your Trading?
Explore Pivot Points LIVE and integrate it into your trading toolkit today!
Q&A
Questions?
Feel free to ask any questions or request further demonstrations of the Pivot Points LIVE indicator.

Market Structure Based Stop LossMarket Structure Based Dynamic Stop Loss
Introduction
The Market Structure Based Stop Loss indicator is a strategic tool for traders designed to be useful in both rigorous backtesting and live testing, by providing an objective, “guess-free” stop loss level. This indicator dynamically plots suggested stop loss levels based on market structure, and the concepts of “interim lows/highs.”
It provides a robust framework for managing risk in both long and short positions. By leveraging historical price movements and real time market dynamics, this indicator helps traders identify quantitatively consistent risk levels while optimizing trade returns.
Legend
This indicator utilizes various inputs to customize its functionality, including "Stop Loss Sensitivity" and "Wick Depth," which dictate how closely the stop loss levels hug the price's highs and lows. The stop loss levels are plotted as lines on the trading chart, providing clear visual cues for position management. As seen in the chart below, this indicator dynamically plots stop loss levels for both long and short positions at every point in time.
A “Stop Loss Table” is also included, in order to enhance precision trading and increase backtesting accuracy. It is customizable in both size and positioning.
Case Study
Methodology
The methodology behind this indicator focuses on the precision placement of stop losses using market structure as a guide. It calculates stop losses by identifying the "lowest close" and the corresponding "lowest low" for long setups, and inversely for short setups. By adjusting the sensitivity settings, traders can tweak the indicator's responsiveness to price changes, ensuring that the stop losses are set with a balance between tight risk control and enough room to avoid premature exits due to market noise. The indicator's ability to adapt to different trading styles and time frames makes it an essential tool for traders aiming for efficiency and effectiveness in their risk management strategies.
An important point to make is the fact that the stop loss levels are always placed within the wicks. This is important to avoid what can be described as a “floating stop loss”. A stop loss placed outside of a wick is susceptible to an outsized degree of slippage. This is because traders always cluster their stop losses at high/low wicks, and a stop loss placed outside of this level will inevitably be caught in a low liquidity cascade or “wash-out.” When price approaches a cluster of stop losses, it is highly probable that you will be stopped out anyway, so it is prudent to attempt to be the trader who gets stopped out first in order to avoid high slippage, and losses above what you originally intended.
// For long positions: stop-loss is slightly inside the lowest wick
float dynamic_SL_Long = lowestClose - (lowestClose - lowestLow) * (1 - WickDepth)
// For short positions: stop-loss is slightly inside the highest wick
float dynamic_SL_Short = highestClose + (highestHigh - highestClose) * (1 - WickDepth)
The percentage depth of the wick in which the stop loss is placed is customisable with the “Wick Depth” variable, in order to customize stop loss strategies around the liquidity of the market a trader is executing their orders in.

Wave LineWave Line is a chart type obtained by plotting the High and Low values in each time interval according to their sequential order. This method produces a continuous line rather than bars, which is beneficial for analyzing changes within each interval rather than focusing on the price range and open/close values. E.g for Wave Analysis.
How to use:
1. Adjust the interval unit and multiplier for the main timeframe.
2. Ideally, select a lower timeframe on your chart, approximately 5 times smaller than the one specified for the script.
3. Lower Timeframe is the timeframe which will be the scripts reference when the high and low of the main timeframe align on a single bar of the opened chart. This timeframe may also be 5-10 times smaller than the main timeframe. It is important to note that this should not be excessively smaller as the script may fail in retrieving data. An alternative method is included to estimate the order if it is not clear in the fetched data.
4. Set a preferred value for Monowave Length, indicating the number of bars a monowave will cover horizontally. Set the value to be half of the Interval Multiplier for the Wave Line to align with the bar chart. However if the multiplier is an odd number, perfect alignment may not be achieved.
5. Ensure that the product of Max Polyline Segments and Monowave length does not exceed 5000, and adjust the value for Max Polyline Segments accordingly.
