Buyside & Sellside Liquidity [LuxAlgo]The Buyside & Sellside Liquidity indicator aims to detect & highlight the first and arguably most important concept within the ICT trading methodology, Liquidity levels.
🔶 SETTINGS
🔹 Liquidity Levels
Detection Length: Lookback period
Margin: Sets margin/sensitivity for a liquidity level detection
🔹 Liquidity Zones
Buyside Liquidity Zones: Enables display of the buyside liquidity zones.
Margin: Sets margin/sensitivity for the liquidity zone boundaries.
Color: Color option for buyside liquidity levels & zones.
Sellside Liquidity Zones: Enables display of the sellside liquidity zones.
Margin: Sets margin/sensitivity for the liquidity zone boundaries.
Color: Color option for sellside liquidity levels & zones.
🔹 Liquidity Voids
Liquidity Voids: Enables display of both bullish and bearish liquidity voids.
Label: Enables display of a label indicating liquidity voids.
🔹 Display Options
Mode: Controls the lookback length of detection and visualization, where Present assumes last 500 bars and Historical assumes all data available to the user
# Visible Levels: Controls the amount of the liquidity levels/zones to be visualized.
🔶 USAGE
Definitions of Liquidity refer to the availability of orders at specific price levels in the market, allowing transactions to occur smoothly.
In the context of Inner Circle Trader's teachings, liquidity mainly relates to stop losses or pending orders and liquidity level/pool, highlighting a concentration of buy or sell orders at specific price levels. Smart money traders, such as banks and other large institutions, often target these liquidity levels/pools to accumulate or distribute their positions.
There are two types of liquidity; Buyside liquidity and Sellside liquidity .
Buyside liquidity represents a level on the chart where short sellers will have their stops positioned, and Sellside liquidity represents a level on the chart where long-biased traders will place their stops.
These areas often act as support or resistance levels and can provide trading opportunities.
When the liquidity levels are breached at which many stop/limit orders are placed have been traded through, the script will create a zone aiming to provide additional insight to figure out the odds of the next price action.
Reversal: It’s common that the price may reverse course and head in the opposite direction, seeking liquidity at the opposite extreme.
Continuation: When the zone is also broken it is a sign for continuation price action.
It's worth noting that ICT concepts are specific to the methodology developed by Michael J. Huddleston and may not align with other trading approaches or strategies.
🔶 DETAILS
Liquidity voids are sudden changes in price when the price jumps from one level to another. Liquidity voids will appear as a single or a group of candles that are all positioned in the same direction. These candles typically have large real bodies and very short wicks, suggesting very little disagreement between buyers and sellers. The peculiar thing about liquidity voids is that they almost always fill up.
🔶 ALERTS
When an alert is configured, the user will have the ability to be notified in case;
Liquidity level is detected/updated.
Liquidity level is breached.
🔶 RELATED SCRIPTS
ICT-Concepts
ICT-Macros
Imbalance-Detector
Cari dalam skrip untuk "order"

FinandyHookLibLibrary "FinandyHookLib"
TODO: add library description here
createOrderJson(model, hook_secret, options)
Parameters:
model (orderModel type from Hamster-Coder/OrderLib/7)
hook_secret (string)
options (textFormatOptions)
textFormatOptions
Fields:
price_format (series__string)
percent_format (series__string)
Buying/Selling Pressure Cycle (PreCy)No lag estimation of the buying/selling pressure for each candle.
----------------------------------------------------------------------------------------------------
WHY PreCY?
How much bearish pressure is there behind a group of bullish candles ?
Is this bearish pressure increasing?
When might it overcome the bullish pressure?
Those were my questions when I started this indicator. It lead me through the rabbit hole, where I discovered some secrets about the market. So I pushed deeper, and developped it a lot more, in order to understand what is really happening "behind the scene".
There are now 3 ways to read this indicator. It might look complicated at first, but the reward is to be able to anticipate and understand a lot more.
You can show/hide all the plots in the settings. So you can choose the way you prefer to use it.
----------------------------------------------------------------------------------------------------
FIRST WAY TO READ PreCy : The SIGNAL line
Go in the settings of PreCy, in "DISPLAY", uncheck "The pivot lines of the SIGNAL" and "The CYCLE areas". Make sure "The SIGNAL line" is checked.
The SIGNAL shows an estimation of the buying/selling pressure of each candle, going from 100 (100% bullish candle) to -100 (100% bearish candle). A doji would be shown close to zero.
Formula: Estimated % of buying pressure - Estimated % of selling pressure
It is a very choppy line in general, but its colors help make sense of it.
When this choppiness alternates between the extremes, then there is not much pressure on each candle, and it's very unpredictable.
When the pressure increases, the SIGNAL's amplitude changes. It "compresses", meaning there is some interest in the market. It can compress by alternating above and below zero, or it can stay above zero (bullish), or below zero (bearish) for a while.
When the SIGNAL becomes linear (in opposition to choppy), there is a lot of pressure, and it is directional. The participants agree for a move in a chosen direction.
The trajectory of the SIGNAL can help anticipate when a move is going to happen (directional increase of pressure), or stop (returning to zero) and possibly reverse (crossing zero).
Advanced uses:
The SIGNAL can make more sense on a specific timeframe, that would be aligned with the frequency of the orders at that moment. So it is a good idea to switch between timeframes until it gets less choppy, and more directional.
It is interesting to follow any regular progression of the SIGNAL, as it can reveal the intentions of the market makers to go in a certain direction discretely. There can be almost no volume and no move in the price action, yet the SIGNAL gets linear and moves away from one extreme, slowly crosses the zeroline, and pushes to the other extreme at the same time as the amplitude of the price action increases drastically.
----------------------------------------------------------------------------------------------------
SECOND WAY TO READ PreCy : The PIVOTS of the SIGNAL line
Go in the settings of PreCy, in "DISPLAY", and uncheck "The CYCLE areas". Make sure "The SIGNAL line" and "The pivot lines of the SIGNAL" are checked.
The PIVOTS help make sense of the apparent chaos of the SIGNAL. They can reveal the overall direction of the choppy moves.
Especially when the 2 PIVOTS lines are parallel and oriented.
----------------------------------------------------------------------------------------------------
THIRD WAY TO READ PreCy : The CYCLE
Go in the settings of PreCy, in "DISPLAY", and uncheck "The SIGNAL line" and "The pivot lines of the SIGNAL". Make sure "The CYCLE areas" is checked.
The CYCLE is a Moving Average of the SIGNAL in relation to each candle's size.
Formula: 6 periods Moving Average of the SIGNAL * (body of the current candle / 200 periods Moving Average of the candle's bodies)
The result goes from 200 to -200.
The CYCLE shows longer term indications of the pressures of the market.
Analysing the trajectory of the CYCLE can help predict the direction of the price.
When the CYCLE goes above or below the gray low intensity zone, it signals some interest in the move.
When the CYCLE stays above 100 or below -100, it is a sign of strength in the move.
When it stayed out of the gray low intensity zone, then returns inside it, it is a strong signal of a probable change of behavior.
----------------------------------------------------------------------------------------------------
ALERTS
In the settings, you can pick the alerts you're interested in.
To activate them, right click on the chart (or alt+a), choose "Add alert on Buying/Selling Pressure Cycle (PreCy)" then "Any alert()", then "Create".
Feel free to activate them on different timeframes. The alerts show which timeframe they are from (ex: "TF:15" for the 15 minutes TF).
I have added a lot more conditions to my PreCy, taken from FREMA Trend, for ex. You can do the same with your favorite scripts, to make PreCy more accurate for your style.
----------------------------------------------------------------------------------------------------
Borrowed scripts:
To estimate the buying and selling pressures, PreCy uses the wicks calculations of "Volume net histogram" by RafaelZioni
To filter the alerts, PreCy uses the calculations of "Amplitude" by Koholintian:
----------------------------------------------------------------------------------------------------
DO NOT BASE YOUR TRADING DECISIONS ON 1 SINGLE INDICATOR'S SIGNALS.
Always confirm your ideas by other means, like price action and indicators of a different nature.

Triple Top Patterns [theEccentricTrader]█ OVERVIEW
This indicator automatically draws triple top patterns and price projections derived from the ranges that constitute the patterns.
█ CONCEPTS
Green and Red Candles
• A green candle is one that closes with a close price equal to or above the price it opened.
• A red candle is one that closes with a close price that is lower than the price it opened.
Swing Highs and Swing Lows
• A swing high is a green candle or series of consecutive green candles followed by a single red candle to complete the swing and form the peak.
• A swing low is a red candle or series of consecutive red candles followed by a single green candle to complete the swing and form the trough.
Peak and Trough Prices (Basic)
• The peak price of a complete swing high is the high price of either the red candle that completes the swing high or the high price of the preceding green candle, depending on which is higher.
• The trough price of a complete swing low is the low price of either the green candle that completes the swing low or the low price of the preceding red candle, depending on which is lower.
Historic Peaks and Troughs
The current, or most recent, peak and trough occurrences are referred to as occurrence zero. Previous peak and trough occurrences are referred to as historic and ordered numerically from right to left, with the most recent historic peak and trough occurrences being occurrence one.
Broken and Unbroken Peaks and Troughs
Upon the completion of a new swing low the high of the green candle that completes the swing low will be above, below or equal to the current peak price. And similarly, upon the completion of a new swing high the low of the red candle that completes the swing high will be above, below or equal to the current trough price.
If the high price of the green candle that completes the current swing low is higher than or equal to the current peak price then the current peak is broken. If the high of the green candle that completes the current swing low is below the current peak price, then the current peak is unbroken.
Similarly, if the low price of the red candle that completes the current swing high is lower than or equal to the current trough price then the current trough is broken. If the low price of the red candle that completes the current swing high is above the current trough price, then the current trough is unbroken.
Range
The range is simply the difference between the current peak and current trough prices, generally expressed in terms of points or pips.
Retracement and Extension Ratios
Retracement and extension ratios are calculated by dividing the current range by the preceding range and multiplying the answer by 100. Retracement ratios are those that are equal to or below 100% of the preceding range and extension ratios are those that are above 100% of the preceding range.
Triple Bottom and Triple Top Patterns
• Triple bottom patterns are composed of two peaks and three troughs, with the second and third troughs being roughly equal to the first trough.
• Triple top patterns are composed of two troughs and three peaks, with the second and third peaks being roughly equal to the first peak.
Measurement Tolerances
In general, tolerance in measurements refers to the allowable variation or deviation from a specific value or dimension. It is the range within which a particular measurement is considered to be acceptable or accurate. In this script I have applied this concept to the measurement of triple bottom and triple top patterns to increase to the frequency of pattern occurrences.
For example, a perfect triple bottom is very rare. We can increase the frequency of pattern occurrences by setting a tolerance. A ratio tolerance of 10% to both downside and upside, which is the default setting, means we would have a tolerable ratio measurement range between 90-110% for the second and third troughs as ratios of the first trough, thus increasing the frequency of occurrence.
█ FEATURES
Inputs
• Unbroken Troughs
• Lower Tolerance
• Upper Tolerance
• Pattern Color
• Neckline Color
• Extend Current Neckline
• Show Labels
• Label Color
• Show Projection Lines
• Extend Current Projection Lines
Alerts
Users can set alerts for when the patterns occur.
█ LIMITATIONS
All green and red candle calculations are based on differences between open and close prices, as such I have made no attempt to account for green candles that gap lower and close below the close price of the preceding candle, or red candles that gap higher and close above the close price of the preceding candle. This may cause some unexpected behaviour on some markets and timeframes. I can only recommend using 24-hour markets, if and where possible, as there are far fewer gaps and, generally, more data to work with.

Triple Bottom Patterns [theEccentricTrader]█ OVERVIEW
This indicator automatically draws triple bottom patterns and price projections derived from the ranges that constitute the patterns.
█ CONCEPTS
Green and Red Candles
• A green candle is one that closes with a close price equal to or above the price it opened.
• A red candle is one that closes with a close price that is lower than the price it opened.
Swing Highs and Swing Lows
• A swing high is a green candle or series of consecutive green candles followed by a single red candle to complete the swing and form the peak.
• A swing low is a red candle or series of consecutive red candles followed by a single green candle to complete the swing and form the trough.
Peak and Trough Prices (Basic)
• The peak price of a complete swing high is the high price of either the red candle that completes the swing high or the high price of the preceding green candle, depending on which is higher.
• The trough price of a complete swing low is the low price of either the green candle that completes the swing low or the low price of the preceding red candle, depending on which is lower.
Historic Peaks and Troughs
The current, or most recent, peak and trough occurrences are referred to as occurrence zero. Previous peak and trough occurrences are referred to as historic and ordered numerically from right to left, with the most recent historic peak and trough occurrences being occurrence one.
Broken and Unbroken Peaks and Troughs
Upon the completion of a new swing low the high of the green candle that completes the swing low will be above, below or equal to the current peak price. And similarly, upon the completion of a new swing high the low of the red candle that completes the swing high will be above, below or equal to the current trough price.
If the high price of the green candle that completes the current swing low is higher than or equal to the current peak price then the current peak is broken. If the high of the green candle that completes the current swing low is below the current peak price, then the current peak is unbroken.
Similarly, if the low price of the red candle that completes the current swing high is lower than or equal to the current trough price then the current trough is broken. If the low price of the red candle that completes the current swing high is above the current trough price, then the current trough is unbroken.
Range
The range is simply the difference between the current peak and current trough prices, generally expressed in terms of points or pips.
Retracement and Extension Ratios
Retracement and extension ratios are calculated by dividing the current range by the preceding range and multiplying the answer by 100. Retracement ratios are those that are equal to or below 100% of the preceding range and extension ratios are those that are above 100% of the preceding range.
Triple Bottom and Triple Top Patterns
• Triple bottom patterns are composed of two peaks and three troughs, with the second and third troughs being roughly equal to the first trough.
• Triple top patterns are composed of two troughs and three peaks, with the second and third peaks being roughly equal to the first peak.
Measurement Tolerances
In general, tolerance in measurements refers to the allowable variation or deviation from a specific value or dimension. It is the range within which a particular measurement is considered to be acceptable or accurate. In this script I have applied this concept to the measurement of triple bottom and triple top patterns to increase to the frequency of pattern occurrences.
For example, a perfect triple bottom is very rare. We can increase the frequency of pattern occurrences by setting a tolerance. A ratio tolerance of 10% to both downside and upside, which is the default setting, means we would have a tolerable ratio measurement range between 90-110% for the second and third troughs as ratios of the first trough, thus increasing the frequency of occurrence.
█ FEATURES
Inputs
• Unbroken Peaks
• Lower Tolerance
• Upper Tolerance
• Pattern Color
• Neckline Color
• Extend Current Neckline
• Show Labels
• Label Color
• Show Projection Lines
• Extend Current Projection Lines
Alerts
Users can set alerts for when the patterns occur.
█ LIMITATIONS
All green and red candle calculations are based on differences between open and close prices, as such I have made no attempt to account for green candles that gap lower and close below the close price of the preceding candle, or red candles that gap higher and close above the close price of the preceding candle. This may cause some unexpected behaviour on some markets and timeframes. I can only recommend using 24-hour markets, if and where possible, as there are far fewer gaps and, generally, more data to work with.

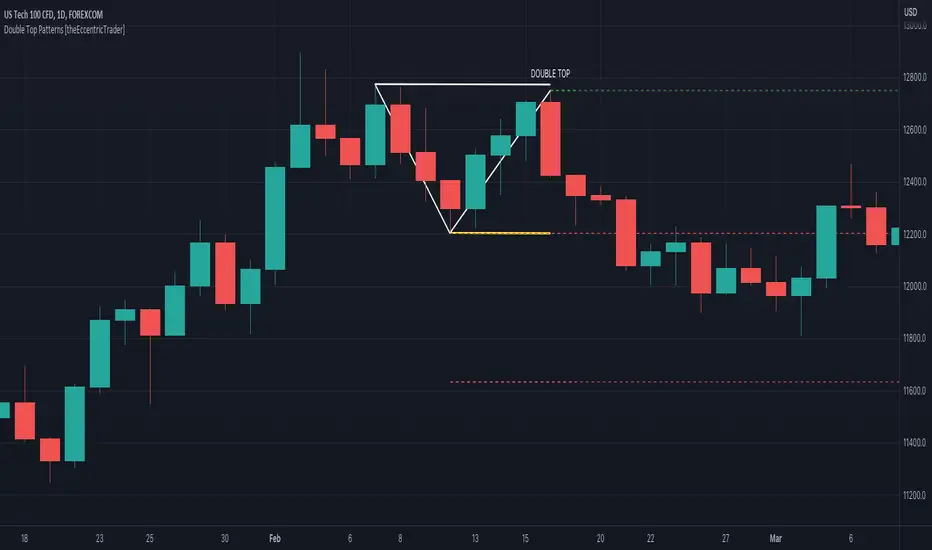
Double Top Patterns [theEccentricTrader]█ OVERVIEW
This indicator automatically draws double top patterns and price projections derived from the ranges that constitute the patterns.
█ CONCEPTS
Green and Red Candles
• A green candle is one that closes with a close price equal to or above the price it opened.
• A red candle is one that closes with a close price that is lower than the price it opened.
Swing Highs and Swing Lows
• A swing high is a green candle or series of consecutive green candles followed by a single red candle to complete the swing and form the peak.
• A swing low is a red candle or series of consecutive red candles followed by a single green candle to complete the swing and form the trough.
Peak and Trough Prices (Basic)
• The peak price of a complete swing high is the high price of either the red candle that completes the swing high or the high price of the preceding green candle, depending on which is higher.
• The trough price of a complete swing low is the low price of either the green candle that completes the swing low or the low price of the preceding red candle, depending on which is lower.
Historic Peaks and Troughs
The current, or most recent, peak and trough occurrences are referred to as occurrence zero. Previous peak and trough occurrences are referred to as historic and ordered numerically from right to left, with the most recent historic peak and trough occurrences being occurrence one.
Broken and Unbroken Peaks and Troughs
Upon the completion of a new swing low the high of the green candle that completes the swing low will be above, below or equal to the current peak price. And similarly, upon the completion of a new swing high the low of the red candle that completes the swing high will be above, below or equal to the current trough price.
If the high price of the green candle that completes the current swing low is higher than or equal to the current peak price then the current peak is broken. If the high of the green candle that completes the current swing low is below the current peak price, then the current peak is unbroken.
Similarly, if the low price of the red candle that completes the current swing high is lower than or equal to the current trough price then the current trough is broken. If the low price of the red candle that completes the current swing high is above the current trough price, then the current trough is unbroken.
Range
The range is simply the difference between the current peak and current trough prices, generally expressed in terms of points or pips.
Retracement and Extension Ratios
Retracement and extension ratios are calculated by dividing the current range by the preceding range and multiplying the answer by 100. Retracement ratios are those that are equal to or below 100% of the preceding range and extension ratios are those that are above 100% of the preceding range.
Double Bottom and Double Top Patterns
• Double bottom patterns are composed of one peak and two troughs, with the second trough being roughly equal to the first trough.
• Double top patterns are composed of one trough and two peaks, with the second peak being roughly equal to the first peak.
Measurement Tolerances
In general, tolerance in measurements refers to the allowable variation or deviation from a specific value or dimension. It is the range within which a particular measurement is considered to be acceptable or accurate. In this script I have applied this concept to the measurement of double bottom and double top patterns to increase to the frequency of pattern occurrences.
For example, a perfect double bottom is very rare. We can increase the frequency of pattern occurrences by setting a tolerance. A ratio tolerance of 10% to both downside and upside, which is the default setting, means we would have a tolerable ratio measurement range between 90-110% for the second trough, thus increasing the frequency of occurrence.
█ FEATURES
Inputs
• Unbroken Troughs
• Lower Tolerance
• Upper Tolerance
• Pattern Color
• Neckline Color
• Extend Current Neckline
• Show Labels
• Label Color
• Show Projection Lines
• Extend Current Projection Lines
Alerts
Users can set alerts for when the patterns occur.
█ LIMITATIONS
All green and red candle calculations are based on differences between open and close prices, as such I have made no attempt to account for green candles that gap lower and close below the close price of the preceding candle, or red candles that gap higher and close above the close price of the preceding candle. This may cause some unexpected behaviour on some markets and timeframes. I can only recommend using 24-hour markets, if and where possible, as there are far fewer gaps and, generally, more data to work with.
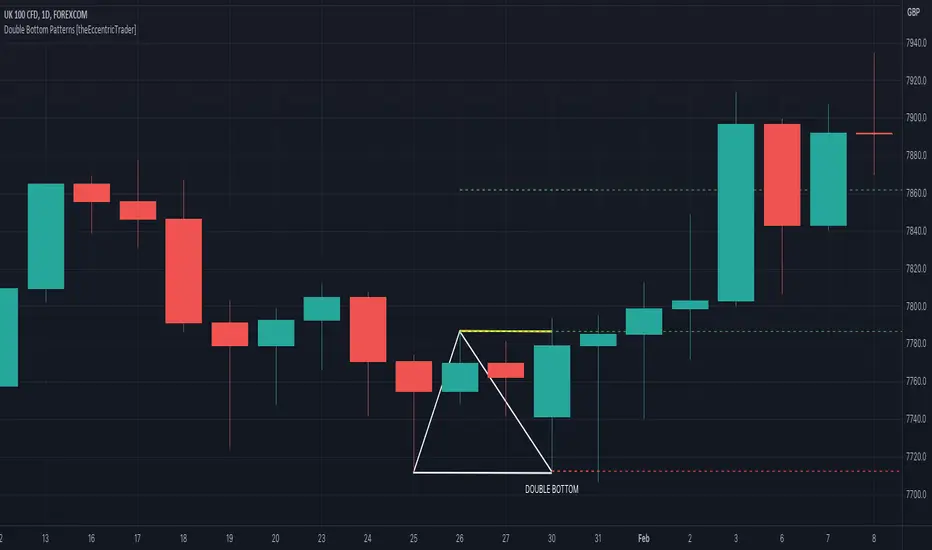
Double Bottom Patterns [theEccentricTrader]█ OVERVIEW
This indicator automatically draws double bottom patterns and price projections derived from the ranges that constitute the patterns.
█ CONCEPTS
Green and Red Candles
• A green candle is one that closes with a close price equal to or above the price it opened.
• A red candle is one that closes with a close price that is lower than the price it opened.
Swing Highs and Swing Lows
• A swing high is a green candle or series of consecutive green candles followed by a single red candle to complete the swing and form the peak.
• A swing low is a red candle or series of consecutive red candles followed by a single green candle to complete the swing and form the trough.
Peak and Trough Prices (Basic)
• The peak price of a complete swing high is the high price of either the red candle that completes the swing high or the high price of the preceding green candle, depending on which is higher.
• The trough price of a complete swing low is the low price of either the green candle that completes the swing low or the low price of the preceding red candle, depending on which is lower.
Historic Peaks and Troughs
The current, or most recent, peak and trough occurrences are referred to as occurrence zero. Previous peak and trough occurrences are referred to as historic and ordered numerically from right to left, with the most recent historic peak and trough occurrences being occurrence one.
Broken and Unbroken Peaks and Troughs
Upon the completion of a new swing low the high of the green candle that completes the swing low will be above, below or equal to the current peak price. And similarly, upon the completion of a new swing high the low of the red candle that completes the swing high will be above, below or equal to the current trough price.
If the high price of the green candle that completes the current swing low is higher than or equal to the current peak price then the current peak is broken. If the high of the green candle that completes the current swing low is below the current peak price, then the current peak is unbroken.
Similarly, if the low price of the red candle that completes the current swing high is lower than or equal to the current trough price then the current trough is broken. If the low price of the red candle that completes the current swing high is above the current trough price, then the current trough is unbroken.
Range
The range is simply the difference between the current peak and current trough prices, generally expressed in terms of points or pips.
Retracement and Extension Ratios
Retracement and extension ratios are calculated by dividing the current range by the preceding range and multiplying the answer by 100. Retracement ratios are those that are equal to or below 100% of the preceding range and extension ratios are those that are above 100% of the preceding range.
Double Bottom and Double Top Patterns
• Double bottom patterns are composed of one peak and two troughs, with the second trough being roughly equal to the first trough.
• Double top patterns are composed of one trough and two peaks, with the second peak being roughly equal to the first peak.
Measurement Tolerances
In general, tolerance in measurements refers to the allowable variation or deviation from a specific value or dimension. It is the range within which a particular measurement is considered to be acceptable or accurate. In this script I have applied this concept to the measurement of double bottom and double top patterns to increase to the frequency of pattern occurrences.
For example, a perfect double bottom is very rare. We can increase the frequency of pattern occurrences by setting a tolerance. A ratio tolerance of 10% to both downside and upside, which is the default setting, means we would have a tolerable ratio measurement range between 90-110% for the second trough, thus increasing the frequency of occurrence.
█ FEATURES
Inputs
• Unbroken Peaks
• Lower Tolerance
• Upper Tolerance
• Pattern Color
• Neckline Color
• Extend Current Neckline
• Show Labels
• Label Color
• Show Projection Lines
• Extend Current Projection Lines
Alerts
Users can set alerts for when the patterns occur.
█ LIMITATIONS
All green and red candle calculations are based on differences between open and close prices, as such I have made no attempt to account for green candles that gap lower and close below the close price of the preceding candle, or red candles that gap higher and close above the close price of the preceding candle. This may cause some unexpected behaviour on some markets and timeframes. I can only recommend using 24-hour markets, if and where possible, as there are far fewer gaps and, generally, more data to work with.
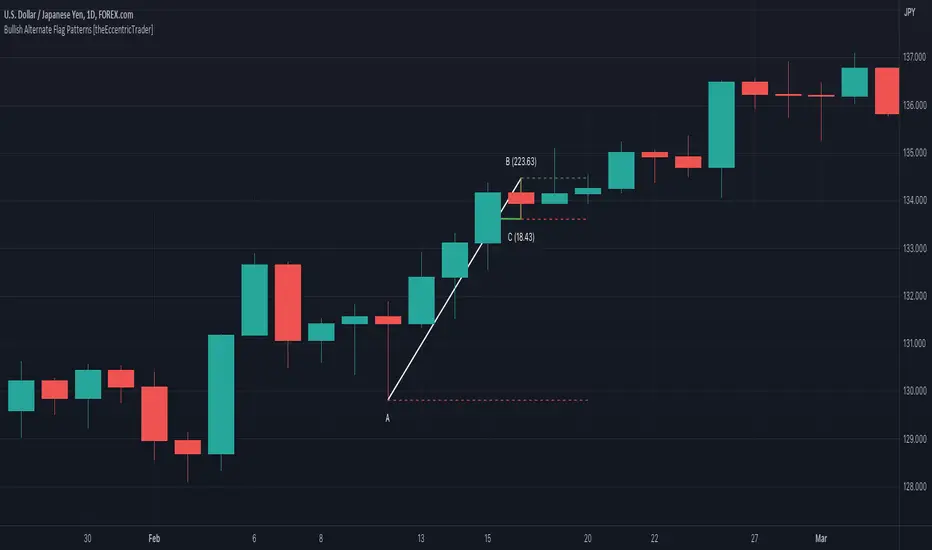
Bearish Alternate Flag Patterns [theEccentricTrader]█ OVERVIEW
This indicator automatically draws bearish alternate flag patterns and price projections derived from the ranges that constitute the patterns.
█ CONCEPTS
Green and Red Candles
• A green candle is one that closes with a close price equal to or above the price it opened.
• A red candle is one that closes with a close price that is lower than the price it opened.
Swing Highs and Swing Lows
• A swing high is a green candle or series of consecutive green candles followed by a single red candle to complete the swing and form the peak.
• A swing low is a red candle or series of consecutive red candles followed by a single green candle to complete the swing and form the trough.
Peak and Trough Prices (Basic)
• The peak price of a complete swing high is the high price of either the red candle that completes the swing high or the high price of the preceding green candle, depending on which is higher.
• The trough price of a complete swing low is the low price of either the green candle that completes the swing low or the low price of the preceding red candle, depending on which is lower.
Historic Peaks and Troughs
The current, or most recent, peak and trough occurrences are referred to as occurrence zero. Previous peak and trough occurrences are referred to as historic and ordered numerically from right to left, with the most recent historic peak and trough occurrences being occurrence one.
Broken and Unbroken Peaks and Troughs
Upon the completion of a new swing low the high of the green candle that completes the swing low will be above, below or equal to the current peak price. And similarly, upon the completion of a new swing high the low of the red candle that completes the swing high will be above, below or equal to the current trough price.
If the high price of the green candle that completes the current swing low is higher than or equal to the current peak price then the current peak is broken. If the high of the green candle that completes the current swing low is below the current peak price, then the current peak is unbroken.
Similarly, if the low price of the red candle that completes the current swing high is lower than or equal to the current trough price then the current trough is broken. If the low price of the red candle that completes the current swing high is above the current trough price, then the current trough is unbroken.
Range
The range is simply the difference between the current peak and current trough prices, generally expressed in terms of points or pips.
Upper Trends
• A return line uptrend is formed when the current peak price is higher than the preceding peak price.
• A downtrend is formed when the current peak price is lower than the preceding peak price.
• A double-top is formed when the current peak price is equal to the preceding peak price.
Lower Trends
• An uptrend is formed when the current trough price is higher than the preceding trough price.
• A return line downtrend is formed when the current trough price is lower than the preceding trough price.
• A double-bottom is formed when the current trough price is equal to the preceding trough price.
Wave Cycles
A wave cycle is here defined as a complete two-part move between a swing high and a swing low, or a swing low and a swing high. The first swing high or swing low will set the course for the sequence of wave cycles that follow; for example a chart that begins with a swing low will form its first complete wave cycle upon the formation of the first complete swing high and vice versa.
Figure 1.
Retracement and Extension Ratios
Retracement and extension ratios are calculated by dividing the current range by the preceding range and multiplying the answer by 100. Retracement ratios are those that are equal to or below 100% of the preceding range and extension ratios are those that are above 100% of the preceding range.
Bullish and Bearish Alternate Flag Patterns
• Bullish alternate flags are composed of one peak and two troughs. The second trough being higher than the first.
• Bearish alternate flags are composed of one trough and two peaks. The second peak being lower than the first.
In this script I have used minimum and maximum retracement and extension ratios to set parameters for pattern identification:
• Wave 1 of the pattern, referred to as AB, is set to a minimum ratio of 100%.
• Wave 2 of the pattern, referred to as BC, is set to a maximum ratio of 30%.
█ FEATURES
Inputs
• Unbroken Troughs
• AB Minimum Ratio
• BC Maximum Ratio
• Pole Color
• Flag Color
• Extend Current Flag Lines
• Show Labels
• Label Color
• Show Projection Lines
• Extend Current Projection Lines
Alerts
Users can set alerts for when the patterns occur.
█ LIMITATIONS
All green and red candle calculations are based on differences between open and close prices, as such I have made no attempt to account for green candles that gap lower and close below the close price of the preceding candle, or red candles that gap higher and close above the close price of the preceding candle. This may cause some unexpected behaviour on some markets and timeframes. I can only recommend using 24-hour markets, if and where possible, as there are far fewer gaps and, generally, more data to work with.

Bullish Alternate Flag Patterns [theEccentricTrader]█ OVERVIEW
This indicator automatically draws bullish alternate flag patterns and price projections derived from the ranges that constitute the patterns.
█ CONCEPTS
Green and Red Candles
• A green candle is one that closes with a close price equal to or above the price it opened.
• A red candle is one that closes with a close price that is lower than the price it opened.
Swing Highs and Swing Lows
• A swing high is a green candle or series of consecutive green candles followed by a single red candle to complete the swing and form the peak.
• A swing low is a red candle or series of consecutive red candles followed by a single green candle to complete the swing and form the trough.
Peak and Trough Prices (Basic)
• The peak price of a complete swing high is the high price of either the red candle that completes the swing high or the high price of the preceding green candle, depending on which is higher.
• The trough price of a complete swing low is the low price of either the green candle that completes the swing low or the low price of the preceding red candle, depending on which is lower.
Historic Peaks and Troughs
The current, or most recent, peak and trough occurrences are referred to as occurrence zero. Previous peak and trough occurrences are referred to as historic and ordered numerically from right to left, with the most recent historic peak and trough occurrences being occurrence one.
Broken and Unbroken Peaks and Troughs
Upon the completion of a new swing low the high of the green candle that completes the swing low will be above, below or equal to the current peak price. And similarly, upon the completion of a new swing high the low of the red candle that completes the swing high will be above, below or equal to the current trough price.
If the high price of the green candle that completes the current swing low is higher than or equal to the current peak price then the current peak is broken. If the high of the green candle that completes the current swing low is below the current peak price, then the current peak is unbroken.
Similarly, if the low price of the red candle that completes the current swing high is lower than or equal to the current trough price then the current trough is broken. If the low price of the red candle that completes the current swing high is above the current trough price, then the current trough is unbroken.
Range
The range is simply the difference between the current peak and current trough prices, generally expressed in terms of points or pips.
Upper Trends
• A return line uptrend is formed when the current peak price is higher than the preceding peak price.
• A downtrend is formed when the current peak price is lower than the preceding peak price.
• A double-top is formed when the current peak price is equal to the preceding peak price.
Lower Trends
• An uptrend is formed when the current trough price is higher than the preceding trough price.
• A return line downtrend is formed when the current trough price is lower than the preceding trough price.
• A double-bottom is formed when the current trough price is equal to the preceding trough price.
Wave Cycles
A wave cycle is here defined as a complete two-part move between a swing high and a swing low, or a swing low and a swing high. The first swing high or swing low will set the course for the sequence of wave cycles that follow; for example a chart that begins with a swing low will form its first complete wave cycle upon the formation of the first complete swing high and vice versa.
Figure 1.
Retracement and Extension Ratios
Retracement and extension ratios are calculated by dividing the current range by the preceding range and multiplying the answer by 100. Retracement ratios are those that are equal to or below 100% of the preceding range and extension ratios are those that are above 100% of the preceding range.
Bullish and Bearish Alternate Flag Patterns
• Bullish alternate flags are composed of one peak and two troughs. The second trough being higher than the first.
• Bearish alternate flags are composed of one trough and two peaks. The second peak being lower than the first.
In this script I have used minimum and maximum retracement and extension ratios to set parameters for pattern identification:
• Wave 1 of the pattern, referred to as AB, is set to a minimum ratio of 100%.
• Wave 2 of the pattern, referred to as BC, is set to a maximum ratio of 30%.
█ FEATURES
Inputs
• Unbroken Peaks
• AB Minimum Ratio
• BC Maximum Ratio
• Pole Color
• Flag Color
• Extend Current Flag Lines
• Show Labels
• Label Color
• Show Projection Lines
• Extend Current Projection Lines
Alerts
Users can set alerts for when the patterns occur.
█ LIMITATIONS
All green and red candle calculations are based on differences between open and close prices, as such I have made no attempt to account for green candles that gap lower and close below the close price of the preceding candle, or red candles that gap higher and close above the close price of the preceding candle. This may cause some unexpected behaviour on some markets and timeframes. I can only recommend using 24-hour markets, if and where possible, as there are far fewer gaps and, generally, more data to work with.
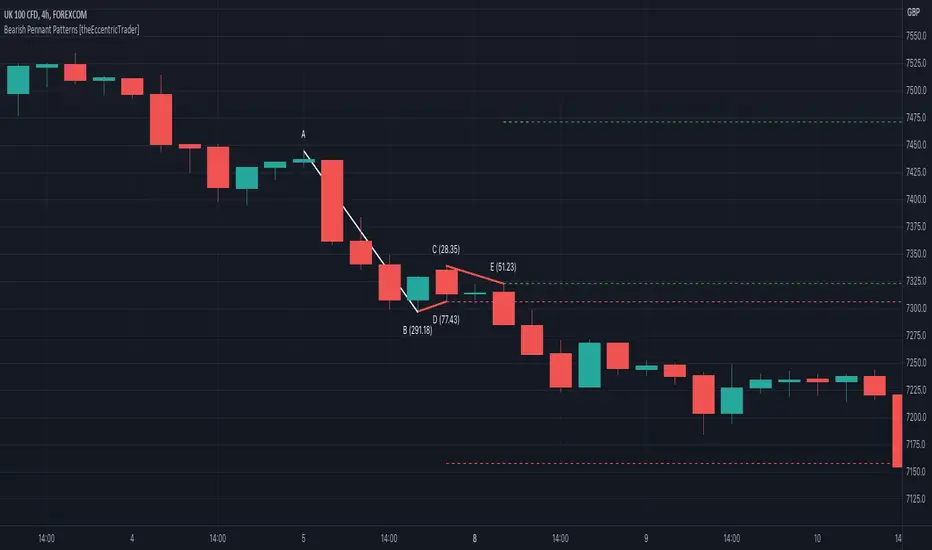
Bearish Pennant Patterns [theEccentricTrader]█ OVERVIEW
This indicator automatically draws bearish pennant patterns and price projections derived from the ranges that constitute the patterns.
█ CONCEPTS
Green and Red Candles
• A green candle is one that closes with a close price equal to or above the price it opened.
• A red candle is one that closes with a close price that is lower than the price it opened.
Swing Highs and Swing Lows
• A swing high is a green candle or series of consecutive green candles followed by a single red candle to complete the swing and form the peak.
• A swing low is a red candle or series of consecutive red candles followed by a single green candle to complete the swing and form the trough.
Peak and Trough Prices (Basic)
• The peak price of a complete swing high is the high price of either the red candle that completes the swing high or the high price of the preceding green candle, depending on which is higher.
• The trough price of a complete swing low is the low price of either the green candle that completes the swing low or the low price of the preceding red candle, depending on which is lower.
Historic Peaks and Troughs
The current, or most recent, peak and trough occurrences are referred to as occurrence zero. Previous peak and trough occurrences are referred to as historic and ordered numerically from right to left, with the most recent historic peak and trough occurrences being occurrence one.
Broken and Unbroken Peaks and Troughs
Upon the completion of a new swing low the high of the green candle that completes the swing low will be above, below or equal to the current peak price. And similarly, upon the completion of a new swing high the low of the red candle that completes the swing high will be above, below or equal to the current trough price.
If the high price of the green candle that completes the current swing low is higher than or equal to the current peak price then the current peak is broken. If the high of the green candle that completes the current swing low is below the current peak price, then the current peak is unbroken.
Similarly, if the low price of the red candle that completes the current swing high is lower than or equal to the current trough price then the current trough is broken. If the low price of the red candle that completes the current swing high is above the current trough price, then the current trough is unbroken.
Range
The range is simply the difference between the current peak and current trough prices, generally expressed in terms of points or pips.
Upper Trends
• A return line uptrend is formed when the current peak price is higher than the preceding peak price.
• A downtrend is formed when the current peak price is lower than the preceding peak price.
• A double-top is formed when the current peak price is equal to the preceding peak price.
Lower Trends
• An uptrend is formed when the current trough price is higher than the preceding trough price.
• A return line downtrend is formed when the current trough price is lower than the preceding trough price.
• A double-bottom is formed when the current trough price is equal to the preceding trough price.
Wave Cycles
A wave cycle is here defined as a complete two-part move between a swing high and a swing low, or a swing low and a swing high. The first swing high or swing low will set the course for the sequence of wave cycles that follow; for example a chart that begins with a swing low will form its first complete wave cycle upon the formation of the first complete swing high and vice versa.
Figure 1.
Retracement and Extension Ratios
Retracement and extension ratios are calculated by dividing the current range by the preceding range and multiplying the answer by 100. Retracement ratios are those that are equal to or below 100% of the preceding range and extension ratios are those that are above 100% of the preceding range.
Bullish and Bearish Pennant Patterns
• Bullish pennants are generally composed of three troughs and two peaks. The first peak being higher than the second peak and the first trough being lower than both the second and third troughs, with the third trough being higher than the second trough.
• Bearish pennants are generally composed of three peaks and two troughs. The first trough being lower than the second trough and the first peak being higher than both the second and third peaks, with third peak being lower than the second peak.
In this script I have used minimum and maximum retracement and extension ratios to set parameters for pattern identification:
• Wave 1 of the pattern, referred to as AB, is set to a minimum ratio of 100%.
• Wave 2 of the pattern, referred to as BC, is set to a maximum ratio of 30%.
• Wave 3 of the pattern, referred to as CD, has no ratio measurements but will always be below 100% by default.
• Wave 4 of the pattern, referred to as DE, has no ratio measurements but will always be below 100% by default.
█ FEATURES
Inputs
• Unbroken Troughs
• AB Minimum Ratio
• BC Maximum Ratio
• Pole Color
• Flag Color
• Extend Current Flag Lines
• Show Labels
• Label Color
• Show Projection Lines
• Extend Current Projection Lines
Alerts
Users can set alerts for when the patterns occur.
█ LIMITATIONS
All green and red candle calculations are based on differences between open and close prices, as such I have made no attempt to account for green candles that gap lower and close below the close price of the preceding candle, or red candles that gap higher and close above the close price of the preceding candle. This may cause some unexpected behaviour on some markets and timeframes. I can only recommend using 24-hour markets, if and where possible, as there are far fewer gaps and, generally, more data to work with.
Bullish Pennant Patterns [theEccentricTrader]█ OVERVIEW
This indicator automatically draws bullish pennant patterns and price projections derived from the ranges that constitute the patterns.
█ CONCEPTS
Green and Red Candles
• A green candle is one that closes with a close price equal to or above the price it opened.
• A red candle is one that closes with a close price that is lower than the price it opened.
Swing Highs and Swing Lows
• A swing high is a green candle or series of consecutive green candles followed by a single red candle to complete the swing and form the peak.
• A swing low is a red candle or series of consecutive red candles followed by a single green candle to complete the swing and form the trough.
Peak and Trough Prices (Basic)
• The peak price of a complete swing high is the high price of either the red candle that completes the swing high or the high price of the preceding green candle, depending on which is higher.
• The trough price of a complete swing low is the low price of either the green candle that completes the swing low or the low price of the preceding red candle, depending on which is lower.
Historic Peaks and Troughs
The current, or most recent, peak and trough occurrences are referred to as occurrence zero. Previous peak and trough occurrences are referred to as historic and ordered numerically from right to left, with the most recent historic peak and trough occurrences being occurrence one.
Broken and Unbroken Peaks and Troughs
Upon the completion of a new swing low the high of the green candle that completes the swing low will be above, below or equal to the current peak price. And similarly, upon the completion of a new swing high the low of the red candle that completes the swing high will be above, below or equal to the current trough price.
If the high price of the green candle that completes the current swing low is higher than or equal to the current peak price then the current peak is broken. If the high of the green candle that completes the current swing low is below the current peak price, then the current peak is unbroken.
Similarly, if the low price of the red candle that completes the current swing high is lower than or equal to the current trough price then the current trough is broken. If the low price of the red candle that completes the current swing high is above the current trough price, then the current trough is unbroken.
Range
The range is simply the difference between the current peak and current trough prices, generally expressed in terms of points or pips.
Upper Trends
• A return line uptrend is formed when the current peak price is higher than the preceding peak price.
• A downtrend is formed when the current peak price is lower than the preceding peak price.
• A double-top is formed when the current peak price is equal to the preceding peak price.
Lower Trends
• An uptrend is formed when the current trough price is higher than the preceding trough price.
• A return line downtrend is formed when the current trough price is lower than the preceding trough price.
• A double-bottom is formed when the current trough price is equal to the preceding trough price.
Muti-Part Upper and Lower Trends
• A multi-part return line uptrend begins with the formation of a new return line uptrend, or higher peak, and continues until a new downtrend, or lower peak, completes the trend.
• A multi-part downtrend begins with the formation of a new downtrend, or lower peak, and continues until a new return line uptrend, or higher peak, completes the trend.
• A multi-part uptrend begins with the formation of a new uptrend, or higher trough, and continues until a new return line downtrend, or lower trough, completes the trend.
• A multi-part return line downtrend begins with the formation of a new return line downtrend, or lower trough, and continues until a new uptrend, or higher trough, completes the trend.
Wave Cycles
A wave cycle is here defined as a complete two-part move between a swing high and a swing low, or a swing low and a swing high. The first swing high or swing low will set the course for the sequence of wave cycles that follow; for example a chart that begins with a swing low will form its first complete wave cycle upon the formation of the first complete swing high and vice versa.
Figure 1.
Retracement and Extension Ratios
Retracement and extension ratios are calculated by dividing the current range by the preceding range and multiplying the answer by 100. Retracement ratios are those that are equal to or below 100% of the preceding range and extension ratios are those that are above 100% of the preceding range.
Bullish and Bearish Pennant Patterns
• Bullish pennants are generally composed of three troughs and two peaks. The first peak being higher than the second peak and the first trough being lower than both the second and third troughs, with the third trough being higher than the second trough.
• Bearish pennants are generally composed of three peaks and two troughs. The first trough being lower than the second trough and the first peak being higher than both the second and third peaks, with third peak being lower than the second peak.
In this script I have used minimum and maximum retracement and extension ratios to set parameters for pattern identification:
• Wave 1 of the pattern, referred to as AB, is set to a minimum ratio of 100%.
• Wave 2 of the pattern, referred to as BC, is set to a maximum ratio of 30%.
• Wave 3 of the pattern, referred to as CD, has no ratio measurements but will always be below 100% by default.
• Wave 4 of the pattern, referred to as DE, has no ratio measurements but will always be below 100% by default.
█ FEATURES
Inputs
• Unbroken Peaks
• AB Minimum Ratio
• BC Maximum Ratio
• Pole Color
• Flag Color
• Extend Current Flag Lines
• Show Labels
• Label Color
• Show Projection Lines
• Extend Current Projection Lines
Alerts
Users can set alerts for when the patterns occur.
█ LIMITATIONS
All green and red candle calculations are based on differences between open and close prices, as such I have made no attempt to account for green candles that gap lower and close below the close price of the preceding candle, or red candles that gap higher and close above the close price of the preceding candle. This may cause some unexpected behaviour on some markets and timeframes. I can only recommend using 24-hour markets, if and where possible, as there are far fewer gaps and, generally, more data to work

Bearish Flag Patterns [theEccentricTrader]█ OVERVIEW
This indicator automatically draws bearish flag patterns and price projections derived from the ranges that constitute the patterns.
█ CONCEPTS
Green and Red Candles
• A green candle is one that closes with a close price equal to or above the price it opened.
• A red candle is one that closes with a close price that is lower than the price it opened.
Swing Highs and Swing Lows
• A swing high is a green candle or series of consecutive green candles followed by a single red candle to complete the swing and form the peak.
• A swing low is a red candle or series of consecutive red candles followed by a single green candle to complete the swing and form the trough.
Peak and Trough Prices (Basic)
• The peak price of a complete swing high is the high price of either the red candle that completes the swing high or the high price of the preceding green candle, depending on which is higher.
• The trough price of a complete swing low is the low price of either the green candle that completes the swing low or the low price of the preceding red candle, depending on which is lower.
Historic Peaks and Troughs
The current, or most recent, peak and trough occurrences are referred to as occurrence zero. Previous peak and trough occurrences are referred to as historic and ordered numerically from right to left, with the most recent historic peak and trough occurrences being occurrence one.
Broken and Unbroken Peaks and Troughs
Upon the completion of a new swing low the high of the green candle that completes the swing low will be above, below or equal to the current peak price. And similarly, upon the completion of a new swing high the low of the red candle that completes the swing high will be above, below or equal to the current trough price.
If the high price of the green candle that completes the current swing low is higher than or equal to the current peak price then the current peak is broken. If the high of the green candle that completes the current swing low is below the current peak price, then the current peak is unbroken.
Similarly, if the low price of the red candle that completes the current swing high is lower than or equal to the current trough price then the current trough is broken. If the low price of the red candle that completes the current swing high is above the current trough price, then the current trough is unbroken.
Range
The range is simply the difference between the current peak and current trough prices, generally expressed in terms of points or pips.
Upper Trends
• A return line uptrend is formed when the current peak price is higher than the preceding peak price.
• A downtrend is formed when the current peak price is lower than the preceding peak price.
• A double-top is formed when the current peak price is equal to the preceding peak price.
Lower Trends
• An uptrend is formed when the current trough price is higher than the preceding trough price.
• A return line downtrend is formed when the current trough price is lower than the preceding trough price.
• A double-bottom is formed when the current trough price is equal to the preceding trough price.
Wave Cycles
A wave cycle is here defined as a complete two-part move between a swing high and a swing low, or a swing low and a swing high. The first swing high or swing low will set the course for the sequence of wave cycles that follow; for example a chart that begins with a swing low will form its first complete wave cycle upon the formation of the first complete swing high and vice versa.
Figure 1.
Retracement and Extension Ratios
Retracement and extension ratios are calculated by dividing the current range by the preceding range and multiplying the answer by 100. Retracement ratios are those that are equal to or below 100% of the preceding range and extension ratios are those that are above 100% of the preceding range.
Bullish and Bearish Flag Patterns
• Bullish flags are generally composed of three troughs and two peaks. The first peak being higher than the second peak and the second trough being higher than the first trough. The third trough must be lower than the second trough but higher than the first.
• Bearish flags are generally composed of three peaks and two troughs. The first trough being lower than the second trough and the second peak being lower than the first peak. The third peak must be higher than the second peak but lower than the first.
In this script I have used minimum and maximum retracement and extension ratios to set parameters for pattern identification:
• Wave 1 of the pattern, referred to as AB, is set to a minimum ratio of 100%.
• Wave 2 of the pattern, referred to as BC, is set to a maximum ratio of 30%.
• Wave 3 of the pattern, referred to as CD, has no ratio measurements but will always be below 100% by default.
• Wave 4 of the pattern, referred to as DE, has no ratio measurements but will always be above 100% by default.
• The last measure, referred to as BE, is that of the range set between points B and E as a ratio of the range set by wave 1, which is set to a maximum ratio of 40%.
█ FEATURES
Inputs
• Unbroken Troughs
• AB Minimum Ratio
• BC Maximum Ratio
• BE Maximum Ratio
• Pole Color
• Flag Color
• Extend Current Flag Lines
• Show Labels
• Label Color
• Show Projection Lines
• Extend Current Projection Lines
Alerts
Users can set alerts for when the patterns occur.
█ LIMITATIONS
All green and red candle calculations are based on differences between open and close prices, as such I have made no attempt to account for green candles that gap lower and close below the close price of the preceding candle, or red candles that gap higher and close above the close price of the preceding candle. This may cause some unexpected behaviour on some markets and timeframes. I can only recommend using 24-hour markets, if and where possible, as there are far fewer gaps and, generally, more data to work with.

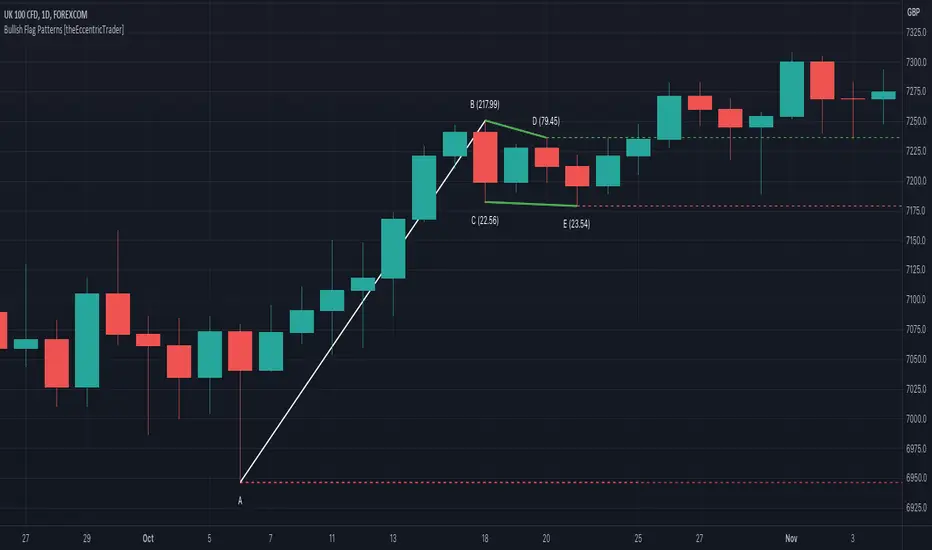
Bullish Flag Patterns [theEccentricTrader]█ OVERVIEW
This indicator automatically draws bullish flag patterns and price projections derived from the ranges that constitute the patterns.
█ CONCEPTS
Green and Red Candles
• A green candle is one that closes with a close price equal to or above the price it opened.
• A red candle is one that closes with a close price that is lower than the price it opened.
Swing Highs and Swing Lows
• A swing high is a green candle or series of consecutive green candles followed by a single red candle to complete the swing and form the peak.
• A swing low is a red candle or series of consecutive red candles followed by a single green candle to complete the swing and form the trough.
Peak and Trough Prices (Basic)
• The peak price of a complete swing high is the high price of either the red candle that completes the swing high or the high price of the preceding green candle, depending on which is higher.
• The trough price of a complete swing low is the low price of either the green candle that completes the swing low or the low price of the preceding red candle, depending on which is lower.
Historic Peaks and Troughs
The current, or most recent, peak and trough occurrences are referred to as occurrence zero. Previous peak and trough occurrences are referred to as historic and ordered numerically from right to left, with the most recent historic peak and trough occurrences being occurrence one.
Broken and Unbroken Peaks and Troughs
Upon the completion of a new swing low the high of the green candle that completes the swing low will be above, below or equal to the current peak price. And similarly, upon the completion of a new swing high the low of the red candle that completes the swing high will be above, below or equal to the current trough price.
If the high price of the green candle that completes the current swing low is higher than or equal to the current peak price then the current peak is broken. If the high of the green candle that completes the current swing low is below the current peak price, then the current peak is unbroken.
Similarly, if the low price of the red candle that completes the current swing high is lower than or equal to the current trough price then the current trough is broken. If the low price of the red candle that completes the current swing high is above the current trough price, then the current trough is unbroken.
Range
The range is simply the difference between the current peak and current trough prices, generally expressed in terms of points or pips.
Upper Trends
• A return line uptrend is formed when the current peak price is higher than the preceding peak price.
• A downtrend is formed when the current peak price is lower than the preceding peak price.
• A double-top is formed when the current peak price is equal to the preceding peak price.
Lower Trends
• An uptrend is formed when the current trough price is higher than the preceding trough price.
• A return line downtrend is formed when the current trough price is lower than the preceding trough price.
• A double-bottom is formed when the current trough price is equal to the preceding trough price.
Wave Cycles
A wave cycle is here defined as a complete two-part move between a swing high and a swing low, or a swing low and a swing high. The first swing high or swing low will set the course for the sequence of wave cycles that follow; for example a chart that begins with a swing low will form its first complete wave cycle upon the formation of the first complete swing high and vice versa.
Figure 1.
Retracement and Extension Ratios
Retracement and extension ratios are calculated by dividing the current range by the preceding range and multiplying the answer by 100. Retracement ratios are those that are equal to or below 100% of the preceding range and extension ratios are those that are above 100% of the preceding range.
Bullish and Bearish Flag Patterns
• Bullish flags are generally composed of three troughs and two peaks. The first peak being higher than the second peak and the second trough being higher than the first trough. The third trough must be lower than the second trough but higher than the first.
• Bearish flags are generally composed of three peaks and two troughs. The first trough being lower than the second trough and the second peak being lower than the first peak. The third peak must be higher than the second peak but lower than the first.
In this script I have used minimum and maximum retracement and extension ratios to set parameters for pattern identification:
• Wave 1 of the pattern, referred to as AB, is set to a minimum ratio of 100%.
• Wave 2 of the pattern, referred to as BC, is set to a maximum ratio of 30%.
• Wave 3 of the pattern, referred to as CD, has no ratio measurements but will always be below 100% by default.
• Wave 4 of the pattern, referred to as DE, has no ratio measurements but will always be above 100% by default.
• The last measure, referred to as BE, is that of the range set between points B and E as a ratio of the range set by wave 1, which is set to a maximum ratio of 40%.
█ FEATURES
Inputs
• Unbroken Peaks
• AB Minimum Ratio
• BC Maximum Ratio
• BE Maximum Ratio
• Pole Color
• Flag Color
• Extend Current Flag Lines
• Show Labels
• Label Color
• Show Projection Lines
• Extend Current Projection Lines
Alerts
Users can set alerts for when the patterns occur.
█ LIMITATIONS
All green and red candle calculations are based on differences between open and close prices, as such I have made no attempt to account for green candles that gap lower and close below the close price of the preceding candle, or red candles that gap higher and close above the close price of the preceding candle. This may cause some unexpected behaviour on some markets and timeframes. I can only recommend using 24-hour markets, if and where possible, as there are far fewer gaps and, generally, more data to work with.
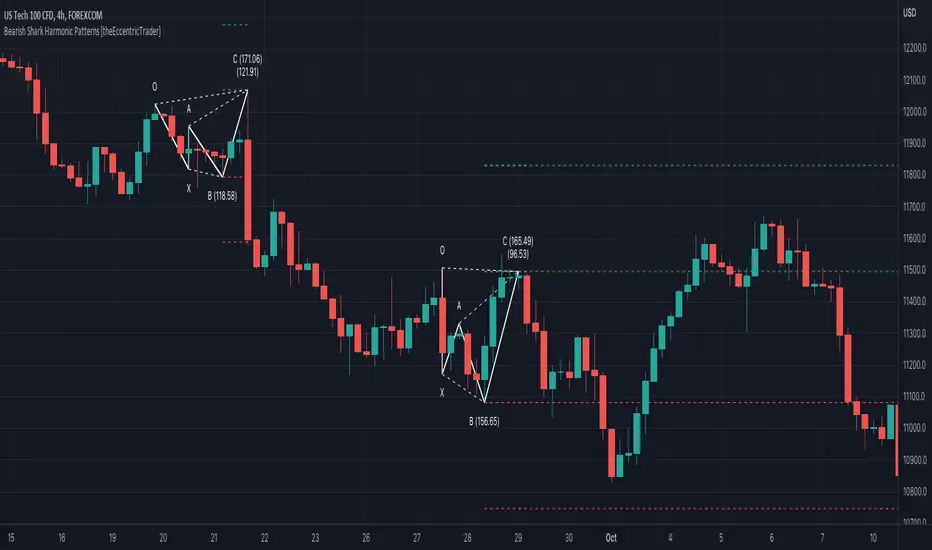
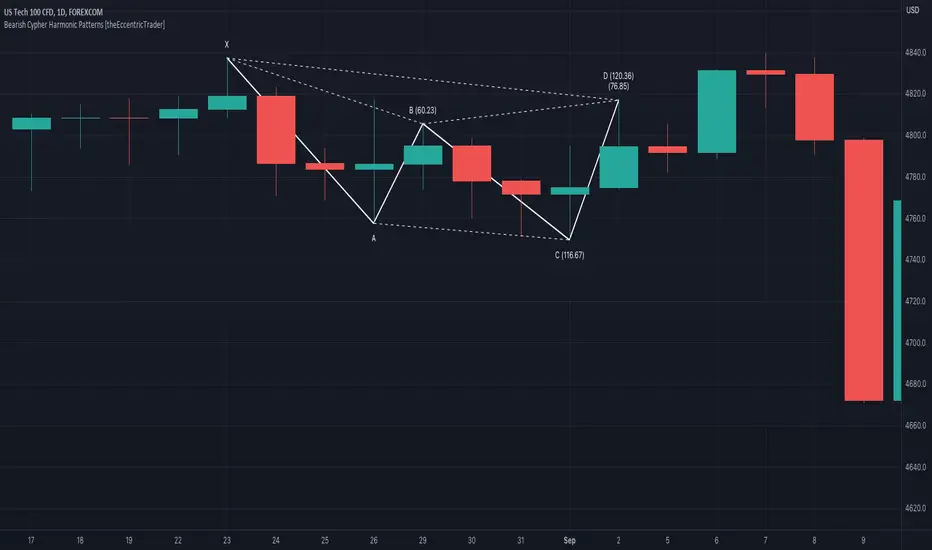
Bearish Cypher Harmonic Patterns [theEccentricTrader]█ OVERVIEW
This indicator automatically draws bearish cypher harmonic patterns and price projections derived from the ranges that constitute the patterns.
█ CONCEPTS
Green and Red Candles
• A green candle is one that closes with a close price equal to or above the price it opened.
• A red candle is one that closes with a close price that is lower than the price it opened.
Swing Highs and Swing Lows
• A swing high is a green candle or series of consecutive green candles followed by a single red candle to complete the swing and form the peak.
• A swing low is a red candle or series of consecutive red candles followed by a single green candle to complete the swing and form the trough.
Peak and Trough Prices (Basic)
• The peak price of a complete swing high is the high price of either the red candle that completes the swing high or the high price of the preceding green candle, depending on which is higher.
• The trough price of a complete swing low is the low price of either the green candle that completes the swing low or the low price of the preceding red candle, depending on which is lower.
Historic Peaks and Troughs
The current, or most recent, peak and trough occurrences are referred to as occurrence zero. Previous peak and trough occurrences are referred to as historic and ordered numerically from right to left, with the most recent historic peak and trough occurrences being occurrence one.
Range
The range is simply the difference between the current peak and current trough prices, generally expressed in terms of points or pips.
Support and Resistance
• Support refers to a price level where the demand for an asset is strong enough to prevent the price from falling further.
• Resistance refers to a price level where the supply of an asset is strong enough to prevent the price from rising further.
Support and resistance levels are important because they can help traders identify where the price of an asset might pause or reverse its direction, offering potential entry and exit points. For example, a trader might look to buy an asset when it approaches a support level , with the expectation that the price will bounce back up. Alternatively, a trader might look to sell an asset when it approaches a resistance level , with the expectation that the price will drop back down.
It's important to note that support and resistance levels are not always relevant, and the price of an asset can also break through these levels and continue moving in the same direction.
Upper Trends
• A return line uptrend is formed when the current peak price is higher than the preceding peak price.
• A downtrend is formed when the current peak price is lower than the preceding peak price.
• A double-top is formed when the current peak price is equal to the preceding peak price.
Lower Trends
• An uptrend is formed when the current trough price is higher than the preceding trough price.
• A return line downtrend is formed when the current trough price is lower than the preceding trough price.
• A double-bottom is formed when the current trough price is equal to the preceding trough price.
Wave Cycles
A wave cycle is here defined as a complete two-part move between a swing high and a swing low, or a swing low and a swing high. The first swing high or swing low will set the course for the sequence of wave cycles that follow; for example a chart that begins with a swing low will form its first complete wave cycle upon the formation of the first complete swing high and vice versa.
Figure 1.
Fibonacci Retracement and Extension Ratios
The Fibonacci sequence is a series of numbers in which each number is the sum of the two preceding numbers, starting with 0 and 1. For example 0 + 1 = 1, 1 + 1 = 2, 1 + 2 = 3, and so on. Ultimately, we could go on forever but the first few numbers in the sequence are as follows: 0 , 1, 1, 2, 3, 5, 8, 13, 21, 34, 55, 89, 144.
The extension ratios are calculated by dividing each number in the sequence by the number preceding it. For example 0/1 = 0, 1/1 = 1, 2/1 = 2, 3/2 = 1.5, 5/3 = 1.6666..., 8/5 = 1.6, 13/8 = 1.625, 21/13 = 1.6153..., 34/21 = 1.6190..., 55/34 = 1.6176..., 89/55 = 1.6181..., 144/89 = 1.6179..., and so on. The retracement ratios are calculated by inverting this process and dividing each number in the sequence by the number proceeding it. For example 0/1 = 0, 1/1 = 1, 1/2 = 0.5, 2/3 = 0.666..., 3/5 = 0.6, 5/8 = 0.625, 8/13 = 0.6153..., 13/21 = 0.6190..., 21/34 = 0.6176..., 34/55 = 0.6181..., 55/89 = 0.6179..., 89/144 = 0.6180..., and so on.
1.618 is considered to be the 'golden ratio', found in many natural phenomena such as the growth of seashells and the branching of trees. Some now speculate the universe oscillates at a frequency of 0,618 Hz, which could help to explain such phenomena, but this theory has yet to be proven.
Traders and analysts use Fibonacci retracement and extension indicators, consisting of horizontal lines representing different Fibonacci ratios, for identifying potential levels of support and resistance. Fibonacci ranges are typically drawn from left to right, with retracement levels representing ratios inside of the current range and extension levels representing ratios extended outside of the current range. If the current wave cycle ends on a swing low, the Fibonacci range is drawn from peak to trough. If the current wave cycle ends on a swing high the Fibonacci range is drawn from trough to peak.
Harmonic Patterns
The concept of harmonic patterns in trading was first introduced by H.M. Gartley in his book "Profits in the Stock Market", published in 1935. Gartley observed that markets have a tendency to move in repetitive patterns, and he identified several specific patterns that he believed could be used to predict future price movements.
Since then, many other traders and analysts have built upon Gartley's work and developed their own variations of harmonic patterns. One such contributor is Larry Pesavento, who developed his own methods for measuring harmonic patterns using Fibonacci ratios. Pesavento has written several books on the subject of harmonic patterns and Fibonacci ratios in trading. Another notable contributor to harmonic patterns is Scott Carney, who developed his own approach to harmonic trading in the late 1990s and also popularised the use of Fibonacci ratios to measure harmonic patterns. Carney expanded on Gartley's work and also introduced several new harmonic patterns, such as the Shark pattern and the 5-0 pattern.
The bullish and bearish Gartley patterns are the oldest recognized harmonic patterns in trading and all the other harmonic patterns are ultimately modifications of the original Gartley patterns. Gartley patterns are fundamentally composed of 5 points, or 4 waves.
Bullish and Bearish Cypher Patterns
• Bullish cypher patterns are fundamentally composed of three troughs and two peaks, with the second peak being higher than the first peak and the second trough being higher than the first trough. The third trough must be lower than the second trough but higher than the first.
• Bearish cypher patterns are fundamentally composed of three peaks and two troughs, with the second trough being lower than the first trough and the second peak being lower than the first peak. The third peak must be higher than the second peak but lower than the first.
The most commonly recognised ratio measures used by traders today are as follows:
• Wave 1 of the pattern, referred to as XA, has no specific ratio requirements.
• Wave 2 of the pattern, referred to as AB, should retrace to at least 38.2%, but no further than 61.8% of the range set by wave 1.
• Wave 3 of the pattern, referred to as BC, should extend to at least 113%, but no further than 141.4% of the range set by wave 2.
• Wave 4 of the pattern, referred to as CD, should extend to at least 127.2%, but no further than 200% of the range set by wave 3.
• The last measure, that of wave 4 as a ratio of the range set between points X and C, referred to as XC, should retrace to 78.6%.
Measurement Tolerances
In general, tolerance in measurements refers to the allowable variation or deviation from a specific value or dimension. It is the range within which a particular measurement is considered to be acceptable or accurate. In this script I have applied this concept to the measurement of harmonic pattern ratios to increase to the frequency of pattern occurrences.
For example, the AB measurement of Gartley patterns is generally set at around 61.8%, but with such specificity in the measuring requirements the patterns are very rare. We can increase the frequency of pattern occurrences by setting a tolerance. A tolerance of 10% to both downside and upside, which is the default setting for all tolerances, means we would have a tolerable measurement range between 51.8-71.8%, thus increasing the frequency of occurrence.
█ FEATURES
Inputs
• AB Lower Tolerance
• AB Upper Tolerance
• BC Lower Tolerance
• BC Upper Tolerance
• CD Lower Tolerance
• CD Upper Tolerance
• XC Lower Tolerance
• XC Upper Tolerance
• Pattern Color
• Label Color
• Show Projections
• Extend Current Projection Lines
Alerts
Users can set alerts for when the patterns occur.
█ LIMITATIONS
All green and red candle calculations are based on differences between open and close prices, as such I have made no attempt to account for green candles that gap lower and close below the close price of the preceding candle, or red candles that gap higher and close above the close price of the preceding candle. This may cause some unexpected behaviour on some markets and timeframes. I can only recommend using 24-hour markets, if and where possible, as there are far fewer gaps and, generally, more data to work with.
█ NOTES
The cypher pattern was initially discovered by Darren Oglesbee, but I was unable to find any direct sources to his work on harmonic patterns. And although there seems to be some contention over whether or not there should be a ratio requirement for the CD wave, I decided to include it nonetheless.
Bullish Cypher Harmonic Patterns [theEccentricTrader]█ OVERVIEW
This indicator automatically draws bullish cypher harmonic patterns and price projections derived from the ranges that constitute the patterns.
█ CONCEPTS
Green and Red Candles
• A green candle is one that closes with a close price equal to or above the price it opened.
• A red candle is one that closes with a close price that is lower than the price it opened.
Swing Highs and Swing Lows
• A swing high is a green candle or series of consecutive green candles followed by a single red candle to complete the swing and form the peak.
• A swing low is a red candle or series of consecutive red candles followed by a single green candle to complete the swing and form the trough.
Peak and Trough Prices (Basic)
• The peak price of a complete swing high is the high price of either the red candle that completes the swing high or the high price of the preceding green candle, depending on which is higher.
• The trough price of a complete swing low is the low price of either the green candle that completes the swing low or the low price of the preceding red candle, depending on which is lower.
Historic Peaks and Troughs
The current, or most recent, peak and trough occurrences are referred to as occurrence zero. Previous peak and trough occurrences are referred to as historic and ordered numerically from right to left, with the most recent historic peak and trough occurrences being occurrence one.
Range
The range is simply the difference between the current peak and current trough prices, generally expressed in terms of points or pips.
Support and Resistance
• Support refers to a price level where the demand for an asset is strong enough to prevent the price from falling further.
• Resistance refers to a price level where the supply of an asset is strong enough to prevent the price from rising further.
Support and resistance levels are important because they can help traders identify where the price of an asset might pause or reverse its direction, offering potential entry and exit points. For example, a trader might look to buy an asset when it approaches a support level , with the expectation that the price will bounce back up. Alternatively, a trader might look to sell an asset when it approaches a resistance level , with the expectation that the price will drop back down.
It's important to note that support and resistance levels are not always relevant, and the price of an asset can also break through these levels and continue moving in the same direction.
Upper Trends
• A return line uptrend is formed when the current peak price is higher than the preceding peak price.
• A downtrend is formed when the current peak price is lower than the preceding peak price.
• A double-top is formed when the current peak price is equal to the preceding peak price.
Lower Trends
• An uptrend is formed when the current trough price is higher than the preceding trough price.
• A return line downtrend is formed when the current trough price is lower than the preceding trough price.
• A double-bottom is formed when the current trough price is equal to the preceding trough price.
Wave Cycles
A wave cycle is here defined as a complete two-part move between a swing high and a swing low, or a swing low and a swing high. The first swing high or swing low will set the course for the sequence of wave cycles that follow; for example a chart that begins with a swing low will form its first complete wave cycle upon the formation of the first complete swing high and vice versa.
Figure 1.
Fibonacci Retracement and Extension Ratios
The Fibonacci sequence is a series of numbers in which each number is the sum of the two preceding numbers, starting with 0 and 1. For example 0 + 1 = 1, 1 + 1 = 2, 1 + 2 = 3, and so on. Ultimately, we could go on forever but the first few numbers in the sequence are as follows: 0 , 1, 1, 2, 3, 5, 8, 13, 21, 34, 55, 89, 144.
The extension ratios are calculated by dividing each number in the sequence by the number preceding it. For example 0/1 = 0, 1/1 = 1, 2/1 = 2, 3/2 = 1.5, 5/3 = 1.6666..., 8/5 = 1.6, 13/8 = 1.625, 21/13 = 1.6153..., 34/21 = 1.6190..., 55/34 = 1.6176..., 89/55 = 1.6181..., 144/89 = 1.6179..., and so on. The retracement ratios are calculated by inverting this process and dividing each number in the sequence by the number proceeding it. For example 0/1 = 0, 1/1 = 1, 1/2 = 0.5, 2/3 = 0.666..., 3/5 = 0.6, 5/8 = 0.625, 8/13 = 0.6153..., 13/21 = 0.6190..., 21/34 = 0.6176..., 34/55 = 0.6181..., 55/89 = 0.6179..., 89/144 = 0.6180..., and so on.
1.618 is considered to be the 'golden ratio', found in many natural phenomena such as the growth of seashells and the branching of trees. Some now speculate the universe oscillates at a frequency of 0,618 Hz, which could help to explain such phenomena, but this theory has yet to be proven.
Traders and analysts use Fibonacci retracement and extension indicators, consisting of horizontal lines representing different Fibonacci ratios, for identifying potential levels of support and resistance. Fibonacci ranges are typically drawn from left to right, with retracement levels representing ratios inside of the current range and extension levels representing ratios extended outside of the current range. If the current wave cycle ends on a swing low, the Fibonacci range is drawn from peak to trough. If the current wave cycle ends on a swing high the Fibonacci range is drawn from trough to peak.
Harmonic Patterns
The concept of harmonic patterns in trading was first introduced by H.M. Gartley in his book "Profits in the Stock Market", published in 1935. Gartley observed that markets have a tendency to move in repetitive patterns, and he identified several specific patterns that he believed could be used to predict future price movements.
Since then, many other traders and analysts have built upon Gartley's work and developed their own variations of harmonic patterns. One such contributor is Larry Pesavento, who developed his own methods for measuring harmonic patterns using Fibonacci ratios. Pesavento has written several books on the subject of harmonic patterns and Fibonacci ratios in trading. Another notable contributor to harmonic patterns is Scott Carney, who developed his own approach to harmonic trading in the late 1990s and also popularised the use of Fibonacci ratios to measure harmonic patterns. Carney expanded on Gartley's work and also introduced several new harmonic patterns, such as the Shark pattern and the 5-0 pattern.
The bullish and bearish Gartley patterns are the oldest recognized harmonic patterns in trading and all the other harmonic patterns are ultimately modifications of the original Gartley patterns. Gartley patterns are fundamentally composed of 5 points, or 4 waves.
Bullish and Bearish Cypher Patterns
• Bullish cypher patterns are fundamentally composed of three troughs and two peaks, with the second peak being higher than the first peak and the second trough being higher than the first trough. The third trough must be lower than the second trough but higher than the first.
• Bearish cypher patterns are fundamentally composed of three peaks and two troughs, with the second trough being lower than the first trough and the second peak being lower than the first peak. The third peak must be higher than the second peak but lower than the first.
The most commonly recognised ratio measures used by traders today are as follows:
• Wave 1 of the pattern, referred to as XA, has no specific ratio requirements.
• Wave 2 of the pattern, referred to as AB, should retrace to at least 38.2%, but no further than 61.8% of the range set by wave 1.
• Wave 3 of the pattern, referred to as BC, should extend to at least 113%, but no further than 141.4% of the range set by wave 2.
• Wave 4 of the pattern, referred to as CD, should extend to at least 127.2%, but no further than 200% of the range set by wave 3.
• The last measure, that of wave 4 as a ratio of the range set between points X and C, referred to as XC, should retrace to 78.6%.
Measurement Tolerances
In general, tolerance in measurements refers to the allowable variation or deviation from a specific value or dimension. It is the range within which a particular measurement is considered to be acceptable or accurate. In this script I have applied this concept to the measurement of harmonic pattern ratios to increase to the frequency of pattern occurrences.
For example, the AB measurement of Gartley patterns is generally set at around 61.8%, but with such specificity in the measuring requirements the patterns are very rare. We can increase the frequency of pattern occurrences by setting a tolerance. A tolerance of 10% to both downside and upside, which is the default setting for all tolerances, means we would have a tolerable measurement range between 51.8-71.8%, thus increasing the frequency of occurrence.
█ FEATURES
Inputs
• AB Lower Tolerance
• AB Upper Tolerance
• BC Lower Tolerance
• BC Upper Tolerance
• CD Lower Tolerance
• CD Upper Tolerance
• XC Lower Tolerance
• XC Upper Tolerance
• Pattern Color
• Label Color
• Show Projections
• Extend Current Projection Lines
Alerts
Users can set alerts for when the patterns occur.
█ LIMITATIONS
All green and red candle calculations are based on differences between open and close prices, as such I have made no attempt to account for green candles that gap lower and close below the close price of the preceding candle, or red candles that gap higher and close above the close price of the preceding candle. This may cause some unexpected behaviour on some markets and timeframes. I can only recommend using 24-hour markets, if and where possible, as there are far fewer gaps and, generally, more data to work with.
█ NOTES
The cypher pattern was initially discovered by Darren Oglesbee, but I was unable to find any direct sources to his work on harmonic patterns. And although there seems to be some contention over whether or not there should be a ratio requirement for the CD wave, I decided to include it nonetheless.
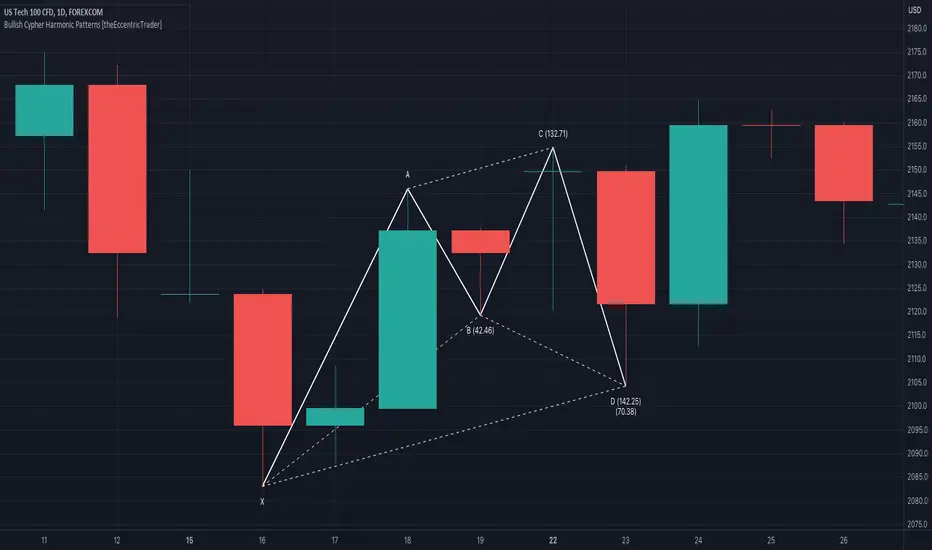
Bearish Deep Crab Harmonic Patterns [theEccentricTrader]█ OVERVIEW
This indicator automatically draws bearish deep crab harmonic patterns and price projections derived from the ranges that constitute the patterns.
█ CONCEPTS
Green and Red Candles
• A green candle is one that closes with a close price equal to or above the price it opened.
• A red candle is one that closes with a close price that is lower than the price it opened.
Swing Highs and Swing Lows
• A swing high is a green candle or series of consecutive green candles followed by a single red candle to complete the swing and form the peak.
• A swing low is a red candle or series of consecutive red candles followed by a single green candle to complete the swing and form the trough.
Peak and Trough Prices (Basic)
• The peak price of a complete swing high is the high price of either the red candle that completes the swing high or the high price of the preceding green candle, depending on which is higher.
• The trough price of a complete swing low is the low price of either the green candle that completes the swing low or the low price of the preceding red candle, depending on which is lower.
Historic Peaks and Troughs
The current, or most recent, peak and trough occurrences are referred to as occurrence zero. Previous peak and trough occurrences are referred to as historic and ordered numerically from right to left, with the most recent historic peak and trough occurrences being occurrence one.
Range
The range is simply the difference between the current peak and current trough prices, generally expressed in terms of points or pips.
Support and Resistance
• Support refers to a price level where the demand for an asset is strong enough to prevent the price from falling further.
• Resistance refers to a price level where the supply of an asset is strong enough to prevent the price from rising further.
Support and resistance levels are important because they can help traders identify where the price of an asset might pause or reverse its direction, offering potential entry and exit points. For example, a trader might look to buy an asset when it approaches a support level , with the expectation that the price will bounce back up. Alternatively, a trader might look to sell an asset when it approaches a resistance level , with the expectation that the price will drop back down.
It's important to note that support and resistance levels are not always relevant, and the price of an asset can also break through these levels and continue moving in the same direction.
Upper Trends
• A return line uptrend is formed when the current peak price is higher than the preceding peak price.
• A downtrend is formed when the current peak price is lower than the preceding peak price.
• A double-top is formed when the current peak price is equal to the preceding peak price.
Lower Trends
• An uptrend is formed when the current trough price is higher than the preceding trough price.
• A return line downtrend is formed when the current trough price is lower than the preceding trough price.
• A double-bottom is formed when the current trough price is equal to the preceding trough price.
Wave Cycles
A wave cycle is here defined as a complete two-part move between a swing high and a swing low, or a swing low and a swing high. The first swing high or swing low will set the course for the sequence of wave cycles that follow; for example a chart that begins with a swing low will form its first complete wave cycle upon the formation of the first complete swing high and vice versa.
Figure 1.
Fibonacci Retracement and Extension Ratios
The Fibonacci sequence is a series of numbers in which each number is the sum of the two preceding numbers, starting with 0 and 1. For example 0 + 1 = 1, 1 + 1 = 2, 1 + 2 = 3, and so on. Ultimately, we could go on forever but the first few numbers in the sequence are as follows: 0 , 1, 1, 2, 3, 5, 8, 13, 21, 34, 55, 89, 144.
The extension ratios are calculated by dividing each number in the sequence by the number preceding it. For example 0/1 = 0, 1/1 = 1, 2/1 = 2, 3/2 = 1.5, 5/3 = 1.6666..., 8/5 = 1.6, 13/8 = 1.625, 21/13 = 1.6153..., 34/21 = 1.6190..., 55/34 = 1.6176..., 89/55 = 1.6181..., 144/89 = 1.6179..., and so on. The retracement ratios are calculated by inverting this process and dividing each number in the sequence by the number proceeding it. For example 0/1 = 0, 1/1 = 1, 1/2 = 0.5, 2/3 = 0.666..., 3/5 = 0.6, 5/8 = 0.625, 8/13 = 0.6153..., 13/21 = 0.6190..., 21/34 = 0.6176..., 34/55 = 0.6181..., 55/89 = 0.6179..., 89/144 = 0.6180..., and so on.
1.618 is considered to be the 'golden ratio', found in many natural phenomena such as the growth of seashells and the branching of trees. Some now speculate the universe oscillates at a frequency of 0,618 Hz, which could help to explain such phenomena, but this theory has yet to be proven.
Traders and analysts use Fibonacci retracement and extension indicators, consisting of horizontal lines representing different Fibonacci ratios, for identifying potential levels of support and resistance. Fibonacci ranges are typically drawn from left to right, with retracement levels representing ratios inside of the current range and extension levels representing ratios extended outside of the current range. If the current wave cycle ends on a swing low, the Fibonacci range is drawn from peak to trough. If the current wave cycle ends on a swing high the Fibonacci range is drawn from trough to peak.
Harmonic Patterns
The concept of harmonic patterns in trading was first introduced by H.M. Gartley in his book "Profits in the Stock Market", published in 1935. Gartley observed that markets have a tendency to move in repetitive patterns, and he identified several specific patterns that he believed could be used to predict future price movements.
Since then, many other traders and analysts have built upon Gartley's work and developed their own variations of harmonic patterns. One such contributor is Larry Pesavento, who developed his own methods for measuring harmonic patterns using Fibonacci ratios. Pesavento has written several books on the subject of harmonic patterns and Fibonacci ratios in trading. Another notable contributor to harmonic patterns is Scott Carney, who developed his own approach to harmonic trading in the late 1990s and also popularised the use of Fibonacci ratios to measure harmonic patterns. Carney expanded on Gartley's work and also introduced several new harmonic patterns, such as the Shark pattern and the 5-0 pattern.
The bullish and bearish Gartley patterns are the oldest recognized harmonic patterns in trading and all the other harmonic patterns are ultimately modifications of the original Gartley patterns. Gartley patterns are fundamentally composed of 5 points, or 4 waves.
Bullish and Bearish Deep Crab Patterns
• Bullish deep crab patterns are fundamentally composed of three troughs and two peaks. The second peak being lower than the first peak. And the third trough being lower than both the first and second troughs, while the second trough is higher than the first.
• Bearish deep crab patterns are fundamentally composed of three peaks and two troughs. The second trough being higher than the first trough. And the third peak being higher than both the first and second peaks, while the second peak is lower than the first.
The ratio measurements recommended by Scott Carney, who originated the pattern, are as follows:
• Wave 1 of the pattern, generally referred to as XA, has no specific ratio requirements.
• Wave 2 of the pattern, generally referred to as AB, should retrace to 88.6% of the range set by wave 1.
• Wave 3 of the pattern, generally referred to as BC, should retrace by at least 38.2%, but no further than 88.6% of the range set by wave 2.
• Wave 4 of the pattern, generally referred to as CD, should extend to at least 200%, but no further than 361.8% of the range set by wave 3.
• The last measure, generally referred to as AD, is that of wave 4 as a ratio of the range set by wave 1, which should extend to 161.8%.
Measurement Tolerances
In general, tolerance in measurements refers to the allowable variation or deviation from a specific value or dimension. It is the range within which a particular measurement is considered to be acceptable or accurate. In this script I have applied this concept to the measurement of harmonic pattern ratios to increase to the frequency of pattern occurrences.
For example, the AB measurement of Gartley patterns is generally set at around 61.8%, but with such specificity in the measuring requirements the patterns are very rare. We can increase the frequency of pattern occurrences by setting a tolerance. A tolerance of 10% to both downside and upside, which is the default setting for all tolerances, means we would have a tolerable measurement range between 51.8-71.8%, thus increasing the frequency of occurrence.
█ FEATURES
Inputs
• AB Lower Tolerance
• AB Upper Tolerance
• BC Lower Tolerance
• BC Upper Tolerance
• CD Lower Tolerance
• CD Upper Tolerance
• AD Lower Tolerance
• AD Upper Tolerance
• Pattern Color
• Label Color
• Show Projections
• Extend Current Projection Lines
Alerts
Users can set alerts for when the patterns occur.
█ LIMITATIONS
All green and red candle calculations are based on differences between open and close prices, as such I have made no attempt to account for green candles that gap lower and close below the close price of the preceding candle, or red candles that gap higher and close above the close price of the preceding candle. This may cause some unexpected behaviour on some markets and timeframes. I can only recommend using 24-hour markets, if and where possible, as there are far fewer gaps and, generally, more data to work with.
█ NOTES
A link to Scott's harmonic patterns webpage for anyone who may be interested: harmonictrader.com/harmonic-patterns/

Bullish Deep Crab Harmonic Patterns [theEccentricTrader]█ OVERVIEW
This indicator automatically draws bullish deep crab harmonic patterns and price projections derived from the ranges that constitute the patterns.
█ CONCEPTS
Green and Red Candles
• A green candle is one that closes with a close price equal to or above the price it opened.
• A red candle is one that closes with a close price that is lower than the price it opened.
Swing Highs and Swing Lows
• A swing high is a green candle or series of consecutive green candles followed by a single red candle to complete the swing and form the peak.
• A swing low is a red candle or series of consecutive red candles followed by a single green candle to complete the swing and form the trough.
Peak and Trough Prices (Basic)
• The peak price of a complete swing high is the high price of either the red candle that completes the swing high or the high price of the preceding green candle, depending on which is higher.
• The trough price of a complete swing low is the low price of either the green candle that completes the swing low or the low price of the preceding red candle, depending on which is lower.
Historic Peaks and Troughs
The current, or most recent, peak and trough occurrences are referred to as occurrence zero. Previous peak and trough occurrences are referred to as historic and ordered numerically from right to left, with the most recent historic peak and trough occurrences being occurrence one.
Range
The range is simply the difference between the current peak and current trough prices, generally expressed in terms of points or pips.
Support and Resistance
• Support refers to a price level where the demand for an asset is strong enough to prevent the price from falling further.
• Resistance refers to a price level where the supply of an asset is strong enough to prevent the price from rising further.
Support and resistance levels are important because they can help traders identify where the price of an asset might pause or reverse its direction, offering potential entry and exit points. For example, a trader might look to buy an asset when it approaches a support level , with the expectation that the price will bounce back up. Alternatively, a trader might look to sell an asset when it approaches a resistance level , with the expectation that the price will drop back down.
It's important to note that support and resistance levels are not always relevant, and the price of an asset can also break through these levels and continue moving in the same direction.
Upper Trends
• A return line uptrend is formed when the current peak price is higher than the preceding peak price.
• A downtrend is formed when the current peak price is lower than the preceding peak price.
• A double-top is formed when the current peak price is equal to the preceding peak price.
Lower Trends
• An uptrend is formed when the current trough price is higher than the preceding trough price.
• A return line downtrend is formed when the current trough price is lower than the preceding trough price.
• A double-bottom is formed when the current trough price is equal to the preceding trough price.
Wave Cycles
A wave cycle is here defined as a complete two-part move between a swing high and a swing low, or a swing low and a swing high. The first swing high or swing low will set the course for the sequence of wave cycles that follow; for example a chart that begins with a swing low will form its first complete wave cycle upon the formation of the first complete swing high and vice versa.
Figure 1.
Fibonacci Retracement and Extension Ratios
The Fibonacci sequence is a series of numbers in which each number is the sum of the two preceding numbers, starting with 0 and 1. For example 0 + 1 = 1, 1 + 1 = 2, 1 + 2 = 3, and so on. Ultimately, we could go on forever but the first few numbers in the sequence are as follows: 0 , 1, 1, 2, 3, 5, 8, 13, 21, 34, 55, 89, 144.
The extension ratios are calculated by dividing each number in the sequence by the number preceding it. For example 0/1 = 0, 1/1 = 1, 2/1 = 2, 3/2 = 1.5, 5/3 = 1.6666..., 8/5 = 1.6, 13/8 = 1.625, 21/13 = 1.6153..., 34/21 = 1.6190..., 55/34 = 1.6176..., 89/55 = 1.6181..., 144/89 = 1.6179..., and so on. The retracement ratios are calculated by inverting this process and dividing each number in the sequence by the number proceeding it. For example 0/1 = 0, 1/1 = 1, 1/2 = 0.5, 2/3 = 0.666..., 3/5 = 0.6, 5/8 = 0.625, 8/13 = 0.6153..., 13/21 = 0.6190..., 21/34 = 0.6176..., 34/55 = 0.6181..., 55/89 = 0.6179..., 89/144 = 0.6180..., and so on.
1.618 is considered to be the 'golden ratio', found in many natural phenomena such as the growth of seashells and the branching of trees. Some now speculate the universe oscillates at a frequency of 0,618 Hz, which could help to explain such phenomena, but this theory has yet to be proven.
Traders and analysts use Fibonacci retracement and extension indicators, consisting of horizontal lines representing different Fibonacci ratios, for identifying potential levels of support and resistance. Fibonacci ranges are typically drawn from left to right, with retracement levels representing ratios inside of the current range and extension levels representing ratios extended outside of the current range. If the current wave cycle ends on a swing low, the Fibonacci range is drawn from peak to trough. If the current wave cycle ends on a swing high the Fibonacci range is drawn from trough to peak.
Harmonic Patterns
The concept of harmonic patterns in trading was first introduced by H.M. Gartley in his book "Profits in the Stock Market", published in 1935. Gartley observed that markets have a tendency to move in repetitive patterns, and he identified several specific patterns that he believed could be used to predict future price movements.
Since then, many other traders and analysts have built upon Gartley's work and developed their own variations of harmonic patterns. One such contributor is Larry Pesavento, who developed his own methods for measuring harmonic patterns using Fibonacci ratios. Pesavento has written several books on the subject of harmonic patterns and Fibonacci ratios in trading. Another notable contributor to harmonic patterns is Scott Carney, who developed his own approach to harmonic trading in the late 1990s and also popularised the use of Fibonacci ratios to measure harmonic patterns. Carney expanded on Gartley's work and also introduced several new harmonic patterns, such as the Shark pattern and the 5-0 pattern.
The bullish and bearish Gartley patterns are the oldest recognized harmonic patterns in trading and all the other harmonic patterns are ultimately modifications of the original Gartley patterns. Gartley patterns are fundamentally composed of 5 points, or 4 waves.
Bullish and Bearish Deep Crab Patterns
• Bullish deep crab patterns are fundamentally composed of three troughs and two peaks. The second peak being lower than the first peak. And the third trough being lower than both the first and second troughs, while the second trough is higher than the first.
• Bearish deep crab patterns are fundamentally composed of three peaks and two troughs. The second trough being higher than the first trough. And the third peak being higher than both the first and second peaks, while the second peak is lower than the first.
The ratio measurements recommended by Scott Carney, who originated the pattern, are as follows:
• Wave 1 of the pattern, generally referred to as XA, has no specific ratio requirements.
• Wave 2 of the pattern, generally referred to as AB, should retrace to 88.6% of the range set by wave 1.
• Wave 3 of the pattern, generally referred to as BC, should retrace by at least 38.2%, but no further than 88.6% of the range set by wave 2.
• Wave 4 of the pattern, generally referred to as CD, should extend to at least 200%, but no further than 361.8% of the range set by wave 3.
• The last measure, generally referred to as AD, is that of wave 4 as a ratio of the range set by wave 1, which should extend to 161.8%.
Measurement Tolerances
In general, tolerance in measurements refers to the allowable variation or deviation from a specific value or dimension. It is the range within which a particular measurement is considered to be acceptable or accurate. In this script I have applied this concept to the measurement of harmonic pattern ratios to increase to the frequency of pattern occurrences.
For example, the AB measurement of Gartley patterns is generally set at around 61.8%, but with such specificity in the measuring requirements the patterns are very rare. We can increase the frequency of pattern occurrences by setting a tolerance. A tolerance of 10% to both downside and upside, which is the default setting for all tolerances, means we would have a tolerable measurement range between 51.8-71.8%, thus increasing the frequency of occurrence.
█ FEATURES
Inputs
• AB Lower Tolerance
• AB Upper Tolerance
• BC Lower Tolerance
• BC Upper Tolerance
• CD Lower Tolerance
• CD Upper Tolerance
• AD Lower Tolerance
• AD Upper Tolerance
• Pattern Color
• Label Color
• Show Projections
• Extend Current Projection Lines
Alerts
Users can set alerts for when the patterns occur.
█ LIMITATIONS
All green and red candle calculations are based on differences between open and close prices, as such I have made no attempt to account for green candles that gap lower and close below the close price of the preceding candle, or red candles that gap higher and close above the close price of the preceding candle. This may cause some unexpected behaviour on some markets and timeframes. I can only recommend using 24-hour markets, if and where possible, as there are far fewer gaps and, generally, more data to work with.
█ NOTES
A link to Scott's harmonic patterns webpage for anyone who may be interested: harmonictrader.com/harmonic-patterns/
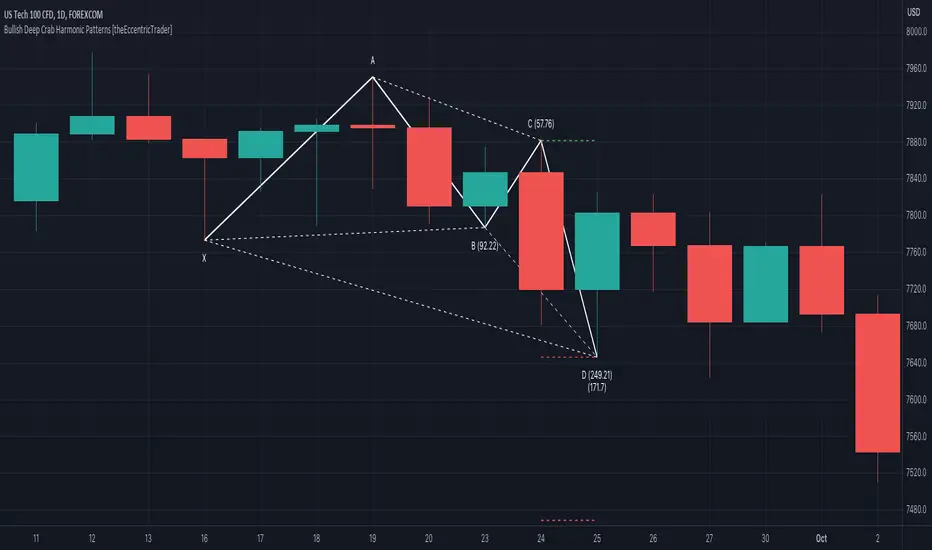
Bearish Alternate Bat Harmonic Patterns [theEccentricTrader]█ OVERVIEW
This indicator automatically draws bearish alternate bat harmonic patterns and price projections derived from the ranges that constitute the patterns.
█ CONCEPTS
Green and Red Candles
• A green candle is one that closes with a close price equal to or above the price it opened.
• A red candle is one that closes with a close price that is lower than the price it opened.
Swing Highs and Swing Lows
• A swing high is a green candle or series of consecutive green candles followed by a single red candle to complete the swing and form the peak.
• A swing low is a red candle or series of consecutive red candles followed by a single green candle to complete the swing and form the trough.
Peak and Trough Prices (Basic)
• The peak price of a complete swing high is the high price of either the red candle that completes the swing high or the high price of the preceding green candle, depending on which is higher.
• The trough price of a complete swing low is the low price of either the green candle that completes the swing low or the low price of the preceding red candle, depending on which is lower.
Historic Peaks and Troughs
The current, or most recent, peak and trough occurrences are referred to as occurrence zero. Previous peak and trough occurrences are referred to as historic and ordered numerically from right to left, with the most recent historic peak and trough occurrences being occurrence one.
Range
The range is simply the difference between the current peak and current trough prices, generally expressed in terms of points or pips.
Support and Resistance
• Support refers to a price level where the demand for an asset is strong enough to prevent the price from falling further.
• Resistance refers to a price level where the supply of an asset is strong enough to prevent the price from rising further.
Support and resistance levels are important because they can help traders identify where the price of an asset might pause or reverse its direction, offering potential entry and exit points. For example, a trader might look to buy an asset when it approaches a support level , with the expectation that the price will bounce back up. Alternatively, a trader might look to sell an asset when it approaches a resistance level , with the expectation that the price will drop back down.
It's important to note that support and resistance levels are not always relevant, and the price of an asset can also break through these levels and continue moving in the same direction.
Upper Trends
• A return line uptrend is formed when the current peak price is higher than the preceding peak price.
• A downtrend is formed when the current peak price is lower than the preceding peak price.
• A double-top is formed when the current peak price is equal to the preceding peak price.
Lower Trends
• An uptrend is formed when the current trough price is higher than the preceding trough price.
• A return line downtrend is formed when the current trough price is lower than the preceding trough price.
• A double-bottom is formed when the current trough price is equal to the preceding trough price.
Wave Cycles
A wave cycle is here defined as a complete two-part move between a swing high and a swing low, or a swing low and a swing high. The first swing high or swing low will set the course for the sequence of wave cycles that follow; for example a chart that begins with a swing low will form its first complete wave cycle upon the formation of the first complete swing high and vice versa.
Figure 1.
Fibonacci Retracement and Extension Ratios
The Fibonacci sequence is a series of numbers in which each number is the sum of the two preceding numbers, starting with 0 and 1. For example 0 + 1 = 1, 1 + 1 = 2, 1 + 2 = 3, and so on. Ultimately, we could go on forever but the first few numbers in the sequence are as follows: 0 , 1, 1, 2, 3, 5, 8, 13, 21, 34, 55, 89, 144.
The extension ratios are calculated by dividing each number in the sequence by the number preceding it. For example 0/1 = 0, 1/1 = 1, 2/1 = 2, 3/2 = 1.5, 5/3 = 1.6666..., 8/5 = 1.6, 13/8 = 1.625, 21/13 = 1.6153..., 34/21 = 1.6190..., 55/34 = 1.6176..., 89/55 = 1.6181..., 144/89 = 1.6179..., and so on. The retracement ratios are calculated by inverting this process and dividing each number in the sequence by the number proceeding it. For example 0/1 = 0, 1/1 = 1, 1/2 = 0.5, 2/3 = 0.666..., 3/5 = 0.6, 5/8 = 0.625, 8/13 = 0.6153..., 13/21 = 0.6190..., 21/34 = 0.6176..., 34/55 = 0.6181..., 55/89 = 0.6179..., 89/144 = 0.6180..., and so on.
1.618 is considered to be the 'golden ratio', found in many natural phenomena such as the growth of seashells and the branching of trees. Some now speculate the universe oscillates at a frequency of 0,618 Hz, which could help to explain such phenomena, but this theory has yet to be proven.
Traders and analysts use Fibonacci retracement and extension indicators, consisting of horizontal lines representing different Fibonacci ratios, for identifying potential levels of support and resistance. Fibonacci ranges are typically drawn from left to right, with retracement levels representing ratios inside of the current range and extension levels representing ratios extended outside of the current range. If the current wave cycle ends on a swing low, the Fibonacci range is drawn from peak to trough. If the current wave cycle ends on a swing high the Fibonacci range is drawn from trough to peak.
Harmonic Patterns
The concept of harmonic patterns in trading was first introduced by H.M. Gartley in his book "Profits in the Stock Market", published in 1935. Gartley observed that markets have a tendency to move in repetitive patterns, and he identified several specific patterns that he believed could be used to predict future price movements.
Since then, many other traders and analysts have built upon Gartley's work and developed their own variations of harmonic patterns. One such contributor is Larry Pesavento, who developed his own methods for measuring harmonic patterns using Fibonacci ratios. Pesavento has written several books on the subject of harmonic patterns and Fibonacci ratios in trading. Another notable contributor to harmonic patterns is Scott Carney, who developed his own approach to harmonic trading in the late 1990s and also popularised the use of Fibonacci ratios to measure harmonic patterns. Carney expanded on Gartley's work and also introduced several new harmonic patterns, such as the Shark pattern and the 5-0 pattern.
The bullish and bearish Gartley patterns are the oldest recognized harmonic patterns in trading and all the other harmonic patterns are ultimately modifications of the original Gartley patterns. Gartley patterns are fundamentally composed of 5 points, or 4 waves.
Bullish and Bearish Alternate Bat Patterns
• Bullish alternate bat patterns are fundamentally composed of three troughs and two peaks. The second peak being lower than the first peak and the second trough being higher than the first, with the third trough being lower than both the first and second troughs.
• Bearish alternate bat patterns are fundamentally composed of three peaks and two troughs. The second trough being higher than the first trough and the second peak being lower than the first, with the third peak being higher than both the first and second peaks.
The ratio measurements recommended by Scott Carney, who originated the pattern, are as follows:
• Wave 1 of the pattern, generally referred to as XA, has no specific ratio requirements.
• Wave 2 of the pattern, generally referred to as AB, should retrace to 38.2% of the range set by wave 1.
• Wave 3 of the pattern, generally referred to as BC, should retrace by at least 38.2%, but no further than 88.6% of the range set by wave 2.
• Wave 4 of the pattern, generally referred to as CD, should extend to at least 200%, but no further than 361.8% of the range set by wave 3.
• The last measure, generally referred to as AD, is that of wave 4 as a ratio of the range set by wave 1, which should extend to 113%.
Measurement Tolerances
In general, tolerance in measurements refers to the allowable variation or deviation from a specific value or dimension. It is the range within which a particular measurement is considered to be acceptable or accurate. In this script I have applied this concept to the measurement of harmonic pattern ratios to increase to the frequency of pattern occurrences.
For example, the AB measurement of Gartley patterns is generally set at around 61.8%, but with such specificity in the measuring requirements the patterns are very rare. We can increase the frequency of pattern occurrences by setting a tolerance. A tolerance of 10% to both downside and upside, which is the default setting for all tolerances, means we would have a tolerable measurement range between 51.8-71.8%, thus increasing the frequency of occurrence.
█ FEATURES
Inputs
• AB Lower Tolerance
• AB Upper Tolerance
• BC Lower Tolerance
• BC Upper Tolerance
• CD Lower Tolerance
• CD Upper Tolerance
• AD Lower Tolerance
• AD Upper Tolerance
• Pattern Color
• Label Color
• Show Projections
• Extend Current Projection Lines
Alerts
Users can set alerts for when the patterns occur.
█ LIMITATIONS
All green and red candle calculations are based on differences between open and close prices, as such I have made no attempt to account for green candles that gap lower and close below the close price of the preceding candle, or red candles that gap higher and close above the close price of the preceding candle. This may cause some unexpected behaviour on some markets and timeframes. I can only recommend using 24-hour markets, if and where possible, as there are far fewer gaps and, generally, more data to work with.
█ NOTES
A link to Scott's harmonic patterns webpage for anyone who may be interested: harmonictrader.com/harmonic-patterns/
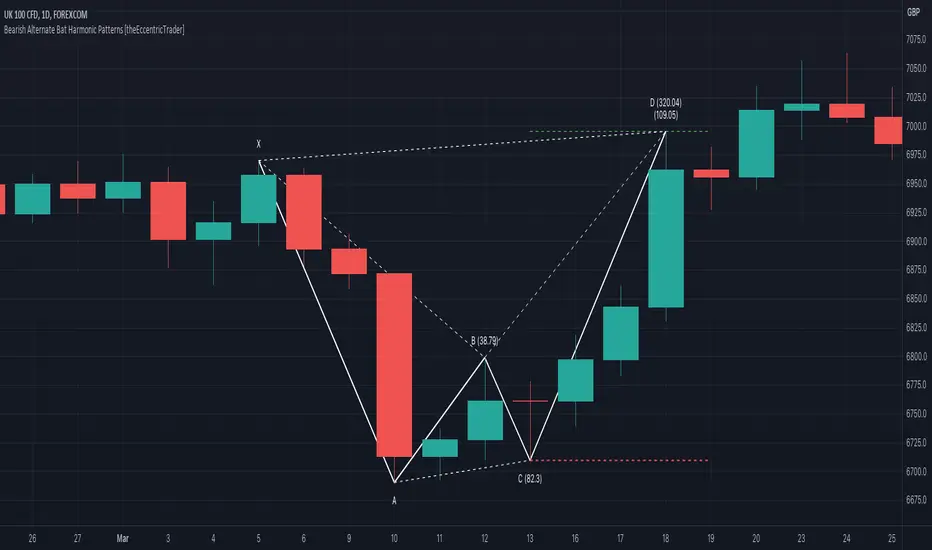
Bullish Alternate Bat Harmonic Patterns [theEccentricTrader]█ OVERVIEW
This indicator automatically draws bullish alternate bat harmonic patterns and price projections derived from the ranges that constitute the patterns.
█ CONCEPTS
Green and Red Candles
• A green candle is one that closes with a close price equal to or above the price it opened.
• A red candle is one that closes with a close price that is lower than the price it opened.
Swing Highs and Swing Lows
• A swing high is a green candle or series of consecutive green candles followed by a single red candle to complete the swing and form the peak.
• A swing low is a red candle or series of consecutive red candles followed by a single green candle to complete the swing and form the trough.
Peak and Trough Prices (Basic)
• The peak price of a complete swing high is the high price of either the red candle that completes the swing high or the high price of the preceding green candle, depending on which is higher.
• The trough price of a complete swing low is the low price of either the green candle that completes the swing low or the low price of the preceding red candle, depending on which is lower.
Historic Peaks and Troughs
The current, or most recent, peak and trough occurrences are referred to as occurrence zero. Previous peak and trough occurrences are referred to as historic and ordered numerically from right to left, with the most recent historic peak and trough occurrences being occurrence one.
Range
The range is simply the difference between the current peak and current trough prices, generally expressed in terms of points or pips.
Support and Resistance
• Support refers to a price level where the demand for an asset is strong enough to prevent the price from falling further.
• Resistance refers to a price level where the supply of an asset is strong enough to prevent the price from rising further.
Support and resistance levels are important because they can help traders identify where the price of an asset might pause or reverse its direction, offering potential entry and exit points. For example, a trader might look to buy an asset when it approaches a support level , with the expectation that the price will bounce back up. Alternatively, a trader might look to sell an asset when it approaches a resistance level , with the expectation that the price will drop back down.
It's important to note that support and resistance levels are not always relevant, and the price of an asset can also break through these levels and continue moving in the same direction.
Upper Trends
• A return line uptrend is formed when the current peak price is higher than the preceding peak price.
• A downtrend is formed when the current peak price is lower than the preceding peak price.
• A double-top is formed when the current peak price is equal to the preceding peak price.
Lower Trends
• An uptrend is formed when the current trough price is higher than the preceding trough price.
• A return line downtrend is formed when the current trough price is lower than the preceding trough price.
• A double-bottom is formed when the current trough price is equal to the preceding trough price.
Wave Cycles
A wave cycle is here defined as a complete two-part move between a swing high and a swing low, or a swing low and a swing high. The first swing high or swing low will set the course for the sequence of wave cycles that follow; for example a chart that begins with a swing low will form its first complete wave cycle upon the formation of the first complete swing high and vice versa.
Figure 1.
Fibonacci Retracement and Extension Ratios
The Fibonacci sequence is a series of numbers in which each number is the sum of the two preceding numbers, starting with 0 and 1. For example 0 + 1 = 1, 1 + 1 = 2, 1 + 2 = 3, and so on. Ultimately, we could go on forever but the first few numbers in the sequence are as follows: 0 , 1, 1, 2, 3, 5, 8, 13, 21, 34, 55, 89, 144.
The extension ratios are calculated by dividing each number in the sequence by the number preceding it. For example 0/1 = 0, 1/1 = 1, 2/1 = 2, 3/2 = 1.5, 5/3 = 1.6666..., 8/5 = 1.6, 13/8 = 1.625, 21/13 = 1.6153..., 34/21 = 1.6190..., 55/34 = 1.6176..., 89/55 = 1.6181..., 144/89 = 1.6179..., and so on. The retracement ratios are calculated by inverting this process and dividing each number in the sequence by the number proceeding it. For example 0/1 = 0, 1/1 = 1, 1/2 = 0.5, 2/3 = 0.666..., 3/5 = 0.6, 5/8 = 0.625, 8/13 = 0.6153..., 13/21 = 0.6190..., 21/34 = 0.6176..., 34/55 = 0.6181..., 55/89 = 0.6179..., 89/144 = 0.6180..., and so on.
1.618 is considered to be the 'golden ratio', found in many natural phenomena such as the growth of seashells and the branching of trees. Some now speculate the universe oscillates at a frequency of 0,618 Hz, which could help to explain such phenomena, but this theory has yet to be proven.
Traders and analysts use Fibonacci retracement and extension indicators, consisting of horizontal lines representing different Fibonacci ratios, for identifying potential levels of support and resistance. Fibonacci ranges are typically drawn from left to right, with retracement levels representing ratios inside of the current range and extension levels representing ratios extended outside of the current range. If the current wave cycle ends on a swing low, the Fibonacci range is drawn from peak to trough. If the current wave cycle ends on a swing high the Fibonacci range is drawn from trough to peak.
Harmonic Patterns
The concept of harmonic patterns in trading was first introduced by H.M. Gartley in his book "Profits in the Stock Market", published in 1935. Gartley observed that markets have a tendency to move in repetitive patterns, and he identified several specific patterns that he believed could be used to predict future price movements.
Since then, many other traders and analysts have built upon Gartley's work and developed their own variations of harmonic patterns. One such contributor is Larry Pesavento, who developed his own methods for measuring harmonic patterns using Fibonacci ratios. Pesavento has written several books on the subject of harmonic patterns and Fibonacci ratios in trading. Another notable contributor to harmonic patterns is Scott Carney, who developed his own approach to harmonic trading in the late 1990s and also popularised the use of Fibonacci ratios to measure harmonic patterns. Carney expanded on Gartley's work and also introduced several new harmonic patterns, such as the Shark pattern and the 5-0 pattern.
The bullish and bearish Gartley patterns are the oldest recognized harmonic patterns in trading and all the other harmonic patterns are ultimately modifications of the original Gartley patterns. Gartley patterns are fundamentally composed of 5 points, or 4 waves.
Bullish and Bearish Alternate Bat Patterns
• Bullish alternate bat patterns are fundamentally composed of three troughs and two peaks. The second peak being lower than the first peak and the second trough being higher than the first, with the third trough being lower than both the first and second troughs.
• Bearish alternate bat patterns are fundamentally composed of three peaks and two troughs. The second trough being higher than the first trough and the second peak being lower than the first, with the third peak being higher than both the first and second peaks.
The ratio measurements recommended by Scott Carney, who originated the pattern, are as follows:
• Wave 1 of the pattern, generally referred to as XA, has no specific ratio requirements.
• Wave 2 of the pattern, generally referred to as AB, should retrace to 38.2% of the range set by wave 1.
• Wave 3 of the pattern, generally referred to as BC, should retrace by at least 38.2%, but no further than 88.6% of the range set by wave 2.
• Wave 4 of the pattern, generally referred to as CD, should extend to at least 200%, but no further than 361.8% of the range set by wave 3.
• The last measure, generally referred to as AD, is that of wave 4 as a ratio of the range set by wave 1, which should extend to 113%.
Measurement Tolerances
In general, tolerance in measurements refers to the allowable variation or deviation from a specific value or dimension. It is the range within which a particular measurement is considered to be acceptable or accurate. In this script I have applied this concept to the measurement of harmonic pattern ratios to increase to the frequency of pattern occurrences.
For example, the AB measurement of Gartley patterns is generally set at around 61.8%, but with such specificity in the measuring requirements the patterns are very rare. We can increase the frequency of pattern occurrences by setting a tolerance. A tolerance of 10% to both downside and upside, which is the default setting for all tolerances, means we would have a tolerable measurement range between 51.8-71.8%, thus increasing the frequency of occurrence.
█ FEATURES
Inputs
• AB Lower Tolerance
• AB Upper Tolerance
• BC Lower Tolerance
• BC Upper Tolerance
• CD Lower Tolerance
• CD Upper Tolerance
• AD Lower Tolerance
• AD Upper Tolerance
• Pattern Color
• Label Color
• Show Projections
• Extend Current Projection Lines
Alerts
Users can set alerts for when the patterns occur.
█ LIMITATIONS
All green and red candle calculations are based on differences between open and close prices, as such I have made no attempt to account for green candles that gap lower and close below the close price of the preceding candle, or red candles that gap higher and close above the close price of the preceding candle. This may cause some unexpected behaviour on some markets and timeframes. I can only recommend using 24-hour markets, if and where possible, as there are far fewer gaps and, generally, more data to work with.
█ NOTES
A link to Scott's harmonic patterns webpage for anyone who may be interested: harmonictrader.com/harmonic-patterns/
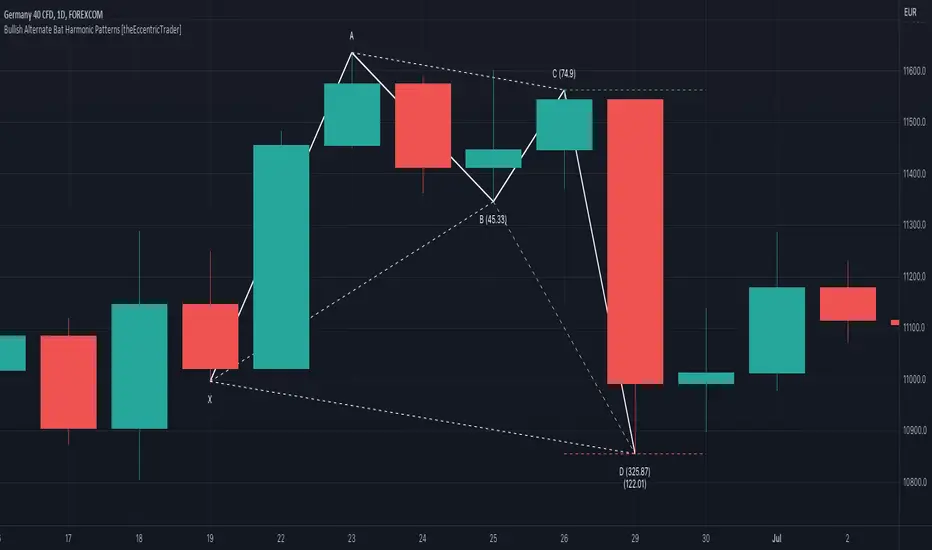
Risk Reward Calculator [lovealgotrading]
OVERVIEW:
This Risk Reward Calculator strategy can help you maximize your RR value with help of algorithmic trading.
INDICATOR:
I wanted to setup my trades more easier with this indicator, I didn't want to calculate everytime before orders, with help this indicator we can calculate R:R value, avarage price, stoploss price, take-profit price, order prices, all position cost and more ...
Our strategy is a risk revard calculation indicator that is made easy to use by using visualized lines and panels, and also has algorithmic trading support.
With the help of this indicator, we can quickly and easily calculate our risk reward values and enter the positions.
If we want to ensure that our balance grows regularly while trading in the stock market, we need to manage the risks and rewards otherwise we may fall below our initial balance at the end of the day, even if we seem to be winning.
What is the Risk-Reward value ?
This value is a value that shows how many times the amount of risk we take when entering the position is successful, we will earn.
- For example, you risked $100 while entering the trade, so if your trade stops, you will lose 100 $.
Your Risk-Reward(RR) value is 2 means that if your position is successful, you will have 200 $ in your pocket.
A trader's success is determined by the amount of R he earns monthly or yearly, not how much money he makes.
What is different in this indicator ?
I want to say thank you to © EvoCrypto. His Calculator (weighted) – evo indicator helped me when I was developed my indicator.
I want to explain what I have improved:
1-In this strategy, we can determine the time period in which we want to open our positions.
2-We can open a maximum of 4 positions in the same direction and close our positions at a single level. StopLoss or TakeProfit
3-This indicator, which works in the form of a strategy, shows where our positions have been opened or closed. With the help of this, it helps us to determine our strategy in our future positions more accurately.
4-The most important improvement is that we do not miss our positions with the help of alarms (WEB HOOK). if we want, we receive by quickly connecting all these positions to our robot, the software can enter and exit the position while we are busy.
IMPLEMENTATION DETAILS – SETTINGS:
1 - We can set the start and end dates of the positions we will take.
2- We can set our take profit, stoploss levels.
3- If your trade is stopped, we can determine the amount of the trade that we will lose.
4- We can adjust our entry levels to positions and our position sizes at entry levels.
(Sum of positions weight must be 100%)
5- We can receive our positions even if we are busy with the help of algorithmic trading. For this, we must paste our Jshon codes into the fields specified in the settings panel.
6- Finally, we can change the settings we want and don't want to have in our visual elements.
Let's make a LONG side example together
We have determined our positions to enter stoploss, take profit and long positions. We did not forget to set the start time of our strategy
Our strategy appear on the graph as follows.
Our strategy has calculated the total position size, our R-R value, the distance of the current price to the stop and take profit levels, in short, a lot of things we could look visually.
Notes:
If you're going to connect this bot to an automatic Long or Short direction,
Don’t forget! you need to Webhook URL,
Don’t miss paste this code to your message window {{strategy.order.alert_message}}
ALSO:
If you have any ideas what to add to my work to add more sources or make calculations cooler, feel free to write me.

Bearish 5-0 Harmonic Patterns [theEccentricTrader]█ OVERVIEW
This indicator automatically draws bearish 5-0 harmonic patterns and price projections derived from the ranges that constitute the patterns.
█ CONCEPTS
Green and Red Candles
• A green candle is one that closes with a close price equal to or above the price it opened.
• A red candle is one that closes with a close price that is lower than the price it opened.
Swing Highs and Swing Lows
• A swing high is a green candle or series of consecutive green candles followed by a single red candle to complete the swing and form the peak.
• A swing low is a red candle or series of consecutive red candles followed by a single green candle to complete the swing and form the trough.
Peak and Trough Prices (Basic)
• The peak price of a complete swing high is the high price of either the red candle that completes the swing high or the high price of the preceding green candle, depending on which is higher.
• The trough price of a complete swing low is the low price of either the green candle that completes the swing low or the low price of the preceding red candle, depending on which is lower.
Historic Peaks and Troughs
The current, or most recent, peak and trough occurrences are referred to as occurrence zero. Previous peak and trough occurrences are referred to as historic and ordered numerically from right to left, with the most recent historic peak and trough occurrences being occurrence one.
Range
The range is simply the difference between the current peak and current trough prices, generally expressed in terms of points or pips.
Support and Resistance
• Support refers to a price level where the demand for an asset is strong enough to prevent the price from falling further.
• Resistance refers to a price level where the supply of an asset is strong enough to prevent the price from rising further.
Support and resistance levels are important because they can help traders identify where the price of an asset might pause or reverse its direction, offering potential entry and exit points. For example, a trader might look to buy an asset when it approaches a support level , with the expectation that the price will bounce back up. Alternatively, a trader might look to sell an asset when it approaches a resistance level , with the expectation that the price will drop back down.
It's important to note that support and resistance levels are not always relevant, and the price of an asset can also break through these levels and continue moving in the same direction.
Upper Trends
• A return line uptrend is formed when the current peak price is higher than the preceding peak price.
• A downtrend is formed when the current peak price is lower than the preceding peak price.
• A double-top is formed when the current peak price is equal to the preceding peak price.
Lower Trends
• An uptrend is formed when the current trough price is higher than the preceding trough price.
• A return line downtrend is formed when the current trough price is lower than the preceding trough price.
• A double-bottom is formed when the current trough price is equal to the preceding trough price.
Muti-Part Upper and Lower Trends
• A multi-part return line uptrend begins with the formation of a new return line uptrend, or higher peak, and continues until a new downtrend, or lower peak, completes the trend.
• A multi-part downtrend begins with the formation of a new downtrend, or lower peak, and continues until a new return line uptrend, or higher peak, completes the trend.
• A multi-part uptrend begins with the formation of a new uptrend, or higher trough, and continues until a new return line downtrend, or lower trough, completes the trend.
• A multi-part return line downtrend begins with the formation of a new return line downtrend, or lower trough, and continues until a new uptrend, or higher trough, completes the trend.
Wave Cycles
A wave cycle is here defined as a complete two-part move between a swing high and a swing low, or a swing low and a swing high. The first swing high or swing low will set the course for the sequence of wave cycles that follow; for example a chart that begins with a swing low will form its first complete wave cycle upon the formation of the first complete swing high and vice versa.
Figure 1.
Fibonacci Retracement and Extension Ratios
The Fibonacci sequence is a series of numbers in which each number is the sum of the two preceding numbers, starting with 0 and 1. For example 0 + 1 = 1, 1 + 1 = 2, 1 + 2 = 3, and so on. Ultimately, we could go on forever but the first few numbers in the sequence are as follows: 0 , 1, 1, 2, 3, 5, 8, 13, 21, 34, 55, 89, 144.
The extension ratios are calculated by dividing each number in the sequence by the number preceding it. For example 0/1 = 0, 1/1 = 1, 2/1 = 2, 3/2 = 1.5, 5/3 = 1.6666..., 8/5 = 1.6, 13/8 = 1.625, 21/13 = 1.6153..., 34/21 = 1.6190..., 55/34 = 1.6176..., 89/55 = 1.6181..., 144/89 = 1.6179..., and so on. The retracement ratios are calculated by inverting this process and dividing each number in the sequence by the number proceeding it. For example 0/1 = 0, 1/1 = 1, 1/2 = 0.5, 2/3 = 0.666..., 3/5 = 0.6, 5/8 = 0.625, 8/13 = 0.6153..., 13/21 = 0.6190..., 21/34 = 0.6176..., 34/55 = 0.6181..., 55/89 = 0.6179..., 89/144 = 0.6180..., and so on.
1.618 is considered to be the 'golden ratio', found in many natural phenomena such as the growth of seashells and the branching of trees. Some now speculate the universe oscillates at a frequency of 0,618 Hz, which could help to explain such phenomena, but this theory has yet to be proven.
Traders and analysts use Fibonacci retracement and extension indicators, consisting of horizontal lines representing different Fibonacci ratios, for identifying potential levels of support and resistance. Fibonacci ranges are typically drawn from left to right, with retracement levels representing ratios inside of the current range and extension levels representing ratios extended outside of the current range. If the current wave cycle ends on a swing low, the Fibonacci range is drawn from peak to trough. If the current wave cycle ends on a swing high the Fibonacci range is drawn from trough to peak.
Harmonic Patterns
The concept of harmonic patterns in trading was first introduced by H.M. Gartley in his book "Profits in the Stock Market", published in 1935. Gartley observed that markets have a tendency to move in repetitive patterns, and he identified several specific patterns that he believed could be used to predict future price movements.
Since then, many other traders and analysts have built upon Gartley's work and developed their own variations of harmonic patterns. One such contributor is Larry Pesavento, who developed his own methods for measuring harmonic patterns using Fibonacci ratios. Pesavento has written several books on the subject of harmonic patterns and Fibonacci ratios in trading. Another notable contributor to harmonic patterns is Scott Carney, who developed his own approach to harmonic trading in the late 1990s and also popularised the use of Fibonacci ratios to measure harmonic patterns. Carney expanded on Gartley's work and also introduced several new harmonic patterns, such as the Shark pattern and the 5-0 pattern.
The bullish and bearish Gartley patterns are the oldest recognized harmonic patterns in trading and all the other harmonic patterns are ultimately modifications of the original Gartley patterns. Gartley patterns are fundamentally composed of 5 points, or 4 waves.
Bullish and Bearish 5-0 Patterns
• Bullish 5-0 patterns are fundamentally composed of three peaks and three troughs, with the second peak being lower than the first peak and the third peak being higher than the first peak. And similarly, the second trough being lower than the first trough and the third trough being higher than both the first and second troughs.
• Bearish 5-0 patterns are fundamentally composed of three troughs and three peaks, with the second trough being higher than the first trough and the third trough being lower than the first trough. And similarly, the second peak being higher than the first peak and the third peak being lower than both the first and second peaks.
The ratio measurements recommended by Scott Carney, who originated the pattern, are as follows:
• Wave 1 of the pattern, referred to as OX, has no specific ratio requirements.
• Wave 2 of the pattern, referred to as XA, has no specific ratio requirements.
• Wave 3 of the pattern, referred to as AB, should extend to at least 113%, but no further than 161.8% of the range set by wave 2.
• Wave 4 of the pattern, referred to as BC, should extend to at least 161.8%, but no further than 224% of the range set by wave 3.
• Wave 5 of the pattern, referred to as CD, should retrace to 50.0% of the range set by wave 4.
Measurement Tolerances
In general, tolerance in measurements refers to the allowable variation or deviation from a specific value or dimension. It is the range within which a particular measurement is considered to be acceptable or accurate. In this script I have applied this concept to the measurement of harmonic pattern ratios to increase to the frequency of pattern occurrences.
For example, the AB measurement of Gartley patterns is generally set at around 61.8%, but with such specificity in the measuring requirements the patterns are very rare. We can increase the frequency of pattern occurrences by setting a tolerance. A tolerance of 10% to both downside and upside, which is the default setting for all tolerances, means we would have a tolerable measurement range between 51.8-71.8%, thus increasing the frequency of occurrence.
█ FEATURES
Inputs
• AB Lower Tolerance
• AB Upper Tolerance
• BC Lower Tolerance
• BC Upper Tolerance
• CD Lower Tolerance
• CD Upper Tolerance
• Pattern Color
• Label Color
• Show Projections
• Extend Current Projection Lines
█ LIMITATIONS
All green and red candle calculations are based on differences between open and close prices, as such I have made no attempt to account for green candles that gap lower and close below the close price of the preceding candle, or red candles that gap higher and close above the close price of the preceding candle. This may cause some unexpected behaviour on some markets and timeframes. I can only recommend using 24-hour markets, if and where possible, as there are far fewer gaps and, generally, more data to work with.
█ NOTES
Here is a link to Scott's harmonic patterns webpage for those who may be interested: harmonictrader.com
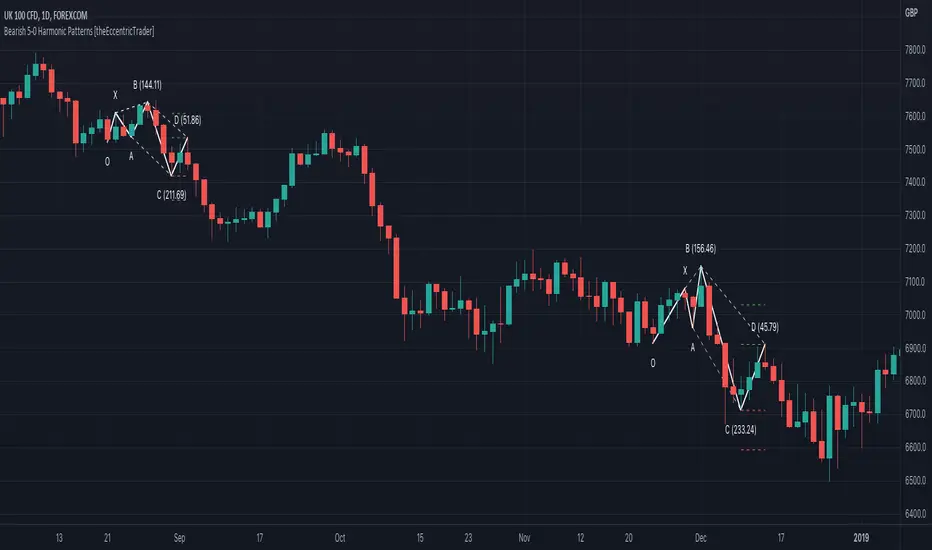
Bullish 5-0 Harmonic Patterns [theEccentricTrader]█ OVERVIEW
This indicator automatically draws bullish 5-0 harmonic patterns and price projections derived from the ranges that constitute the patterns.
█ CONCEPTS
Green and Red Candles
• A green candle is one that closes with a close price equal to or above the price it opened.
• A red candle is one that closes with a close price that is lower than the price it opened.
Swing Highs and Swing Lows
• A swing high is a green candle or series of consecutive green candles followed by a single red candle to complete the swing and form the peak.
• A swing low is a red candle or series of consecutive red candles followed by a single green candle to complete the swing and form the trough.
Peak and Trough Prices (Basic)
• The peak price of a complete swing high is the high price of either the red candle that completes the swing high or the high price of the preceding green candle, depending on which is higher.
• The trough price of a complete swing low is the low price of either the green candle that completes the swing low or the low price of the preceding red candle, depending on which is lower.
Historic Peaks and Troughs
The current, or most recent, peak and trough occurrences are referred to as occurrence zero. Previous peak and trough occurrences are referred to as historic and ordered numerically from right to left, with the most recent historic peak and trough occurrences being occurrence one.
Range
The range is simply the difference between the current peak and current trough prices, generally expressed in terms of points or pips.
Support and Resistance
• Support refers to a price level where the demand for an asset is strong enough to prevent the price from falling further.
• Resistance refers to a price level where the supply of an asset is strong enough to prevent the price from rising further.
Support and resistance levels are important because they can help traders identify where the price of an asset might pause or reverse its direction, offering potential entry and exit points. For example, a trader might look to buy an asset when it approaches a support level , with the expectation that the price will bounce back up. Alternatively, a trader might look to sell an asset when it approaches a resistance level , with the expectation that the price will drop back down.
It's important to note that support and resistance levels are not always relevant, and the price of an asset can also break through these levels and continue moving in the same direction.
Upper Trends
• A return line uptrend is formed when the current peak price is higher than the preceding peak price.
• A downtrend is formed when the current peak price is lower than the preceding peak price.
• A double-top is formed when the current peak price is equal to the preceding peak price.
Lower Trends
• An uptrend is formed when the current trough price is higher than the preceding trough price.
• A return line downtrend is formed when the current trough price is lower than the preceding trough price.
• A double-bottom is formed when the current trough price is equal to the preceding trough price.
Muti-Part Upper and Lower Trends
• A multi-part return line uptrend begins with the formation of a new return line uptrend, or higher peak, and continues until a new downtrend, or lower peak, completes the trend.
• A multi-part downtrend begins with the formation of a new downtrend, or lower peak, and continues until a new return line uptrend, or higher peak, completes the trend.
• A multi-part uptrend begins with the formation of a new uptrend, or higher trough, and continues until a new return line downtrend, or lower trough, completes the trend.
• A multi-part return line downtrend begins with the formation of a new return line downtrend, or lower trough, and continues until a new uptrend, or higher trough, completes the trend.
Wave Cycles
A wave cycle is here defined as a complete two-part move between a swing high and a swing low, or a swing low and a swing high. The first swing high or swing low will set the course for the sequence of wave cycles that follow; for example a chart that begins with a swing low will form its first complete wave cycle upon the formation of the first complete swing high and vice versa.
Figure 1.
Fibonacci Retracement and Extension Ratios
The Fibonacci sequence is a series of numbers in which each number is the sum of the two preceding numbers, starting with 0 and 1. For example 0 + 1 = 1, 1 + 1 = 2, 1 + 2 = 3, and so on. Ultimately, we could go on forever but the first few numbers in the sequence are as follows: 0 , 1, 1, 2, 3, 5, 8, 13, 21, 34, 55, 89, 144.
The extension ratios are calculated by dividing each number in the sequence by the number preceding it. For example 0/1 = 0, 1/1 = 1, 2/1 = 2, 3/2 = 1.5, 5/3 = 1.6666..., 8/5 = 1.6, 13/8 = 1.625, 21/13 = 1.6153..., 34/21 = 1.6190..., 55/34 = 1.6176..., 89/55 = 1.6181..., 144/89 = 1.6179..., and so on. The retracement ratios are calculated by inverting this process and dividing each number in the sequence by the number proceeding it. For example 0/1 = 0, 1/1 = 1, 1/2 = 0.5, 2/3 = 0.666..., 3/5 = 0.6, 5/8 = 0.625, 8/13 = 0.6153..., 13/21 = 0.6190..., 21/34 = 0.6176..., 34/55 = 0.6181..., 55/89 = 0.6179..., 89/144 = 0.6180..., and so on.
1.618 is considered to be the 'golden ratio', found in many natural phenomena such as the growth of seashells and the branching of trees. Some now speculate the universe oscillates at a frequency of 0,618 Hz, which could help to explain such phenomena, but this theory has yet to be proven.
Traders and analysts use Fibonacci retracement and extension indicators, consisting of horizontal lines representing different Fibonacci ratios, for identifying potential levels of support and resistance. Fibonacci ranges are typically drawn from left to right, with retracement levels representing ratios inside of the current range and extension levels representing ratios extended outside of the current range. If the current wave cycle ends on a swing low, the Fibonacci range is drawn from peak to trough. If the current wave cycle ends on a swing high the Fibonacci range is drawn from trough to peak.
Harmonic Patterns
The concept of harmonic patterns in trading was first introduced by H.M. Gartley in his book "Profits in the Stock Market", published in 1935. Gartley observed that markets have a tendency to move in repetitive patterns, and he identified several specific patterns that he believed could be used to predict future price movements.
Since then, many other traders and analysts have built upon Gartley's work and developed their own variations of harmonic patterns. One such contributor is Larry Pesavento, who developed his own methods for measuring harmonic patterns using Fibonacci ratios. Pesavento has written several books on the subject of harmonic patterns and Fibonacci ratios in trading. Another notable contributor to harmonic patterns is Scott Carney, who developed his own approach to harmonic trading in the late 1990s and also popularised the use of Fibonacci ratios to measure harmonic patterns. Carney expanded on Gartley's work and also introduced several new harmonic patterns, such as the Shark pattern and the 5-0 pattern.
The bullish and bearish Gartley patterns are the oldest recognized harmonic patterns in trading and all the other harmonic patterns are ultimately modifications of the original Gartley patterns. Gartley patterns are fundamentally composed of 5 points, or 4 waves.
Bullish and Bearish 5-0 Patterns
• Bullish 5-0 patterns are fundamentally composed of three peaks and three troughs, with the second peak being lower than the first peak and the third peak being higher than the first peak. And similarly, the second trough being lower than the first trough and the third trough being higher than both the first and second troughs.
• Bearish 5-0 patterns are fundamentally composed of three troughs and three peaks, with the second trough being higher than the first trough and the third trough being lower than the first trough. And similarly, the second peak being higher than the first peak and the third peak being lower than both the first and second peaks.
The ratio measurements recommended by Scott Carney, who originated the pattern, are as follows:
• Wave 1 of the pattern, referred to as OX, has no specific ratio requirements.
• Wave 2 of the pattern, referred to as XA, has no specific ratio requirements.
• Wave 3 of the pattern, referred to as AB, should extend to at least 113%, but no further than 161.8% of the range set by wave 2.
• Wave 4 of the pattern, referred to as BC, should extend to at least 161.8%, but no further than 224% of the range set by wave 3.
• Wave 5 of the pattern, referred to as CD, should retrace to 50.0% of the range set by wave 4.
Measurement Tolerances
In general, tolerance in measurements refers to the allowable variation or deviation from a specific value or dimension. It is the range within which a particular measurement is considered to be acceptable or accurate. In this script I have applied this concept to the measurement of harmonic pattern ratios to increase to the frequency of pattern occurrences.
For example, the AB measurement of Gartley patterns is generally set at around 61.8%, but with such specificity in the measuring requirements the patterns are very rare. We can increase the frequency of pattern occurrences by setting a tolerance. A tolerance of 10% to both downside and upside, which is the default setting for all tolerances, means we would have a tolerable measurement range between 51.8-71.8%, thus increasing the frequency of occurrence.
█ FEATURES
Inputs
• AB Lower Tolerance
• AB Upper Tolerance
• BC Lower Tolerance
• BC Upper Tolerance
• CD Lower Tolerance
• CD Upper Tolerance
• Pattern Color
• Label Color
• Show Projections
• Extend Current Projection Lines
█ LIMITATIONS
All green and red candle calculations are based on differences between open and close prices, as such I have made no attempt to account for green candles that gap lower and close below the close price of the preceding candle, or red candles that gap higher and close above the close price of the preceding candle. This may cause some unexpected behaviour on some markets and timeframes. I can only recommend using 24-hour markets, if and where possible, as there are far fewer gaps and, generally, more data to work with.
█ NOTES
Here is a link to Scott's harmonic patterns webpage for those who may be interested: harmonictrader.com

Bearish Shark Harmonic Patterns [theEccentricTrader]█ OVERVIEW
This indicator automatically draws bearish Shark harmonic patterns and price projections derived from the ranges that constitute the patterns.
█ CONCEPTS
Green and Red Candles
• A green candle is one that closes with a close price equal to or above the price it opened.
• A red candle is one that closes with a close price that is lower than the price it opened.
Swing Highs and Swing Lows
• A swing high is a green candle or series of consecutive green candles followed by a single red candle to complete the swing and form the peak.
• A swing low is a red candle or series of consecutive red candles followed by a single green candle to complete the swing and form the trough.
Peak and Trough Prices (Basic)
• The peak price of a complete swing high is the high price of either the red candle that completes the swing high or the high price of the preceding green candle, depending on which is higher.
• The trough price of a complete swing low is the low price of either the green candle that completes the swing low or the low price of the preceding red candle, depending on which is lower.
Historic Peaks and Troughs
The current, or most recent, peak and trough occurrences are referred to as occurrence zero. Previous peak and trough occurrences are referred to as historic and ordered numerically from right to left, with the most recent historic peak and trough occurrences being occurrence one.
Range
The range is simply the difference between the current peak and current trough prices, generally expressed in terms of points or pips.
Support and Resistance
• Support refers to a price level where the demand for an asset is strong enough to prevent the price from falling further.
• Resistance refers to a price level where the supply of an asset is strong enough to prevent the price from rising further.
Support and resistance levels are important because they can help traders identify where the price of an asset might pause or reverse its direction, offering potential entry and exit points. For example, a trader might look to buy an asset when it approaches a support level , with the expectation that the price will bounce back up. Alternatively, a trader might look to sell an asset when it approaches a resistance level , with the expectation that the price will drop back down.
It's important to note that support and resistance levels are not always relevant, and the price of an asset can also break through these levels and continue moving in the same direction.
Upper Trends
• A return line uptrend is formed when the current peak price is higher than the preceding peak price.
• A downtrend is formed when the current peak price is lower than the preceding peak price.
• A double-top is formed when the current peak price is equal to the preceding peak price.
Lower Trends
• An uptrend is formed when the current trough price is higher than the preceding trough price.
• A return line downtrend is formed when the current trough price is lower than the preceding trough price.
• A double-bottom is formed when the current trough price is equal to the preceding trough price.
Muti-Part Upper and Lower Trends
• A multi-part return line uptrend begins with the formation of a new return line uptrend, or higher peak, and continues until a new downtrend, or lower peak, completes the trend.
• A multi-part downtrend begins with the formation of a new downtrend, or lower peak, and continues until a new return line uptrend, or higher peak, completes the trend.
• A multi-part uptrend begins with the formation of a new uptrend, or higher trough, and continues until a new return line downtrend, or lower trough, completes the trend.
• A multi-part return line downtrend begins with the formation of a new return line downtrend, or lower trough, and continues until a new uptrend, or higher trough, completes the trend.
Wave Cycles
A wave cycle is here defined as a complete two-part move between a swing high and a swing low, or a swing low and a swing high. The first swing high or swing low will set the course for the sequence of wave cycles that follow; for example a chart that begins with a swing low will form its first complete wave cycle upon the formation of the first complete swing high and vice versa.
Figure 1.
Fibonacci Retracement and Extension Ratios
The Fibonacci sequence is a series of numbers in which each number is the sum of the two preceding numbers, starting with 0 and 1. For example 0 + 1 = 1, 1 + 1 = 2, 1 + 2 = 3, and so on. Ultimately, we could go on forever but the first few numbers in the sequence are as follows: 0 , 1, 1, 2, 3, 5, 8, 13, 21, 34, 55, 89, 144.
The extension ratios are calculated by dividing each number in the sequence by the number preceding it. For example 0/1 = 0, 1/1 = 1, 2/1 = 2, 3/2 = 1.5, 5/3 = 1.6666..., 8/5 = 1.6, 13/8 = 1.625, 21/13 = 1.6153..., 34/21 = 1.6190..., 55/34 = 1.6176..., 89/55 = 1.6181..., 144/89 = 1.6179..., and so on. The retracement ratios are calculated by inverting this process and dividing each number in the sequence by the number proceeding it. For example 0/1 = 0, 1/1 = 1, 1/2 = 0.5, 2/3 = 0.666..., 3/5 = 0.6, 5/8 = 0.625, 8/13 = 0.6153..., 13/21 = 0.6190..., 21/34 = 0.6176..., 34/55 = 0.6181..., 55/89 = 0.6179..., 89/144 = 0.6180..., and so on.
1.618 is considered to be the 'golden ratio', found in many natural phenomena such as the growth of seashells and the branching of trees. Some now speculate the universe oscillates at a frequency of 0,618 Hz, which could help to explain such phenomena, but this theory has yet to be proven.
Traders and analysts use Fibonacci retracement and extension indicators, consisting of horizontal lines representing different Fibonacci ratios, for identifying potential levels of support and resistance. Fibonacci ranges are typically drawn from left to right, with retracement levels representing ratios inside of the current range and extension levels representing ratios extended outside of the current range. If the current wave cycle ends on a swing low, the Fibonacci range is drawn from peak to trough. If the current wave cycle ends on a swing high the Fibonacci range is drawn from trough to peak.
Harmonic Patterns
The concept of harmonic patterns in trading was first introduced by H.M. Gartley in his book "Profits in the Stock Market", published in 1935. Gartley observed that markets have a tendency to move in repetitive patterns, and he identified several specific patterns that he believed could be used to predict future price movements.
Since then, many other traders and analysts have built upon Gartley's work and developed their own variations of harmonic patterns. One such contributor is Larry Pesavento, who developed his own methods for measuring harmonic patterns using Fibonacci ratios. Pesavento has written several books on the subject of harmonic patterns and Fibonacci ratios in trading. Another notable contributor to harmonic patterns is Scott Carney, who developed his own approach to harmonic trading in the late 1990s and also popularised the use of Fibonacci ratios to measure harmonic patterns. Carney expanded on Gartley's work and also introduced several new harmonic patterns, such as the Shark pattern and the 5-0 pattern.
The bullish and bearish Gartley patterns are the oldest recognized harmonic patterns in trading and all the other harmonic patterns are ultimately modifications of the original Gartley patterns. Gartley patterns are fundamentally composed of 5 points, or 4 waves.
Bullish and Bearish Shark Patterns
• Bullish shark patterns are fundamentally composed of three troughs and two peaks, with the second peak being higher than the first peak and the second trough being higher than the first trough. The third trough must be lower than the second trough but can be above or below the first trough providing it meets the ratio requirements.
• Bearish shark patterns are fundamentally composed of three peaks and two troughs, with the second trough being lower than the first trough and the second peak being lower than the first peak. The third peak must be higher than the second peak but can be above or below the first peak providing it meets the ratio requirements.
The ratio measurements recommended by Scott Carney, who originated the pattern, are as follows:
• Wave 1 of the pattern, referred to as OX, has no specific ratio requirements.
• Wave 2 of the pattern, referred to as XA, has no specific ratio requirements.
• Wave 3 of the pattern, referred to as AB, should extend to at least 113%, but no further than 161.8% of the range set by wave 2.
• Wave 4 of the pattern, referred to as BC, should extend to at least 161.8%, but no further than 224% of the range set by wave 3.
• The last measure, referred to as XC, is that of wave 4 as a ratio of the range set by wave 1, which should extend to at least 88.6%, but no further than 113%.
Measurement Tolerances
In general, tolerance in measurements refers to the allowable variation or deviation from a specific value or dimension. It is the range within which a particular measurement is considered to be acceptable or accurate. In this script I have applied this concept to the measurement of harmonic pattern ratios to increase to the frequency of pattern occurrences.
For example, the AB measurement of Gartley patterns is generally set at around 61.8%, but with such specificity in the measuring requirements the patterns are very rare. We can increase the frequency of pattern occurrences by setting a tolerance. A tolerance of 10% to both downside and upside, which is the default setting for all tolerances, means we would have a tolerable measurement range between 51.8-71.8%, thus increasing the frequency of occurrence.
█ FEATURES
Inputs
• AB Lower Tolerance
• AB Upper Tolerance
• BC Lower Tolerance
• BC Upper Tolerance
• XC Lower Tolerance
• XC Upper Tolerance
• Pattern Color
• Label Color
• Show Projections
• Extend Current Projection Lines
█ LIMITATIONS
All green and red candle calculations are based on differences between open and close prices, as such I have made no attempt to account for green candles that gap lower and close below the close price of the preceding candle, or red candles that gap higher and close above the close price of the preceding candle. This may cause some unexpected behaviour on some markets and timeframes. I can only recommend using 24-hour markets, if and where possible, as there are far fewer gaps and, generally, more data to work with.
█ NOTES
Here is a link to Scott's harmonic patterns webpage for those who may be interested: harmonictrader.com