MAX1 Ord. Volatility Market ScannerScan volatility of 40 pair, print result in label ordered form higher or lower volatility
Use it in combination with MAX2 Ord. Volatility Market Scanner for have 80 coin scan
Cari dalam skrip untuk "order"

(IK) Grid ScriptThis is my take on a grid trading strategy. From Investopedia:
"Grid trading is most commonly associated with the foreign exchange market. Overall the technique seeks to capitalize on normal price volatility in an asset by placing buy and sell orders at certain regular intervals above and below a predefined base price."
This strategy is best used on sideways markets, without a definitive up or down major trend. Because it doesn't rely on huge vertical movement, this strategy is great for small timeframes. It only goes long. I've set initial_capital to 100 USD. default_qty_value should be your initial capital divided by your amount of grid lines. I'm also assuming a 0.1% commission per trade.
Here's the basic algorithm:
- Create a grid based on an upper-bound (strong resistance) and a lower-bound (strong support)
- Grid lines are spaced evenly between these two bounds. (I recommend anywhere between 5-10 grid lines, but this script lets you use up to 15. More gridlines = more/smaller trades)
- Identify nearest gridline above and below current price (ignoring the very closest grid line)
- If price crosses under a near gridline, buy and recalculate near gridlines
- If price crosses over a near gridline, sell and recalculate near gridlines
- Trades are entered and exited based on a FIFO system. So if price falls 3 grid lines (buy-1, buy-2, buy-3), and subsequently crosses above one grid line, only the first trade will exit (sell-1). If it falls again, it will enter a new trade (buy-4), and if it crosses above again it will sell the original second trade (sell-2). The amount of trades you can be in at once are based on the amount of grid lines you have.
This strategy has no built-in stop loss! This is not a 'set-it-and-forget-it" script. Make sure that price remains within the bounds of your grid. If prices exits above the grid, you're in the money, but you won't be making any more trades. If price exits below the grid, you're 100% staked in whatever you happen to be trading.
This script is more complicated than my last one, but should be more user friendly. Make sure to correctly set your lower-bound and upper-bound based on strong support and resistance (the default values for these are probably going to be meaningless). If you change your "Grid Quantity" (amount of grid lines) make sure to also change your 'Order Size' property under settings for proper test results (or default_qty_value in the strategy() declaration).

TSI HMA CCIHi!
This strategy has TSI and CCI indicators with the CCI being based on a HMA instead of the Price.
There is a number of conditions that must combine to create buy or sell signals, but it is basically a couple of MA crossovers.
The strategy opens new orders on each candle if the conditions are met, Either direction, so it is hedging.
It wont open new orders if there is a floating loss, and so is constantly attempting to hold a floating profit (drawup instead of drawdown)
But It has a StopLoss (set by user) for closing of losing orders, and it closes all orders in basket style when account is in profit to users set amount target profit.
Low commission set to simulate swap but Forex pairs generally dont have commission like the crypto exchanges do. So if you use this on cryptos, remember to increase the commission to your brokers amount.
Crypto users will likely find that because this opens so many orders the commission could erase its profits.
So i recommend this for Forex only, and perhaps, only NZDUSD 4H chart. other pairs, change settings for.
The strategy has settings for testing on target time spans, so you could test it on just Jan-Feb 2020 for example, if you want, or from Jan 2020 to present day.
Have Fun! Open Script for copy/paste/edit/publish your own version :)

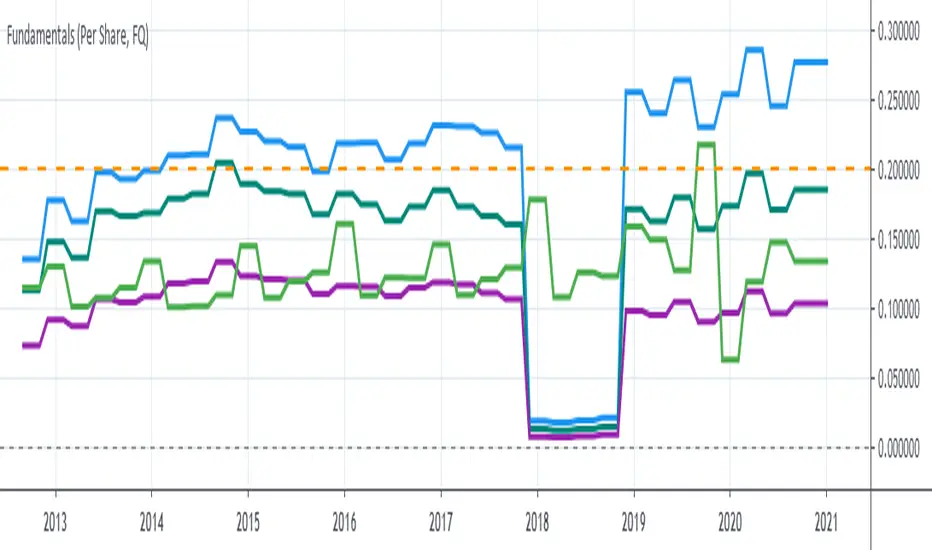
P1 FundamentalsP1 is because to me, this is a priority 1 indicator, so I have P1 and P2 indicators ordered on the favorite list.
What can you check on the selection pane?
On “period”, you can show the data related to:
the fiscal quarters
or the fiscal years.
You can select a pack of financial data that I have organized in sections:
Revenue & earnings
EPS & DPS (EPS, EPS estimate, DPS and dividend payout ratio )
Debt (total debt, total equity and cash & equivalents)
Returns (ROE, ROIC, ROA and R&D revenue to ratio)
I recommend to just select one of them, in other case the chart is a mess.
Any feedback on the code is welcome!!
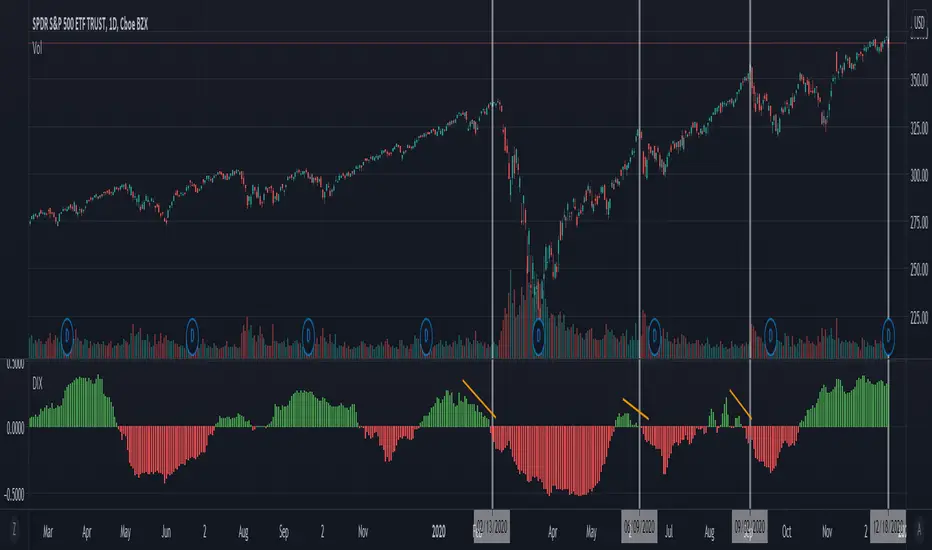
Dix / Dark Pool Oscillator [Nic]Dark pools are private exchanges for trading securities that are not accessible by the investing public. Dark pools were created in order to facilitate block trading by institutional investors who did not wish to impact the markets with their large orders and obtain adverse prices for their trades.
This indicator creates an easy to read oscillator so you can Identify these flows.
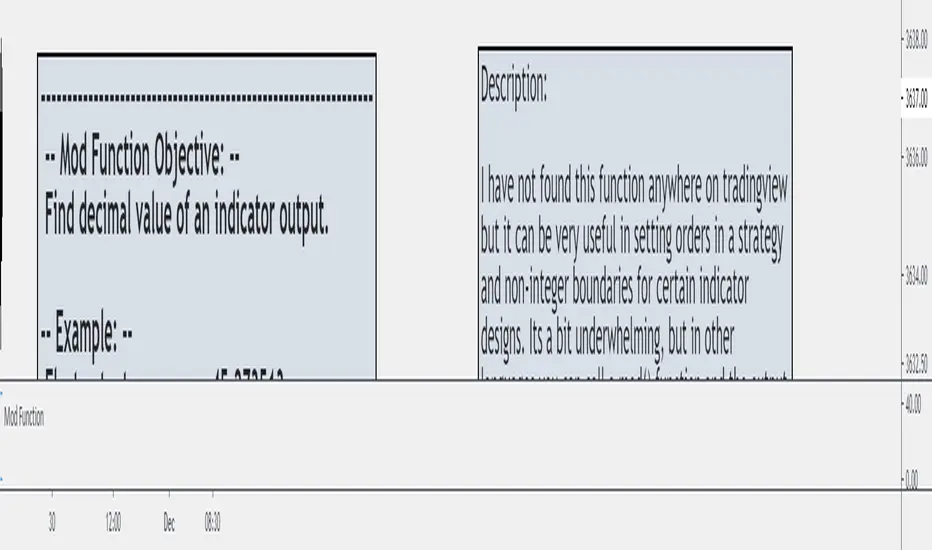
Mod and Round To Tick FunctionI have not found this function anywhere on Tradingview but it can be very useful in setting orders in a strategy and non-integer boundaries for certain indicator designs. Its a bit underwhelming, but in other languages you can call a mod() function and the output will be the remainder of the integer.
If you want to set an order at a specific tick value, particularly in futures, you can't set it at a specific tick when using calculated values like ATR or Standard Deviation without a function like this.
It can also be used to clean up certain band/envelope style indicators if you want to have a straight line, but don't want to simply round to an integer.
Credit for the round to tick aspect goes to the eternal fountain of resources, the Backtesting & Trading Engine script from @pinecoders
This is just another tool to throw in the box for when you might need it.
Tame Polynomial LSMA EstimationExperimental Script!
Big thanks to alexgrover for his original Polynomial LSMA Estimation script.
I liked the concept and thought about how to make it behave more like a moving average, with less overshoot.
My idea is to use "sigma approximation" to tame the kernel. Hence the name of this script.
Higher "orders" will make the filter stick closer to the price.
You might notice that with an order of 2 or 3, it behaves more like a traditional moving average, with reduced lag.
Note: This is my first publication. I didn't have enough reputation to post images with it.
Once again, much thanks to alexgrover and the TradingView community!

Universal Global SessionUniversal Global Session
This Script combines the world sessions of: Stocks, Forex, Bitcoin Kill Zones, strategic points, all configurable, in a single Script, to capitalize the opening and closing times of global exchanges as investment assets, becoming an Universal Global Session .
It is based on the great work of @oscarvs ( BITCOIN KILL ZONES v2 ) and the scripts of @ChrisMoody. Thank you Oscar and Chris for your excellent judgment and great work.
At the end of this writing you can find all the internet references of the extensive documentation that I present here. To maximize your benefits in the use of this Script, I recommend that you read the entire document to create an objective and practical criterion.
All the hours of the different exchanges are presented at GMT -6. In Market24hClock you can adjust it to your preferences.
After a deep investigation I have been able to show that the different world sessions reveal underlying investment cycles, where it is possible to find sustained changes in the nominal behavior of the trend before the passage from one session to another and in the natural overlaps between the sessions. These underlying movements generally occur 15 minutes before the start, close or overlap of the session, when the session properly starts and also 15 minutes after respectively. Therefore, this script is designed to highlight these particular trending behaviors. Try it, discover your own conclusions and let me know in the notes, thank you.
Foreign Exchange Market Hours
It is the schedule by which currency market participants can buy, sell, trade and speculate on currencies all over the world. It is open 24 hours a day during working days and closes on weekends, thanks to the fact that operations are carried out through a network of information systems, instead of physical exchanges that close at a certain time. It opens Monday morning at 8 am local time in Sydney —Australia— (which is equivalent to Sunday night at 7 pm, in New York City —United States—, according to Eastern Standard Time), and It closes at 5pm local time in New York City (which is equivalent to 6am Saturday morning in Sydney).
The Forex market is decentralized and driven by local sessions, where the hours of Forex trading are based on the opening range of each active country, becoming an efficient transfer mechanism for all participants. Four territories in particular stand out: Sydney, Tokyo, London and New York, where the highest volume of operations occurs when the sessions in London and New York overlap. Furthermore, Europe is complemented by major financial centers such as Paris, Frankfurt and Zurich. Each day of forex trading begins with the opening of Australia, then Asia, followed by Europe, and finally North America. As markets in one region close, another opens - or has already opened - and continues to trade in the currency market. The seven most traded currencies in the world are: the US dollar, the euro, the Japanese yen, the British pound, the Australian dollar, the Canadian dollar, and the New Zealand dollar.
Currencies are needed around the world for international trade, this means that operations are not dominated by a single exchange market, but rather involve a global network of brokers from around the world, such as banks, commercial companies, central banks, companies investment management, hedge funds, as well as retail forex brokers and global investors. Because this market operates in multiple time zones, it can be accessed at any time except during the weekend, therefore, there is continuously at least one open market and there are some hours of overlap between the closing of the market of one region and the opening of another. The international scope of currency trading means that there are always traders around the world making and satisfying demands for a particular currency.
The market involves a global network of exchanges and brokers from around the world, although time zones overlap, the generally accepted time zone for each region is as follows:
Sydney 5pm to 2am EST (10pm to 7am UTC)
London 3am to 12 noon EST (8pm to 5pm UTC)
New York 8am to 5pm EST (1pm to 10pm UTC)
Tokyo 7pm to 4am EST (12am to 9am UTC)
Trading Session
A financial asset trading session refers to a period of time that coincides with the daytime trading hours for a given location, it is a business day in the local financial market. This may vary according to the asset class and the country, therefore operators must know the hours of trading sessions for the securities and derivatives in which they are interested in trading. If investors can understand market hours and set proper targets, they will have a much greater chance of making a profit within a workable schedule.
Kill Zones
Kill zones are highly liquid events. Many different market participants often come together and perform around these events. The activity itself can be event-driven (margin calls or option exercise-related activity), portfolio management-driven (asset allocation rebalancing orders and closing buy-in), or institutionally driven (larger players needing liquidity to complete the size) or a combination of any of the three. This intense cross-current of activity at a very specific point in time often occurs near significant technical levels and the established trends emerging from these events often persist until the next Death Zone approaches or enters.
Kill Zones are evolving with time and the course of world history. Since the end of World War II, New York has slowly invaded London's place as the world center for commercial banking. So much so that during the latter part of the 20th century, New York was considered the new center of the financial universe. With the end of the cold war, that leadership appears to have shifted towards Europe and away from the United States. Furthermore, Japan has slowly lost its former dominance in the global economic landscape, while Beijing's has increased dramatically. Only time will tell how these death zones will evolve given the ever-changing political, economic, and socioeconomic influences of each region.
Financial Markets
New York
New York (NYSE Chicago, NASDAQ)
7:30 am - 2:00 pm
It is the second largest currency platform in the world, followed largely by foreign investors as it participates in 90% of all operations, where movements on the New York Stock Exchange (NYSE) can have an immediate effect (powerful) on the dollar, for example, when companies merge and acquisitions are finalized, the dollar can instantly gain or lose value.
A. Complementary Stock Exchanges
Brazil (BOVESPA - Brazilian Stock Exchange)
07:00 am - 02:55 pm
Canada (TSX - Toronto Stock Exchange)
07:30 am - 02:00 pm
New York (NYSE - New York Stock Exchange)
08:30 am - 03:00 pm
B. North American Trading Session
07:00 am - 03:00 pm
(from the beginning of the business day on NYSE and NASDAQ, until the end of the New York session)
New York, Chicago and Toronto (Canada) open the North American session. Characterized by the most aggressive trading within the markets, currency pairs show high volatility. As the US markets open, trading is still active in Europe, however trading volume generally decreases with the end of the European session and the overlap between the US and Europe.
C. Strategic Points
US main session starts in 1 hour
07:30 am
The euro tends to drop before the US session. The NYSE, CHX and TSX (Canada) trading sessions begin 1 hour after this strategic point. The North American session begins trading Forex at 07:00 am.
This constitutes the beginning of the overlap of the United States and the European market that spans from 07:00 am to 10:35 am, often called the best time to trade EUR / USD, it is the period of greatest liquidity for the main European currencies since it is where they have their widest daily ranges.
When New York opens at 07:00 am the most intense trading begins in both the US and European markets. The overlap of European and American trading sessions has 80% of the total average trading range for all currency pairs during US business hours and 70% of the total average trading range for all currency pairs during European business hours. The intersection of the US and European sessions are the most volatile overlapping hours of all.
Influential news and data for the USD are released between 07:30 am and 09:00 am and play the biggest role in the North American Session. These are the strategically most important moments of this activity period: 07:00 am, 08:00 am and 08:30 am.
The main session of operations in the United States and Canada begins
08:30 am
Start of main trading sessions in New York, Chicago and Toronto. The European session still overlaps the North American session and this is the time for large-scale unpredictable trading. The United States leads the market. It is difficult to interpret the news due to speculation. Trends develop very quickly and it is difficult to identify them, however trends (especially for the euro), which have developed during the overlap, often turn the other way when Europe exits the market.
Second hour of the US session and last hour of the European session
09:30 am
End of the European session
10:35 am
The trend of the euro will change rapidly after the end of the European session.
Last hour of the United States session
02:00 pm
Institutional clients and very large funds are very active during the first and last working hours of almost all stock exchanges, knowing this allows to better predict price movements in the opening and closing of large markets. Within the last trading hours of the secondary market session, a pullback can often be seen in the EUR / USD that continues until the opening of the Tokyo session. Generally it happens if there was an upward price movement before 04:00 pm - 05:00 pm.
End of the trade session in the United States
03:00 pm
D. Kill Zones
11:30 am - 1:30 pm
New York Kill Zone. The United States is still the world's largest economy, so by default, the New York opening carries a lot of weight and often comes with a huge injection of liquidity. In fact, most of the world's marketable assets are priced in US dollars, making political and economic activity within this region even more important. Because it is relatively late in the world's trading day, this Death Zone often sees violent price swings within its first hour, leading to the proven adage "never trust the first hour of trading in America. North.
---------------
London
London (LSE - London Stock Exchange)
02:00 am - 10:35 am
Britain dominates the currency markets around the world, and London is its main component. London, a central trading capital of the world, accounts for about 43% of world trade, many Forex trends often originate from London.
A. Complementary Stock Exchange
Dubai (DFM - Dubai Financial Market)
12:00 am - 03:50 am
Moscow (MOEX - Moscow Exchange)
12:30 am - 10:00 am
Germany (FWB - Frankfurt Stock Exchange)
01:00 am - 10:30 am
Afríca (JSE - Johannesburg Stock Exchange)
01:00 am - 09:00 am
Saudi Arabia (TADAWUL - Saudi Stock Exchange)
01:00 am - 06:00 am
Switzerland (SIX - Swiss Stock Exchange)
02:00 am - 10:30 am
B. European Trading Session
02:00 am - 11:00 am
(from the opening of the Frankfurt session to the close of the Order Book on the London Stock Exchange / Euronext)
It is a very liquid trading session, where trends are set that start during the first trading hours in Europe and generally continue until the beginning of the US session.
C. Middle East Trading Session
12:00 am - 06:00 am
(from the opening of the Dubai session to the end of the Riyadh session)
D. Strategic Points
European session begins
02:00 am
London, Frankfurt and Zurich Stock Exchange enter the market, overlap between Europe and Asia begins.
End of the Singapore and Asia sessions
03:00 am
The euro rises almost immediately or an hour after Singapore exits the market.
Middle East Oil Markets Completion Process
05:00 am
Operations are ending in the European-Asian market, at which time Dubai, Qatar and in another hour in Riyadh, which constitute the Middle East oil markets, are closing. Because oil trading is done in US dollars, and the region with the trading day coming to an end no longer needs the dollar, consequently, the euro tends to grow more frequently.
End of the Middle East trading session
06:00 am
E. Kill Zones
5:00 am - 7:00 am
London Kill Zone. Considered the center of the financial universe for more than 500 years, Europe still has a lot of influence in the banking world. Many older players use the European session to establish their positions. As such, the London Open often sees the most significant trend-setting activity on any trading day. In fact, it has been suggested that 80% of all weekly trends are set through the London Kill Zone on Tuesday.
F. Kill Zones (close)
2:00 pm - 4:00 pm
London Kill Zone (close).
---------------
Tokyo
Tokyo (JPX - Tokyo Stock Exchange)
06:00 pm - 12:00 am
It is the first Asian market to open, receiving most of the Asian trade, just ahead of Hong Kong and Singapore.
A. Complementary Stock Exchange
Singapore (SGX - Singapore Exchange)
07:00 pm - 03:00 am
Hong Kong (HKEx - Hong Kong Stock Exchange)
07:30 pm - 02:00 am
Shanghai (SSE - Shanghai Stock Exchange)
07:30 pm - 01:00 am
India (NSE - India National Stock Exchange)
09:45 pm - 04:00 am
B. Asian Trading Session
06:00 pm - 03:00 am
From the opening of the Tokyo session to the end of the Singapore session
The first major Asian market to open is Tokyo which has the largest market share and is the third largest Forex trading center in the world. Singapore opens in an hour, and then the Chinese markets: Shanghai and Hong Kong open 30 minutes later. With them, the trading volume increases and begins a large-scale operation in the Asia-Pacific region, offering more liquidity for the Asian-Pacific currencies and their crosses. When European countries open their doors, more liquidity will be offered to Asian and European crossings.
C. Strategic Points
Second hour of the Tokyo session
07:00 pm
This session also opens the Singapore market. The commercial dynamics grows in anticipation of the opening of the two largest Chinese markets in 30 minutes: Shanghai and Hong Kong, within these 30 minutes or just before the China session begins, the euro usually falls until the same moment of the opening of Shanghai and Hong Kong.
Second hour of the China session
08:30 pm
Hong Kong and Shanghai start trading and the euro usually grows for more than an hour. The EUR / USD pair mixes up as Asian exporters convert part of their earnings into both US dollars and euros.
Last hour of the Tokyo session
11:00 pm
End of the Tokyo session
12:00 am
If the euro has been actively declining up to this time, China will raise the euro after the Tokyo shutdown. Hong Kong, Shanghai and Singapore remain open and take matters into their own hands causing the growth of the euro. Asia is a huge commercial and industrial region with a large number of high-quality economic products and gigantic financial turnover, making the number of transactions on the stock exchanges huge during the Asian session. That is why traders, who entered the trade at the opening of the London session, should pay attention to their terminals when Asia exits the market.
End of the Shanghai session
01:00 am
The trade ends in Shanghai. This is the last trading hour of the Hong Kong session, during which market activity peaks.
D. Kill Zones
10:00 pm - 2:00 am
Asian Kill Zone. Considered the "Institutional" Zone, this zone represents both the launch pad for new trends as well as a recharge area for the post-American session. It is the beginning of a new day (or week) for the world and as such it makes sense that this zone often sets the tone for the remainder of the global business day. It is ideal to pay attention to the opening of Tokyo, Beijing and Sydney.
--------------
Sidney
Sydney (ASX - Australia Stock Exchange)
06:00 pm - 12:00 am
A. Complementary Stock Exchange
New Zealand (NZX - New Zealand Stock Exchange)
04:00 pm - 10:45 pm
It's where the global trading day officially begins. While it is the smallest of the megamarkets, it sees a lot of initial action when markets reopen Sunday afternoon as individual traders and financial institutions are trying to regroup after the long hiatus since Friday afternoon. On weekdays it constitutes the end of the current trading day where the change in the settlement date occurs.
B. Pacific Trading Session
04:00 pm - 12:00 am
(from the opening of the Wellington session to the end of the Sydney session)
Forex begins its business hours when Wellington (New Zealand Exchange) opens local time on Monday. Sydney (Australian Stock Exchange) opens in 2 hours. It is a session with a fairly low volatility, configuring itself as the calmest session of all. Strong movements appear when influential news is published and when the Pacific session overlaps the Asian Session.
C. Strategic Points
End of the Sydney session
12:00 am
---------------
Conclusions
The best time to trade is during overlaps in trading times between open markets. Overlaps equate to higher price ranges, creating greater opportunities.
Regarding press releases (news), it should be noted that these in the currency markets have the power to improve a normally slow trading period. When a major announcement is made regarding economic data, especially when it goes against the predicted forecast, the coin can lose or gain value in a matter of seconds. In general, the more economic growth a country produces, the more positive the economy is for international investors. Investment capital tends to flow to countries that are believed to have good growth prospects and subsequently good investment opportunities, leading to the strengthening of the country's exchange rate. Also, a country that has higher interest rates through its government bonds tends to attract investment capital as foreign investors seek high-yield opportunities. However, stable economic growth and attractive yields or interest rates are inextricably intertwined. It's important to take advantage of market overlaps and keep an eye out for press releases when setting up a trading schedule.
References:
www.investopedia.com
www.investopedia.com
www.investopedia.com
www.investopedia.com
market24hclock.com
market24hclock.com

SMT - Smart Money Thursday Boxes
The Smart Money Trading Thursday - is a very specific trading system. You only trade it on a Thursday.
The script/indicator will color Thursdays as two boxes. If you just want one color, use same color for
both boxes. The boxes is there to indicate London/New York sessions.
SETTINGS
In the setting you find a numeric value as 1700-0400:5
The "5" indicate Thursday. You can change that if you prefer to color another specific day.
For example "4" would indicate Wednesday. And you can change the hours to fit your
sessions and trading style.
You can also use the 2 boxes on different days. If you for example would like to color up
London for Wednesday and Thursday. Then set hours to fit London session and adjust the
:5 to 4 on the 1st box and 5 on the 2nd.
HOW TO USE IT?
The Smart Money works in a way retail trading does not. Smart Money has an objective
to locate retail patterns, where there will be a lot of stop loss volume to be grabbed.
So when a retail trader see a setup like a "Double Top / Bottom". The Institutional
will see $$$ of dumb money, ready to be taken. The best moves happen on a Thursday
but if you are a skilled trader, you can see the move also occur on Wednesday or Friday.
The first thing that will happen, is that the Smart Money Breaks out of session. Meaning
they will leave the current weeks high/low range. To start collect negative contracts
of the retail volume.
When you see that happen. And you see a breakout that consist of 4 in a row 1 hour
chart candles. Then you have your first rule meet.
#1 Thursday breakout of current weeks high/low. And the move is a clean 4 hour move
as 4x H1 candles. The move can start within range. But must end clearly outside.
Visual Example:
#2 Next, we await an engulf at peak or near peak. That is where Institutional
may have problem to match any more contracts, and since they used their own
money to make this move. They must now mitigate orders, and return back to
the original retail pattern as most retail traders are now stopped out.
(Normally this is a long/clear candle out of range. they rarely go lower
then retail traders entry in the 1st push. This to not save any souls :)
#3 Price returns back to where the breakout from the retail happens.
You can now take your profit as a Smart Money Trader. Trading with less risk,
you can take profit of the return of that latest 4x H1 candle move. (Order
Block)
CONCLUSION
The best trade is when you can combine a retail pattern, followed by a
breakout which holds 4x 1 hour candles in the outbreak direction.
2nd best is when you have the 4x H1 breakout and really no clear retail
pattern. Still is the same game. Just not as clear as the one above.
Study the steps in this image and you see what to look after:
Good Luck with your trading!
Regards,
The Hunter Trading Group

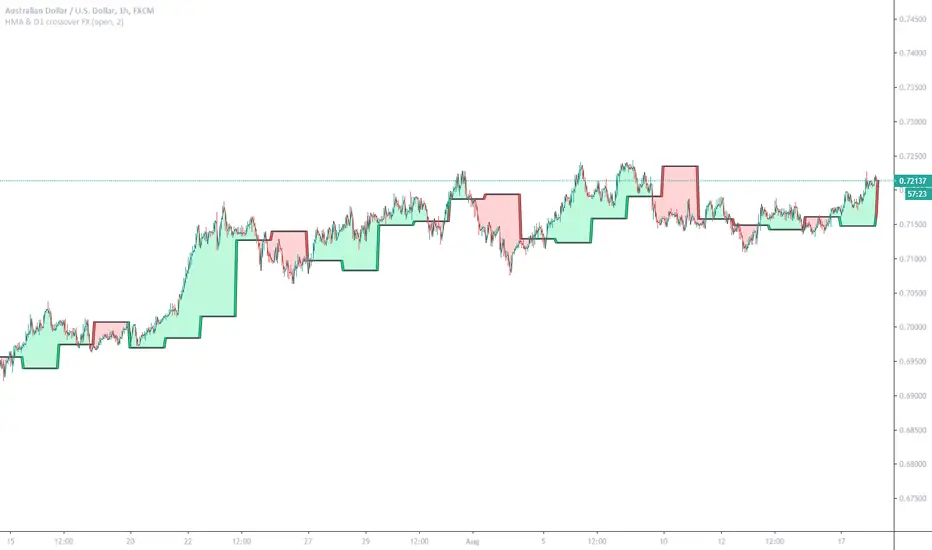
HMA & D1 crossover FX (Study)Can work on other Forex pairs if change settings: Period
This example tuned for AUDUSD (FX Version)
Enter new order on HMA ( Hull Moving Average ) and D1 ( Daily Candle) crossovers, Exit orders as basket when profit = Your Target Profit
This study version built for users of Alerts. Crossover of HMA and DailyCandle1 (and/or DailyCandle1 cross DailyCandle2) (also possible Price cross HMA)
Trend Follow with kijun-sen/tenkan sen for 1 Hour SPX
This script determines, plots and alerts on probable trend initiation and continuation points, using tenkan-sen(conversion line of ichimoku), kijun-sen(baseline of ichimoku) and stochastic RSI, for 1 H SPX.
New long/short trend initiates when prices cross above/below kijun sen. The trend continues when prices cross above/below tenkan-sen or stochastic RSI crosses up/down its signal line, while prices are above/below kijun-sen.
It is good to take partial profit between 10-15 points gain and trail the left with stops below kijun-sen line.
While placing the order, using 2-3 points buffer above/below of signal bars is recommended. Additionally, please be careful about clouds and do not place long/short orders below/above clouds.

Average True Range BandsAverage True Range Bands
The 30-day Average True Range is useful in Futures and Forex trading for placing stop orders for entry.
In the example above, a trader may want to initiate a Short position on a break below the support trendline.
A good place to enter this trade would be a price break below the support trendline minus 50 to 100% of the current ATR value.
ATR Bands provides a useful visual overlay of the current ATR value above and below the current price to speed up order entry decisions.

Right Sided Ricker Moving Average And The Gaussian DerivativesIn general gaussian related indicators are built by using the gaussian function in one way or another, for example a gaussian filter is built by using a truncated gaussian function as filter kernel (kernel refer to the set weights) and has many great properties, note that i say truncated because the gaussian function is not supposed to be finite. In general the gaussian function is represented by a symmetrical bell shaped curve, however the gaussian function is parametric, and the user might adjust the position of the peak as well as the width of the curve, an indicator using this parametric approach is the Arnaud Legoux moving average (ALMA) who posses a length parameter controlling the filter length, a peak parameter controlling the position of the peak of the gaussian function as well as a width parameter, those parameters can increase/decrease the lag and smoothness of the moving average output.
However what about the derivatives of the gaussian function ? We don't talk much about them and thats a pity because they are extremely interesting and have many great properties as well, therefore in this post i'll present a low lag moving average based on the modification of the 2nd order derivative of the gaussian function, i believe this post will be extremely informative and i hope you will enjoy reading it, if you are not a math person you can skip the introduction on gaussian derivatives and their properties used as filter kernel.
Gaussian Derivatives And The Ricker Wavelet
The notion of derivative is continuous, so we will stick with the term discrete derivative instead, which just refer to the rate of change in the function, we have a change function in pinescript, and we will be using it to show an approximation of the gaussian function derivatives.
Earlier i used the term 2nd order derivative, here the derivative order refer to the order of differentiation, that is the number of time we apply the change function. For example the 0 (zeroth) order derivative mean no differentiation, the 1st order derivative mean we use differentiation 1 time, that is change(f) , 2nd order mean we use differentiation 2 times, that is change(change(f)) , derivates based on multiple differentiation are called "higher derivative". It will be easier to show a graphic :
Here we can see a normal gaussian function in blue, its scaled 1st order derivative in orange, and its scaled 2nd derivative in green, note that i use scaled because i used multiplication in order for you to see each curve, else it would have been less easy to observe them. The number of time a gaussian function derivative cross 0 is based on the order of differentiation, that is 2nd order = the function crossing 0 two times.
Now we can explain what is the Ricker wavelet, the Ricker wavelet is just the normalized 2nd order derivative of a gaussian function with inverted sign, and unlike the gaussian function the only thing you can change is the width parameter. The formula of the Ricker wavelet is show'n here en.wikipedia.org , where sigma is the width parameter.
The Ricker wavelet has this look :
Because she is shaped like a sombrero the Ricker wavelet is also called "mexican hat wavelet", now what would happen if we used a Ricker wavelet as filter kernel ? The response is that we would end-up with a bandpass filter, in fact the derivatives of the gaussian function would all give the kernel of a bandpass filter, with higher order derivatives making the frequency response of the filter approximate a symmetrical gaussian function, if i recall a filter using the first order derivative of a gaussian function would give a frequency response that is left skewed, this skewness is removed when using higher order derivatives.
The Indicator
I didn't wanted to make a bandpass filter, as lately i'am more interested in low-lag filters, so how can we use the Ricker wavelet to make a low-lag low-pass filter ? The response is by taking the right side of the Ricker wavelet, and since values of the wavelets are negatives near the border we know that the filter passband is non-monotonic, that is we know that the filter will have low-lag as frequencies in the passband will be amplified.
So taking the right side of the Ricker wavelet only mean that t has to be greater than 0 and linearly increasing, thats easy, however the width parameter can be tricky to use, this was already the case with ALMA, so how can we work with it ? First it can be seen that values of width needs to be adjusted based on the filter length.
In red width = 14, in green width = 5. We can see that an higher values of width would give really low weights, when the number of negative weights is too important the filter can have a negative group delay thus becoming predictive, this simply mean that the overshoots/undershoots will be crazy wild and that a great fit will be impossible.
Here two moving averages using the previous described kernels, they don't fit the price well at all ! In order to fix this we can simply define width as a function of the filter length, therefore the parameter "Percentage Width" was introduced, and simply set the width of the Ricker wavelet as p percent of the filter length. Lower values of percent width reduce the lag of the moving average, but lets see precisely how this parameter influence the filter output :
Here the filter length is equal to 100, and the percent width is equal to 60, the fit is quite great, lower values of percent width will increase overshoots, in fact the filter become predictive once the percent width is equal or lower to 50.
Here the percent width is equal to 50. Higher values of percent width reduce the overshoots, and a value of 100 return a filter with no overshoots that is suited to act as a lagging moving average.
Above percent width is set to 100. In order to make use of the predictive side of the filter, it would be great to introduce a forecast option, however this require to find the best forecast horizon period based on length and width, this is no easy task.
Finally lets estimate a least squares moving average with the proposed moving average, you know me...a percent width set to 63 will return a relatively good estimate of the LSMA.
LSMA in green and the proposed moving in red with percent width = 63 and both length = 100.
Conclusion
A new low-lag moving average using a right sided Ricker wavelet as filter kernel has been introduced, we have also seen some properties of gaussian derivatives. You can see that lately i published more moving averages where the user can adjust certain properties of the filter kernel such as curve width for example, if you like those moving averages you can check the Parametric Corrective Linear Moving Averages indicator published last month :
I don't exclude working with pure forms of gaussian derivatives in the future, as i didn't published much oscillators lately.
Thx for reading !

Market BuySell RatioA script using 1m small candle size (configurable) to compute the volume of buy (up) vs sell (down) candles (instead of actual market buy vs sell orders which are not available in pine script).
It then plots the buy vs sell ratio as an oscillator below the cart.
This gives traders an idea of current order flow in the market.
To compute the small candles this script uses the "Smart Volume" script which can be found here:

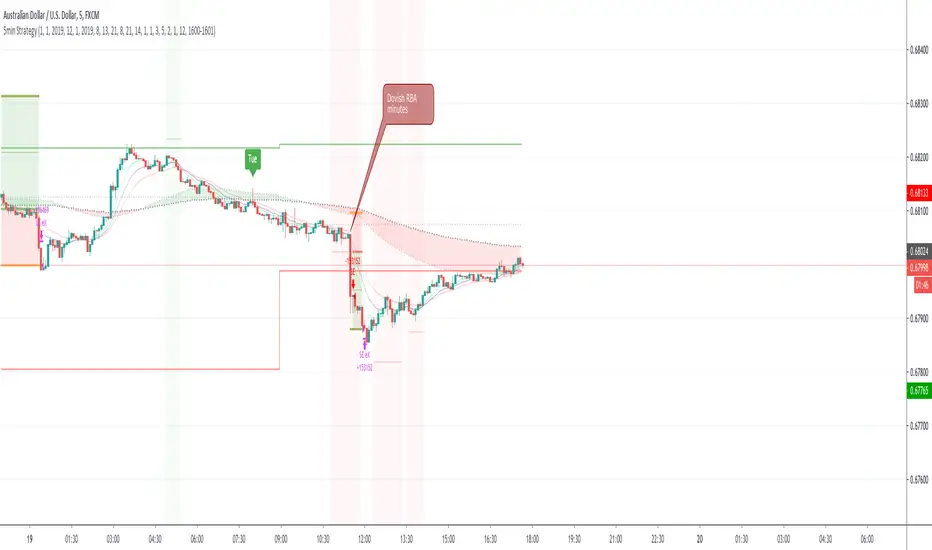
First time coding - a 5min forex Scalping strategy This is my first attempt at producing a strategy in Pine Script.
I am NOT a professional coder. I'm not even a good coder at that. I've only started Pine Script coding since September 2019. I am teaching myself.
This script is far from finished. I need to tweak a number of things about this script. Namely:
Add a validity window to the 'trigger bar' condition. Ie, I want to shut down the condition when the price closes above EMA21
Change the order entry so they are stop orders, using the stop entry price derived from the signals
Make changes to lot sizing
Add a trailing stop condition
Comments welcome, but do not expect me to reply to any questions or requests. In fact, don't expect any replies from me. I consider myself notoriously bad at replies.
I do welcome any feedback from any seasoned coders out there, as I am still a novice coder, and have so much to learn!
As to anyone who wants to criticise me - constructive and helpful criticism are most welcome, criticism to make yourself feel superior to me - you kind can eat a dk.
For the strategy rules, google the user ForexSignals TV account and look for the video "SIMPLE and PROFITABLE Forex Scalping Strategy".
Share, learn, prosper
Peace to y'all
Serialhenry
6/11/19
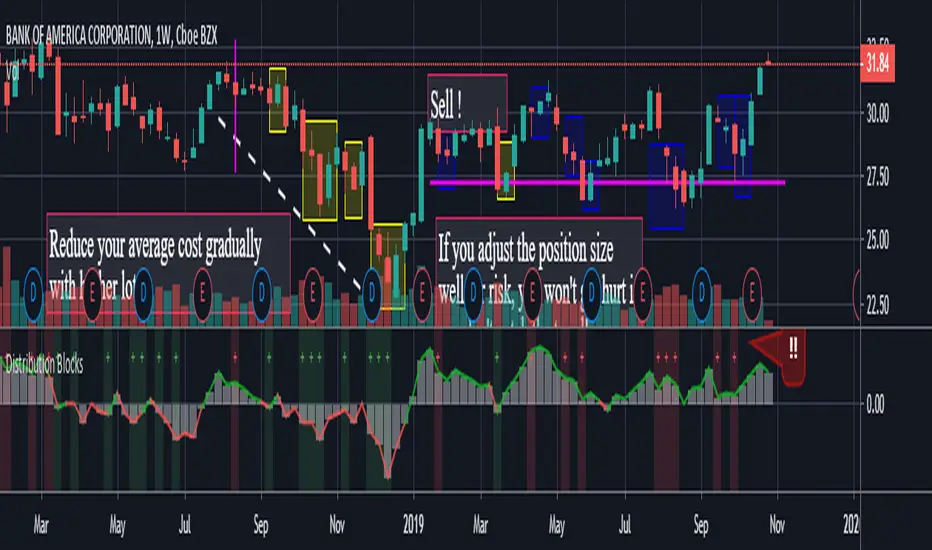
Distribution BlocksThis idea has been created by the combination of the two existing systems as a result of my efforts to create a distributional buying and selling guide that has plagued my head for a long time.
1st idea is Accumulation / Distribution Line :
2nd idea is Distribution Day :
These two ideas, the intellectual assistance of professional brokers, and my observations of cot data played a role in the formation of this idea.
Let's start.
No matter how often we divide our risk, both our minds are not comfortable and our capital may end at any moment, and if we do not use professional systems, our chances of success are 50 percent.
If we take this system as an aid to our classic systems, we can determine the amount of risk with those predictions and gradually trade.
If we don't use leverage and we have a little predictive ability, our chances of success go above 50 percent.
But for the first time, we can keep our first lot very low and increase the number of positions in the same order of orders (example: buy and buy and buy).
If we keep the first amount low, the folds won't hurt us.
When we catch up with the trend, purchases with larger position sizes than lower prices lower our average price, so that we can make a good profit when the rising trend starts.
By accepting the zone changes as the reset point just like in the martingale system, we enter the folds in the new zone with our first lot weight.
Although we cannot catch the trend, we determine the stoploss level by adding the first point we entered or the first point we entered and the commission cost.
In fact, this method is the method of buying and selling very large traders and producers, banks, pro-brokers, hedge funds and in other words the new popular phrase "whales".
Because if he trades otherwise, he cannot find buyers because his goods are too big.
I like the comfort of mind in this way.
Finally, your methods separating the negative and positive regions (macd, rsi, interpretation observation etc.)
the stronger you are, the higher your success rate.
I think the Accumulation Distribution method is very successful, but it can be adjusted for the period.
I can't wait to integrate my relativity system on this.
And when my deep learning series is over, I will integrate them on ANN series and share them publicly.
To start with, I can say briefly.
If your capital is 100:
(first lot + (increase multiplier * first lot) + (increase multiplier * increase multiplier * first lot) + .....) = 100
I tell you that you can have the same position in this series 10 - 15 times,
this will help you decide how small a position size is to be used as the starting rate and choose a low increment multiplier!
I think that this idea cannot be converted into strategy, because when our expectations come true, we may want to free all positions and start again.And I think that's better.
And in sudden movements and developments we take action with different expectations.
I'm going to talk about this script's calculations and profits on educational ideas.
Regards , Noldo.
Multi-Pair Trend Reversal WidgetThis is a multi-currency-pair trend reversal widget, which picks currency pairs by overbought/oversold level and can be used in pair trading strategy. It shows tradable currency pairs as well as anticipates corresponding trend direction. Currency pairs (CPs) are ordered by importance. The first 5 CPs are highlighted (with blue bars) as majors. The additional 5 CPs are minors (in gray bars) and may be omitted. Orange star indicates crossover of the middle line, the mean, with red and green stars being early warning signals of a forthcoming uptrend and downtrend, correspondingly.
Mind that this widget is computationally intensive, having to calculate 10 assets. Nonetheless, please look at it as my proposal for future developments of Pinescript, i.e. embedding widgets in the chart. ;)

PivotBoss TriggersI have collected the four PivotBoss indicators into one big indicator. Eventually I will delete the individual ones, since you can just turn off the ones you don't need in the style controller. Cheers.
Wick Reversal
When the market has been trending lower then suddenly forms a reversal wick candlestick , the likelihood of
a reversal increases since buyers have finally begun to overwhelm the sellers. Selling pressure rules the decline,
but responsive buyers entered the market due to perceived undervaluation. For the reversal wick to open near the
high of the candle, sell off sharply intra-bar, and then rally back toward the open of the candle is bullish , as it
signifies that the bears no longer have control since they were not able to extend the decline of the candle, or the
trend. Instead, the bulls were able to rally price from the lows of the candle and close the bar near the top of its
range, which is bullish - at least for one bar, which hadn't been the case during the bearish trend.
Essentially, when a reversal wick forms at the extreme of a trend, the market is telling you that the trend
either has stalled or is on the verge of a reversal. Remember, the market auctions higher in search of sellers, and
lower in search of buyers. When the market over-extends itself in search of market participants, it will find itself
out of value, which means responsive market participants will look to enter the market to push price back toward
an area of perceived value. This will help price find a value area for two-sided trade to take place. When the
market finds itself too far out of value, responsive market participants will sometimes enter the market with
force, which aggressively pushes price in the opposite direction, essentially forming reversal wick candlesticks .
This pattern is perhaps the most telling and common reversal setup, but requires steadfast confirmation in order
to capitalize on its power. Understanding the psychology behind these formations and learning to identify them
quickly will allow you to enter positions well ahead of the crowd, especially if you've spotted these patterns at
potentially overvalued or undervalued areas.
Fade (Extreme) Reversal
The extreme reversal setup is a clever pattern that capitalizes on the ongoing psychological patterns of
investors, traders, and institutions. Basically, the setup looks for an extreme pattern of selling pressure and then
looks to fade this behavior to capture a bullish move higher (reverse for shorts). In essence, this setup is visually
pointing out oversold and overbought scenarios that forces responsive buyers and sellers to come out of the dark
and put their money to work-price has been over-extended and must be pushed back toward a fair area of value
so two-sided trade can take place.
This setup works because many normal investors, or casual traders, head for the exits once their trade
begins to move sharply against them. When this happens, price becomes extremely overbought or oversold,
creating value for responsive buyers and sellers. Therefore, savvy professionals will see that price is above or
below value and will seize the opportunity. When the scared money is selling, the smart money begins to buy, and
Vice versa.
Look at it this way, when the market sells off sharply in one giant candlestick , traders that were short
during the drop begin to cover their profitable positions by buying. Likewise, the traders that were on the
sidelines during the sell-off now see value in lower prices and begin to buy, thus doubling up on the buying
pressure. This helps to spark a sharp v-bottom reversal that pushes price in the opposite direction back toward
fair value.
Engulfing (Outside) Reversal
The power behind this pattern lies in the psychology behind the traders involved in this setup. If you have
ever participated in a breakout at support or resistance only to have the market reverse sharply against you, then
you are familiar with the market dynamics of this setup. What exactly is going on at these levels? To understand
this concept is to understand the outside reversal pattern. Basically, market participants are testing the waters
above resistance or below support to make sure there is no new business to be done at these levels. When no
initiative buyers or sellers participate in range extension, responsive participants have all the information they
need to reverse price back toward a new area of perceived value.
As you look at a bullish outside reversal pattern, you will notice that the current bar's low is lower than the
prior bar's low. Essentially, the market is testing the waters below recently established lows to see if a downside
follow-through will occur. When no additional selling pressure enters the market, the result is a flood of buying
pressure that causes a springboard effect, thereby shooting price above the prior bar's highs and creating the
beginning of a bullish advance.
If you recall the child on the trampoline for a moment, you'll realize that the child had to force the bounce
mat down before he could spring into the air. Also, remember Jennifer the cake baker? She initially pushed price
to $20 per cake, which sent a flood of orders into her shop. The flood of buying pressure eventually sent the price
of her cakes to $35 apiece. Basically, price had to test the $20 level before it could rise to $35.
Let's analyze the outside reversal setup in a different light for a moment. One of the reasons I like this setup
is because the two-bar pattern reduces into the wick reversal setup, which we covered earlier in the chapter. If
you are not familiar with candlestick reduction, the idea is simple. You are taking the price data over two or more
candlesticks and combining them to create a single candlestick . Therefore, you will be taking the open, high, low,
and close prices of the bars in question to create a single composite candlestick .
Doji Reversal
The doji candlestick is the epitome of indecision. The pattern illustrates a virtual stalemate between buyers
and sellers, which means the existing trend may be on the verge of a reversal. If buyers have been controlling a
bullish advance over a period of time, you will typically see full-bodied candlesticks that personify the bullish
nature of the move. However, if a doji candlestick suddenly appears, the indication is that buyers are suddenly
not as confident in upside price potential as they once were. This is clearly a point of indecision, as buyers are no
longer pushing price to higher valuation, and have allowed sellers to battle them to a draw-at least for this one
candlestick . This leads to profit taking, as buyers begin to sell their profitable long positions, which is heightened
by responsive sellers entering the market due to perceived overvaluation. This "double whammy" of selling
pressure essentially pushes price lower, as responsive sellers take control of the market and push price back
toward fair value.

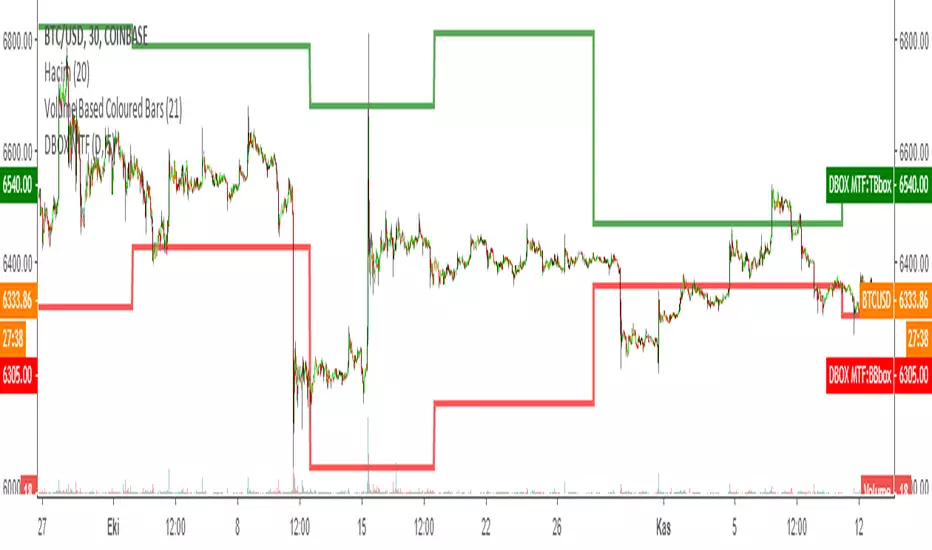
DARVAS BOX MTFMULTIPLE TIME FRAME VERSION OF DARVAS BOX:
You can view different time frame values of Darvas Box levels on any chart
What Is the Darvas Box?
The Darvas Box strategy was developed by Nicholas Darvas. Aside from being a well known dancer, he began trading stock in the 1950s. Based on his success in trading, he was approached to write a book on his strategy. The book, “How I Made $2,000,000 in the Stock Market,” outlines his rather simple approach … simple once you understand the basic concepts and rationale of the strategy.
Darvas Box is an indicator that simply draws lines along highs and lows, and then adjusts them as new highs and lows form. The indicator is available on many trading platforms, such as Thinkorswim. Traders may wish to draw their own boxes though, based on recent highs and lows; Darvas was able to do so (based on telegram quotes) more than half a century ago.
Darvas Box Rules
I shall not follow advisory services.
I shall be cautious of broker advice.
I shall ignore Wall Street sayings or truisms, no matter how ancient or revered.
I shall only trade stocks on major exchanges with adequate volume .
I shall not listen to (or trade off of) rumors or tips, no matter how well researched they may sound.
I will use a sound strategy instead of gamble…I must study this strategy (originally this approach was fundamental analysis , which didn’t work for him, so he developed his Darvas Box trading method).
I will hold one position for longer, as opposed to juggling a bunch of positions for a short period of time.
Darvas looked for increasing volume when selecting stocks to trade; this alerted him to stocks that were being accumulated and were likely to see strong trends.
Darvas believed in buying stocks that presented an upper box limit breakout, but also had an upward Earnings trend. This was especially the case when the major indexes had experienced a decline.
When an upper box limit is broken, buy. From his book, the entry price was usually about 1 to 2% above the upper box limit.
If you enter a trade and the price proceeds to drop out of the new box, and back into the old box, exit the trade.
Entry and stop loss orders should be set in advance, so trades aren’t missed and risk is controlled.
Place, and trail the stop loss order to below the low of the most recent box. This initial stop loss was pretty tight, because Darvas assumed when a price broke out of an old box, it was entering a new box. Therefore, the stop was placed just below the high of old box which was just broken (low of new box).
Record trades, including reasons why you entered and exited.
General conditions of the market must favor buying. Don’t buy stocks when the major indexes are in a bear market, or when volume is flat or declining.
If you are stopped out, but the price moves back into the higher box again providing another buy signal, buy again, using the same stop loss location.
Since the stop is being trailed up, more funds can be added on each consecutive breakout.
The Bottom Line
Nicholas Darvas was a dancer, but committed a great deal of time to developing and then mastering his stock trading method. It’s a trend following method based on breakouts to higher boxes. Risk is controlled by placing a stop below new higher boxes as they form. During choppy conditions the strategy won’t be profitable. This is why Darvas also attempted to only trade stocks with increasing volume and rising Earnings . Trading his method requires a lot of discipline, but can produce big profits when strong trends develop.
source: traderhq.com
Creator: Nicholas DARVAS
Here's the link to a complete list of all my indicators:
tr.tradingview.com
Şimdiye kadar paylaştığım indikatörlerin tam listesi için: tr.tradingview.com
DARVAS BOX by KIVANÇ fr3762What Is the Darvas Box?
The Darvas Box strategy was developed by Nicholas Darvas. Aside from being a well known dancer, he began trading stock in the 1950s. Based on his success in trading, he was approached to write a book on his strategy. The book, “How I Made $2,000,000 in the Stock Market,” outlines his rather simple approach … simple once you understand the basic concepts and rationale of the strategy.
Darvas Box is an indicator that simply draws lines along highs and lows, and then adjusts them as new highs and lows form. The indicator is available on many trading platforms, such as Thinkorswim. Traders may wish to draw their own boxes though, based on recent highs and lows; Darvas was able to do so (based on telegram quotes) more than half a century ago.
Darvas Box Rules
I shall not follow advisory services.
I shall be cautious of broker advice.
I shall ignore Wall Street sayings or truisms, no matter how ancient or revered.
I shall only trade stocks on major exchanges with adequate volume .
I shall not listen to (or trade off of) rumors or tips, no matter how well researched they may sound.
I will use a sound strategy instead of gamble…I must study this strategy (originally this approach was fundamental analysis , which didn’t work for him, so he developed his Darvas Box trading method).
I will hold one position for longer, as opposed to juggling a bunch of positions for a short period of time.
Darvas looked for increasing volume when selecting stocks to trade; this alerted him to stocks that were being accumulated and were likely to see strong trends.
Darvas believed in buying stocks that presented an upper box limit breakout, but also had an upward Earnings trend. This was especially the case when the major indexes had experienced a decline.
When an upper box limit is broken, buy. From his book, the entry price was usually about 1 to 2% above the upper box limit.
If you enter a trade and the price proceeds to drop out of the new box, and back into the old box, exit the trade.
Entry and stop loss orders should be set in advance, so trades aren’t missed and risk is controlled.
Place, and trail the stop loss order to below the low of the most recent box. This initial stop loss was pretty tight, because Darvas assumed when a price broke out of an old box, it was entering a new box. Therefore, the stop was placed just below the high of old box which was just broken (low of new box).
Record trades, including reasons why you entered and exited.
General conditions of the market must favor buying. Don’t buy stocks when the major indexes are in a bear market, or when volume is flat or declining.
If you are stopped out, but the price moves back into the higher box again providing another buy signal, buy again, using the same stop loss location.
Since the stop is being trailed up, more funds can be added on each consecutive breakout.
The Bottom Line
Nicholas Darvas was a dancer, but committed a great deal of time to developing and then mastering his stock trading method. It’s a trend following method based on breakouts to higher boxes. Risk is controlled by placing a stop below new higher boxes as they form. During choppy conditions the strategy won’t be profitable. This is why Darvas also attempted to only trade stocks with increasing volume and rising Earnings . Trading his method requires a lot of discipline, but can produce big profits when strong trends develop.
source: traderhq.com
Creator: Nicholas DARVAS

MACD_3Color_OverlayThis was updated from script of ChrisMoody published on 4-10-2014.
This MACD is an overlayed version instead of separated indicator.
I re-color lines and histogram for my own trading strategy.
For example, look the screenshot, you can see that even though price from 1 to 2 is ascending, but on histogram, the volume from 1 to 2 is descending, which means there will be a reversal of price.
So we wait until the second red volume appears (marked with an arrow on top) we can place a short order. Or, to make sure, we can wait until the red dot (marked with "X" letter) appears to do that.
Same with buy order.
This is just a suggestion for trading strategy, not a guarantee, everything can happen, you should spend time to inspect the indicator to make sure you understand it before use for trading.
And YOU TRADE WITH YOUR OWN RISKS!
Hope you like it.

Currency Relative Strengths V.2 [GM]Version 2 Updates
Speed has been increased by ~7X
Highest and lowest pairs now highlighted using brighter colors
Re-ordered pairs from highest to lowest 'flight to risk' rating
I created this tool for the purpose of determining strongest and weakest currencies over different periods of time. Each major currency is compared to the field of other majors and its average change is measured over a predetermined period of time. The result is displayed as a percentage. I use it for trend following but it can also be used to fade exhaustion.
Instructions
Add indicator to chart
Select a time frame under settings
Place cursor over period of interest
Click "Data Window" on right hand side bar
View % change avg values for each currency

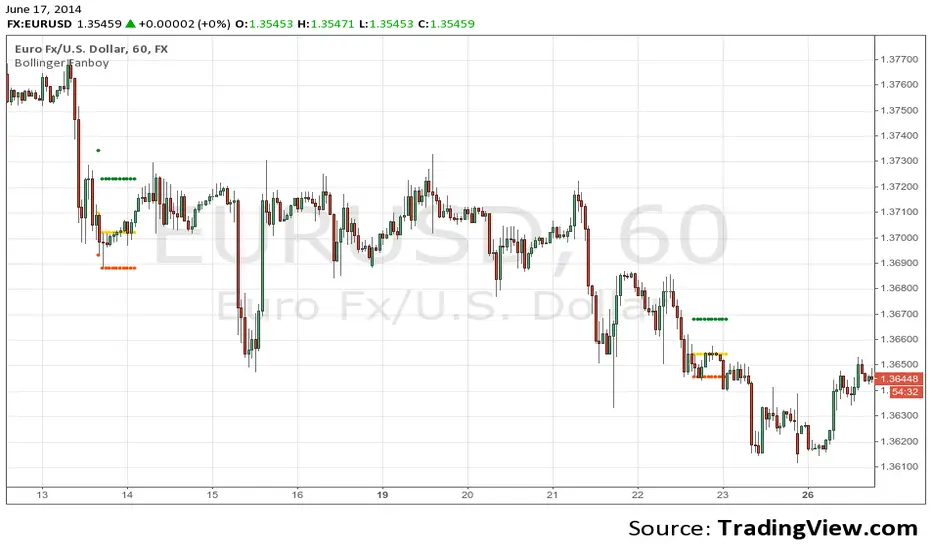
Bollinger FanboyTo use this indicator. Set pending orders to enter at "Entry", stoploss at "Stop", and profit at "Exit". Close pending order after 10 bars if it doesn't open.
Please use this at your own risk. By using this indicator you are agreeing that I am in no way liable for any financial losses that may occur indirectly or directly as a result of using this indicator.
Copyright 2014 Michael Edwards (info@bollingerfanboy.com)
Bollingfanboy.com