Parabolic SAR + EMA 200 + MACD SignalsParabolic SAR + EMA 200 + MACD Signals Indicator, a powerful tool designed to help traders identify optimal entry points in the market.
This indicator combines three popular technical indicators: Parabolic SAR (Stop and Reverse), EMA200 (Exponential Moving Average 200) and MACD (Moving Average Convergence Divergence) - to provide clear and concise buy and sell signals based on market trends.
The MACD component of this indicator calculates the difference between two exponentially smoothed moving averages, providing insight into the trend strength of the market. The Parabolic SAR component helps identify potential price reversals, while the EMA200 acts as a key level of support and resistance, providing additional confirmation of the overall trend direction.
Whether you're a seasoned trader or just starting out, the MACD-Parabolic SAR-EMA200 Indicator is a must-have tool for anyone looking to improve their trading strategy and maximize profits in today's dynamic markets.
Buy conditions
The price should be above the EMA 200
Parabolic SAR should show an upward trend
MACD Delta should be positive
ُSell conditions
The price should be below the EMA 200
Parabolic SAR should show an downward trend
MACD Delta should be negative
Cari dalam skrip untuk "parabolic SAR"

Parabolic sar with breaksThis plots a Parabolic sar and a break line on the previous sar point before the parabolic sar flips.
This is looking to be a very popular entry signal for lots of strats.
How to use:
In conjunction with other confirmation indicators;
Long : Enter long when the Parabolic sar is below the price and the price breaks above (and closes) the break line.
Short : Enter short when the Parabolic sar is above the price and the price breaks below (and closes) the break line.
A great indicator combination for this is to use a 200 ema for price trend and volume flow.
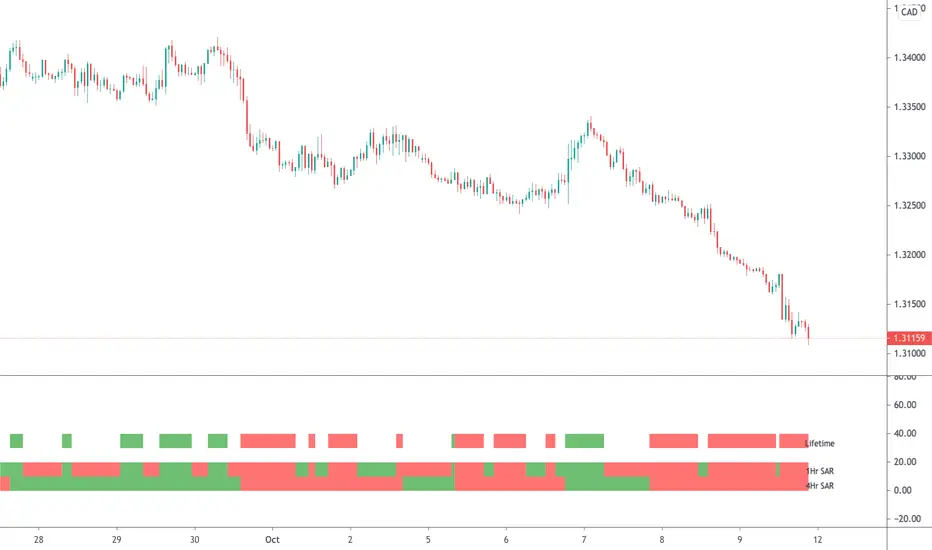
Parabolic SAR (MTF)This is a multi-timeframe Parabolic SAR indicator which uses 1 and 4 hour charts.
Using this indicator is simple, if the LifeTime line is green then buy, if red then sell OR don't trade. So...
Green Line - This strategy is in a buy position
Red Line - This strategy is in a sell position
Any other colour - DON'T TRADE
The traders approach is simple, when all indicators are green or red, then take the trade. As soon as one indicator changes, then re-evaluate using your normal process, such as price action, to determine whether to close the trade or continue.
If you require any further information or script modifications, please message me.
PLEASE CHECK OUT MY OTHER SCRIPTS
TradePro Parabolic SAR BackgroundTradePro Parabolic SAR Background
This indicator is a small tribute to youtuber TradePro
The operation is simple. It is the same Parabolic SAR indicator with its default configuration, but in background format. It is a new way to visualize the same information, more understandably. It is in itself a complete trading system, it can be used in conjunction with the traditional Parabolic SAR to locate the stop loss.
Parabolic SAR
In stock and securities market technical analysis, parabolic SAR (parabolic stop and reverse) is a method devised by J. Welles Wilder, Jr., to find potential reversals in the market price direction of traded goods such as securities or currency exchanges such as forex. It is a trend-following (lagging) indicator and may be used to set a trailing stop loss or determine entry or exit points based on prices tending to stay within a parabolic curve during a strong trend.
Similar to option theory's concept of time decay, the concept draws on the idea that "time is the enemy". Thus, unless a security can continue to generate more profits over time, it should be liquidated. The indicator generally works only in trending markets, and creates "whipsaws" during ranging or, sideways phases. Therefore, Wilder recommends first establishing the direction or change in direction of the trend through the use of parabolic SAR, and then using a different indicator such as the Average Directional Index to determine the strength of the trend.
A parabola below the price is generally bullish, while a parabola above is generally bearish. A parabola below the price may be used as support, whereas a parabola above the price may represent resistance.

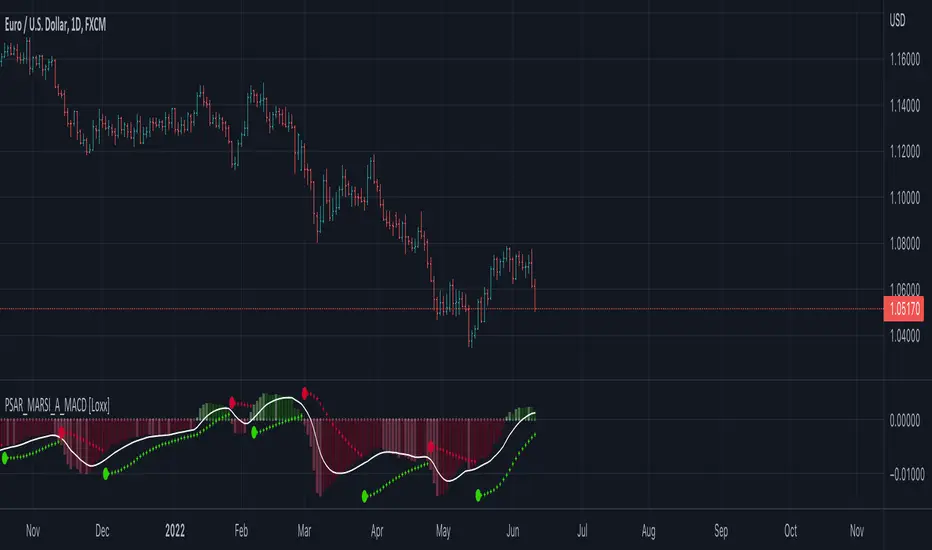
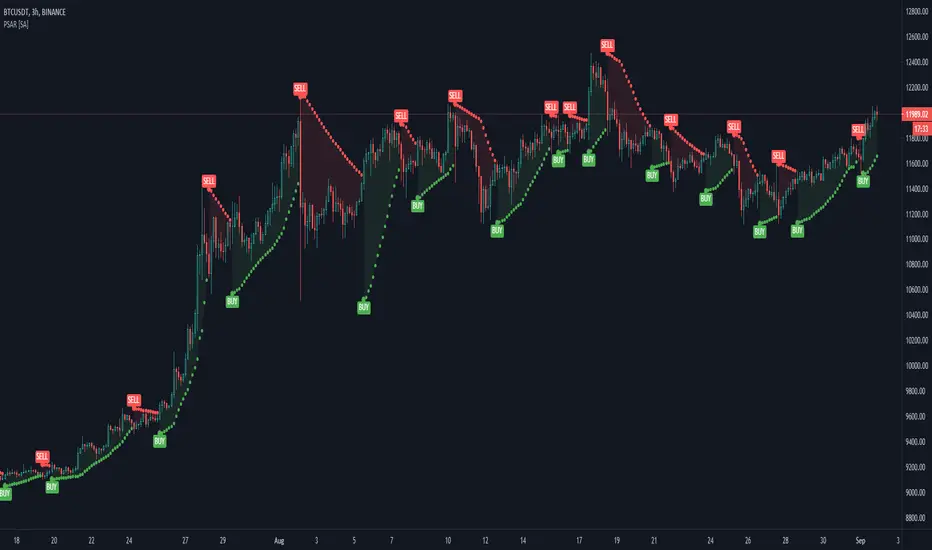
Parabolic SAR MARSI, Adaptive MACD [Loxx]Parabolic SAR MARSI, Adaptive MACD is a trend following indicator that combines MACD, Parabolic SAR, and RSI into a signal indicator.
What is Parabolic SAR?
The parabolic stop and reverse, more commonly known as the "Parabolic SAR," or "PSAR" is a trend-following indicator developed by J. Welles Wilder. It is displayed as a single parabolic line (or dots) underneath the price bars in an uptrend, and above the price bars in a downtrend.
What is MACD?
Moving average convergence divergence (MACD) is a trend-following momentum indicator that shows the relationship between two moving averages of a security’s price. The MACD is calculated by subtracting the 26-period exponential moving average (EMA) from the 12-period EMA.
What is RSI?
The relative strength index (RSI) is a momentum indicator used in technical analysis that measures the magnitude of recent price changes to evaluate overbought or oversold conditions in the price of a stock or other asset. The RSI is displayed as an oscillator (a line graph that moves between two extremes) and can have a reading from 0 to 100. The indicator was originally developed by J. Welles Wilder Jr. and introduced in his seminal 1978 book, “New Concepts in Technical Trading Systems.”
How to combine PSAR, MACD, and RSI into one:
1. Create a new type of moving average called MARSI. MARSI is like a typical moving average but it flexes to RSI sensitivities
2. Calculate MACD for the MARSI of High/Low values
3. Calculate the midpoint MACD between the High/Low MACDs created in step 2
4. Create a final MACD by calculating the MARSI for the midpoint MACD created in step 3
5. Finally, Inject these values into a customized Parabolic SAR function
Results:
-A unique spin on three different indicators that identifies trends of both RSI, MACD, and price of the underlying asset
-Entry, exit, and reversal points in price, RSI, and MACD
-A MACD that adapts to RSI
What's Included?
-Customization of all variables
-A variety of moving averages to smooth the signal line
-Customizable colors
-Alerts for MACD zero-line and signal crosses, and PSAR trend direction changes
Things to know:
-The histogram in this indicator is NOT the normal histogram found in the classic MACD indicator. The histogram here is a histogram of MACD itself. The classic histogram has questionable utility but the histogram in this indicator is very important and useful
-Parabolic SAR is calculated on the MARSI of High/Low values
Future releases:
-Divergences
-Regular, continuation, and exit signals
Happy trading!
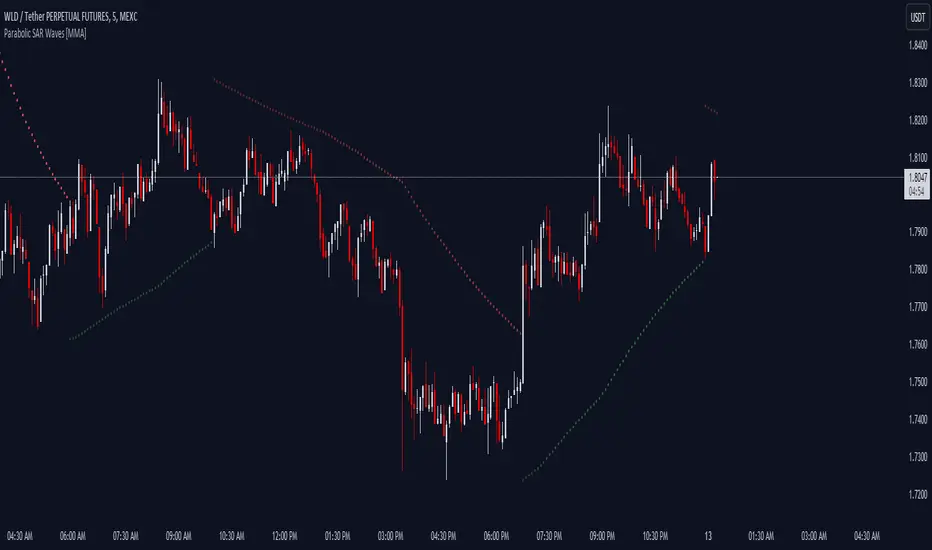
Parabolic SAR Waves [MMA]Parabolic SAR Waves
Description:
The "Parabolic SAR Waves " is an advanced version of the traditional Parabolic SAR indicator, customized for TradingView. This script incorporates dynamic acceleration factors and optional gradient coloration to enhance visual interpretation and utility for traders aiming to accurately capture trends and predict potential reversals.
Features:
- Dynamic Acceleration: Adjust the initial, incremental, and maximum values of the acceleration factor to suit various market conditions and trading preferences.
- Gradient Coloring: Use gradient colors to indicate the strength and stability of the trend, providing visual cues that are easy to interpret.
- Trend Visibility: The SAR dots are plotted directly on the price chart, making it easy to spot trend changes and maintain situational awareness.
- Overlay Feature: Designed to overlay directly on the price charts, allowing for seamless integration with other technical analysis tools.
Benefits:
- Trend Detection: Helps in identifying the beginning and potential reversal of trends, aiding in timely decision-making.
- Stop-Loss Management: Utilizes the positions of the SAR dots as dynamic stop-loss points, which helps in risk management.
- Visual Simplicity: Enhances the decision-making process through a straightforward visual representation of trend data.
Parameters:
- Acceleration Start (accel_start): The initial value for the acceleration, set to 0.02 by default.
- Acceleration Increment (accel_inc): The amount by which the acceleration increases, set to 0.005 by default.
- Acceleration Maximum (accel_max): The maximum limit of the acceleration factor, set to 0.1 by default.
- Use Gradient Colors (use_gradient): A boolean toggle to enable or disable gradient coloring, enabled by default.
Indicator Usage:
1. To apply, select this indicator from TradingView's indicator library.
2. Adjust the acceleration parameters based on your specific trading strategy and market analysis.
3. Interpret the indicator signals:
- Green SAR dots below the price bars indicate a bullish trend.
- Red SAR dots above the price bars signify a bearish trend.
- Gradient colors, if enabled, provide insights into the acceleration factor's intensity relative to trend strength.
Alerts:
- Bullish Reversal Alert: Issues a notification if there is a potential upward reversal when the trend shifts to bullish.
- Bearish Reversal Alert: Alerts when there's potential for a downward move as the trend turns bearish.
The "Parabolic SAR Waves " is a robust tool, ideal for traders who need precise, customizable trend-following capabilities that integrate seamlessly with other market analysis strategies. Enhance your trading with detailed trend insights and adaptive parameter controls.
Parabolic SAR of KAMA [Loxx]Parabolic SAR of KAMA attempts to reduce noise and volatility from regular Parabolic SAR in order to derive more accurate trends. In addition, and to further reduce noise and enhance trend identification, PSAR of KAMA includes two calculations of efficiency ratio: 1) price change adjusted for the daily volatility; or, 2) Jurik Fractal Dimension Adaptive (explained below)
What is PSAR?
The parabolic SAR indicator, developed by J. Wells Wilder, is used by traders to determine trend direction and potential reversals in price. The indicator uses a trailing stop and reverse method called "SAR," or stop and reverse, to identify suitable exit and entry points. Traders also refer to the indicator as to the parabolic stop and reverse, parabolic SAR, or PSAR.
What is KAMA?
Developed by Perry Kaufman, Kaufman's Adaptive Moving Average (KAMA) is a moving average designed to account for market noise or volatility. KAMA will closely follow prices when the price swings are relatively small and the noise is low. KAMA will adjust when the price swings widen and follow prices from a greater distance. This trend-following indicator can be used to identify the overall trend, time turning points and filter price movements.
What is the efficiency ratio?
In statistical terms, the Efficiency Ratio tells us the fractal efficiency of price changes. ER fluctuates between 1 and 0, but these extremes are the exception, not the norm. ER would be 1 if prices moved up 10 consecutive periods or down 10 consecutive periods. ER would be zero if price is unchanged over the 10 periods.
What is Jurik Fractal Dimension?
There is a weak and a strong way to measure the random quality of a time series.
The weak way is to use the random walk index (RWI). You can download it from the Omega web site. It makes the assumption that the market is moving randomly with an average distance D per move and proposes an amount the market should have changed over N bars of time. If the market has traveled less, then the action is considered random, otherwise it's considered trending.
The problem with this method is that taking the average distance is valid for a Normal (Gaussian) distribution of price activity. However, price action is rarely Normal, with large price jumps occuring much more frequently than a Normal distribution would expect. Consequently, big jumps throw the RWI way off, producing invalid results.
The strong way is to not make any assumption regarding the distribution of price changes and, instead, measure the fractal dimension of the time series. Fractal Dimension requires a lot of data to be accurate. If you are trading 30 minute bars, use a multi-chart where this indicator is running on 5 minute bars and you are trading on 30 minute bars.
Conclusion from the combined efforts explained above:
-PSAR is a tool that identifies trends
-To reduce noise and identify trends during periods of low volatility, we calculate a PSAR on KAMA
-To enhance noise and reduction and trend identification, we attempt to derive an efficiency ratio that is less reliant on a Normal (Gaussian) distribution of price
Included:
-Customization of all variables
-Select from two different ER calculation styles
-Multiple timeframe enabled

Parabolic SAR along with Heiken ashi Open strategy and EMA moveParabolic SAR along with Heiken ashi Open strategy and EMA move
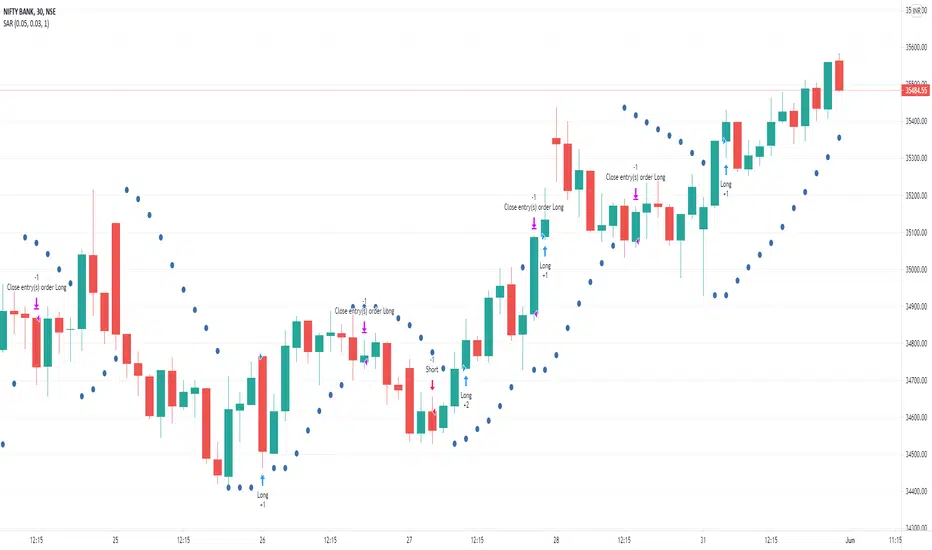

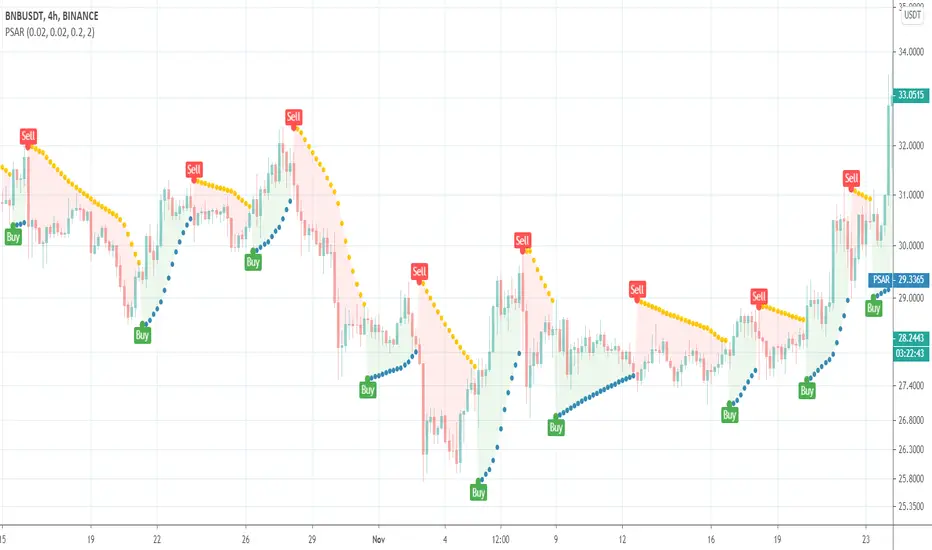
Parabolic SAR Crosses_AITIndicator Name: Parabolic SAR Crosses_AIT
Purpose:
This indicator utilizes the Parabolic SAR to track price trends and generate buy (long) and sell (short) signals when the price crosses the Parabolic SAR line. The indicator is designed to help traders identify trend direction and potential trend reversals on the price chart.
Indicator Overview:
Indicator Parameters:
Parabolic SAR: The default settings for the Parabolic SAR are:
Step: 0.02
Maximum: 0.2 These values can be adjusted by the user to control the sensitivity of the SAR.
Signal Conditions:
Buy Signal (Long): A buy signal is generated when the price crosses above the Parabolic SAR line.
Sell Signal (Short): A sell signal is generated when the price crosses below the Parabolic SAR line.
How It Works:
Buy Signal:
When the price crosses above the Parabolic SAR line, it indicates a potential upward trend. A yellow triangle (L) will appear below the price bar, signaling a possible long entry.
Sell Signal:
When the price crosses below the Parabolic SAR line, it indicates a potential downward trend. A fuchsia triangle (S) will appear above the price bar, signaling a possible short entry.
Trend Detection:
Green Line: Indicates that the Parabolic SAR is below the price, suggesting an uptrend.
Red Line: Indicates that the Parabolic SAR is above the price, suggesting a downtrend.
Trend Reversal:
A trend reversal occurs when the Parabolic SAR switches positions relative to the price. This can be used to exit positions or enter positions in the opposite direction.
Customization:
Step Size: The step parameter controls how sensitive the Parabolic SAR is to price changes. A smaller step value (e.g., 0.01) makes the SAR less sensitive, while a larger step value (e.g., 0.05) makes it more sensitive.
Maximum: The maximum value defines the upper limit for the acceleration factor in the SAR calculation. A higher value allows the SAR to track the price more closely, while a lower value smooths the trend.
Visual Representation:
The Parabolic SAR line is plotted directly on the price chart as a solid line, using the appropriate colors (green or red) depending on the trend direction.
Long signals are indicated by small yellow triangles (L) below the price.
Short signals are indicated by small fuchsia triangles (S) above the price.
Usage Tips:
Combining with Other Indicators: While Parabolic SAR is a great tool for identifying trend direction, it may produce false signals in ranging or sideways markets. Combining this indicator with other trend confirmation tools, such as moving averages or the MACD, can improve its reliability.
Adjusting the Step and Maximum Values: In highly volatile markets, it might be useful to reduce the step value to avoid false signals. In more stable, trending markets, increasing the step value can make the SAR more responsive.
Position Management: Parabolic SAR can be used not only to enter trades but also to manage existing positions by acting as a trailing stop-loss. You can use the SAR value as a dynamic stop-loss level, adjusting it as the trend progresses.
Conclusion:
The Parabolic SAR Crosses_AIT indicator helps traders visually identify trend directions and possible trend reversals by plotting the Parabolic SAR directly on the price chart. With customizable settings for sensitivity and signals that indicate long or short positions, this indicator provides a clear and effective method to manage trades based on trend-following strategies.

Parabolic SAR Deviation [BigBeluga]Parabolic SAR + Deviation is an enhanced Parabolic SAR indicator designed to detect trends while incorporating deviation levels and trend change markers for added depth in analyzing price movements.
🔵 Key Features:
> Parabolic SAR with Optimized Settings:
Built on the classic Parabolic SAR, this version uses predefined default settings to enhance its ability to detect and confirm trends.
Clear trend direction is indicated by smooth trend lines, allowing traders to easily visualize market movements.
Trend Change Markers:
When a trend change occurs based on the SAR, the indicator plots a triangle at the trend change point.
The triangle is accompanied by the price value of the trend change, allowing traders to identify key reversal points instantly.
> Deviation Levels:
Four deviation levels are automatically plotted when a trend change occurs (up or down).
Uptrend: Deviation levels are positioned above the entry point.
Downtrend: Deviation levels are positioned below the entry point.
Levels are labeled with numbers 1 to 4, representing increasing degrees of deviation.
> Dynamic Level Updates:
When the price crosses a deviation level, the level becomes dashed and its label changes to display the volume at the breakout point.
This volume information helps traders assess the strength of the breakout and the potential for trend continuation or reversal.
> Volume Analysis at Breakpoints:
The volume displayed at crossed deviation levels provides insight into the strength of the price movement.
High volume at a breakout may indicate strong momentum, while low volume could signal potential exhaustion or a false breakout.
🔵 Usage:
Identify Trends: Use the trend change triangles and smooth SAR trend lines to confirm whether the market is trending up or down.
Analyze Deviation Levels: Monitor deviation levels **1–4** to identify potential breakout points and assess the degree of price deviation from the entry point.
Observe Trend Change Points: Utilize the triangles and price labels to quickly spot significant trend changes.
Volume Insights: Evaluate the volume displayed at crossed levels to determine the strength of the breakout and assess the likelihood of trend continuation or reversal.
Risk Management: Use deviation levels as potential stop-loss or take-profit zones, depending on the strength of the trend and volume conditions.
Parabolic SAR + Deviation is an essential tool for traders seeking a straightforward yet powerful method to identify trends, analyze price deviations, and gain insights into volume dynamics at critical breakout and trend change levels.
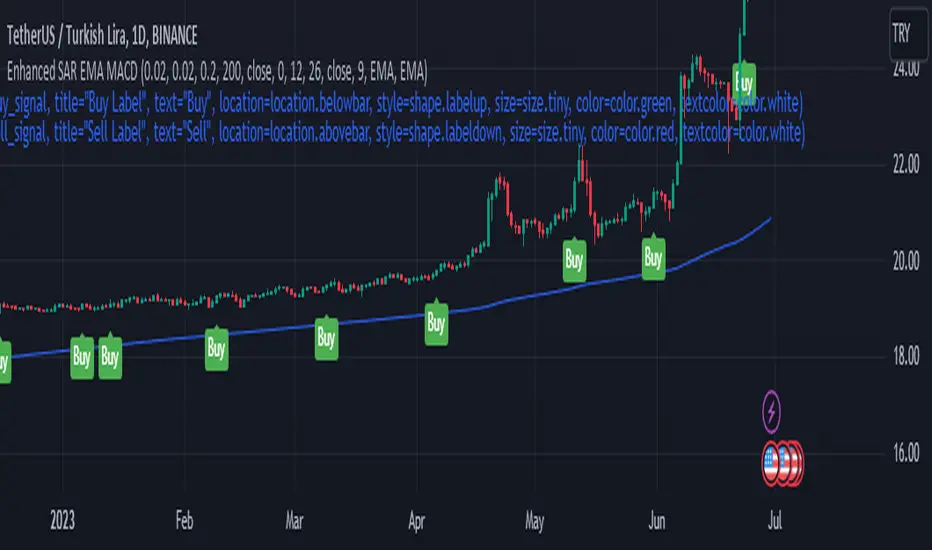
Enhanced Parabolic SAR + EMA 200 + MACD SignalsParabolic SAR + EMA 200 + MACD Signals Indicator is a popular technical analysis tool used by traders to identify potential entry and exit points in the market. It combines three widely used indicators: Parabolic SAR, EMA 200, and MACD.
The Parabolic SAR indicator helps determine potential price reversals. It places dots above or below the price chart to indicate the direction of the trend. When the dots are below the price, it suggests an upward trend, and when they are above the price, it indicates a downward trend.
The EMA 200 (Exponential Moving Average 200) is a moving average that gives more weight to recent price data. It is often used as a significant support or resistance level. Traders consider the price to be in an uptrend if it is above the EMA 200 and in a downtrend if it is below the EMA 200.
The MACD (Moving Average Convergence Divergence) is a trend-following momentum indicator that calculates the difference between two exponential moving averages. It consists of a MACD line and a signal line. When the MACD line crosses above the signal line, it generates a bullish signal, indicating a potential buying opportunity. Conversely, when the MACD line crosses below the signal line, it generates a bearish signal, suggesting a potential selling opportunity.
To use the MACD-Parabolic SAR-EMA200 Indicator for trading, you can follow these guidelines:
Buy conditions:
1. The price should be above the EMA 200.
2. The Parabolic SAR should indicate an upward trend (dots below the price).
3. The MACD delta (the difference between the MACD line and the signal line) should be positive.
Sell conditions:
1. The price should be below the EMA 200.
2. The Parabolic SAR should indicate a downward trend (dots above the price).
3. The MACD delta should be negative.
By combining these three indicators, traders can gain additional confirmation of the overall trend direction and make more informed trading decisions. However, it's important to note that no indicator guarantees successful trades, and it's always advisable to use additional analysis and risk management techniques in conjunction with technical indicators.
Parabolic SARThis is a redesign of the built-in Parabolic SAR indicator. I added a proper input system, an option to highlight initial points for both lines and an option to choose points width. So, customize it as you want.
Parabolic SAR was originally developed by J. Welles Wilder and described in his book "New Concepts in Technical Trading Systems" (1978). It is a trend-following indicator that can be used as a trailing stop loss.
To know which settings for PSAR are the most profitable on your instrument and timeframe you can use this tool
Profitable Parabolic SAR
Parabolic SAR Oscillator [LuxAlgo]This indicator is a detrended price series using the Parabolic Stop and Reverse (SAR) trailing stop, resulting in a bounded oscillator in the range (-100, 100). The SAR output is also normalized to obtain a noiseless oscillator which can complement the detrended price.
Settings
Start: Initial value of the convergence factor used when a new trend is detected by the SAR
Increment: Increment value of the convergence factor
Maximum: Maximum value of the convergence factor
Usage
The price is detrended by subtracting the closing price to the SAR, this result is then normalized.
An up-trending market is indicated once the normalized SAR reaches -100, while a value of 100 indicates a down-trending market. One can anticipate trends when the normalized SAR crosses above/under 0.
The converging nature of the SAR trailing stop allows for the trader to obtain a very apparent leading oscillator.

Parabolic SAR Buy Zone📈 Parabolic SAR Buy Zone — Early Trend Reversal Indicator
This script highlights bullish reversals based on the Parabolic SAR (Stop and Reverse) indicator.
🧠 Key Features:
Uses SAR parameters: Start: 0.02, Increment: 0.005, Max: 0.2
Visually marks the Buy Zone when SAR falls below the price
Background is light blue to show accumulation or early reversal zones
Yellow SAR dots help identify trend direction and potential exits
Includes alerts when SAR flips from bearish to bullish, signaling potential entry points
✅ Best Used For:
Identifying early trend reversals
Swing trading setups on daily or weekly charts
Combining with volume, RSI, or support zones for confirmation
🛎️ Customize alert to stay notified when new buy zones appear on your favorite stocks or cryptos.

Parabolic SAR Strategy with MACD Confirmation & Trend Zone Highl📝 Description (SEO + Follower-Friendly):
🚀 Powerful Trend Strategy Using Parabolic SAR + MACD
This advanced Pine Script combines the classic Parabolic SAR trend-following system with MACD crossover confirmation, improving entry precision and filtering out false signals. The script also features:
✅ Dynamic trend zone background highlighting when SAR is below price
✅ MACD filter ensures trades align with market momentum
✅ Custom SAR logic with adaptive acceleration
✅ Clean visual SAR plots for easy trend tracking
✅ Fully backtestable with strategy.entry logic
🔎 Ideal for traders seeking early trend entries, momentum confirmation, and visual clarity.
📈 Works on all timeframes and pairs — perfect for swing traders, scalpers, and crypto enthusiasts.
💡 Use it as a base strategy or combine with your favorite indicators.
❤️ If you find this helpful, don't forget to like, comment, and follow for more premium strategies!
Parabolic SAR Multiple Timeframe levels (TechnoBlooms)The Parabolic SAR (Stop and Reverse) is a valuable tool for traders due to its ability to provide clear signals for trend direction and potential reversal points. One of its primary benefits is the ease of use; it visually indicates whether the market is trending up or down, helping traders decide when to buy or sell. The indicator also aids in setting stop-loss orders as it moves with price, offering a dynamic way to manage risk by suggesting when to exit a position if the trend reverses.
Viewing the Parabolic SAR (PSAR) across multiple timeframes offers traders a comprehensive approach to understanding market trends and making strategic decisions. By analyzing the PSAR on shorter timeframes like 1-minute or 5-minute charts, traders can pinpoint precise entry and exit points for quick trades, capitalizing on immediate market movements.
Settings
> User can select 10 different timeframes according to their wish
> User can change Parabolic SAR settings like Start, Increment and Maximum Value

Parabolic SAR ZoneThe Parabolic SAR Zone indicator is a tool designed to help traders identify the best zone to enter in a position revisiting the usage of the standard Parabolic SAR indicator.
In the settings you can choose all the parameters of the standard indicator, and in addition to that you can also change the multiplier for the zone width.
This indicator provides two different Parabolic SAR indicators, the first one has the settings that you chose and displays the zone, meanwhile, the second one has half the parameters you have chosen and can be used to determine the long-term trend direction.
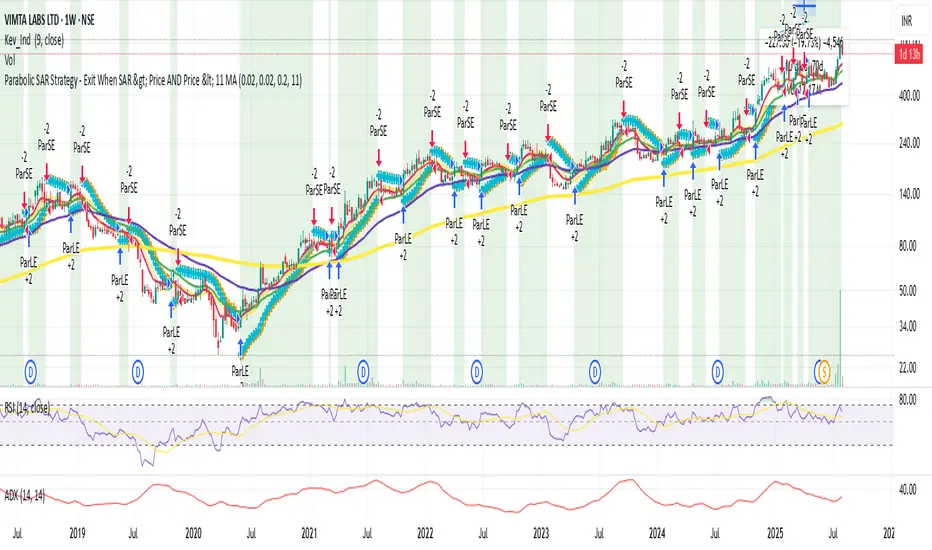
Parabolic SAR with Early Buy & MA-Based Exit Strategy📝 Strategy Description (Max SEO Impact)
This advanced Parabolic SAR-based trading strategy is designed to capture early trend reversals and exit intelligently using a dynamic moving average filter. It enters long trades when a PSAR reversal occurs, and exits only when the PSAR moves above price and the price falls below the 11-period SMA, helping avoid premature exits during volatile swings.
📌 Features:
• Custom Parabolic SAR calculation for refined trend tracking
• Background highlights during buy zones (SAR below price)
• Exit signals only when trend weakens (PSAR above + price under SMA)
• Red flag plotted on chart at exit bars for clear visual identification
• Works on all timeframes and instruments
Ideal for swing traders, trend followers, and strategy testers looking for smart PSAR-based entries with smoother exits.

Parabolic SAR Strategy with Bactesting RangeStandard Parabolic SAR Strategy with SAR level plotted and backtesting range option.

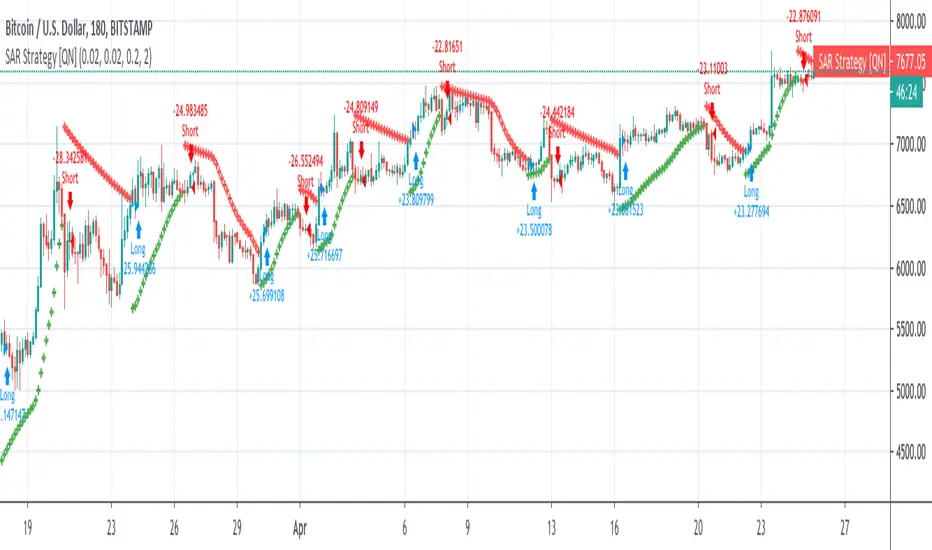
Parabolic SAR Strategy (on close) [QuantNomad]Created a Parabolic SAR strategy where price has to close under/above the level before for it to reverse. This way it should be a bit more stable and protect you from false breakouts.
It was impossible to adjust the built-in "sar" function so I implemented PSAR from scratch. So if you're interested in how it's work inside you can check the code and probably adjust to your need if you have a custom modification of PSAR in your mind.