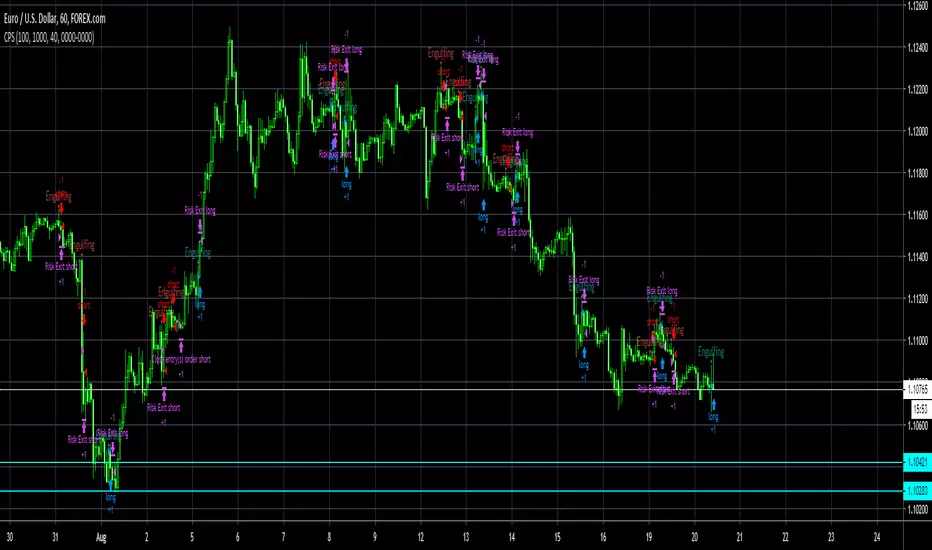
Candle Patterns Strategy - 2New risk management system: order entry, moving stop loss to breakeven + moving average filter (SMA)Strategi Pine Script®oleh DanyCheTelah dikemas kini 133
Candle Patterns Strategy V1//Modify DanyChe script to work in latest version of pinescript //The script allows you to test popular candlestick patterns on various instruments and timeframes. In addition, you can configure risk management (if the value is zero, it means the function is disabled), and you can also specify the time of the trading session (for example, so that the positions are not transferred to the next day). //The author is grateful to JayRogers and Phi35, their code examples helped a lot in writing the strategy.Strategi Pine Script®oleh MRKCHAMPION55122
Candle Patterns Strategy//I saw this code from DanyChe, i modify it to work on the latest version of pinescript //The script allows you to test popular candlestick patterns on various instruments and timeframes. In addition, you can configure risk management (if the value is zero, it means the function is disabled), and you can also specify the time of the trading session (for example, so that the positions are not transferred to the next day). //The author is grateful to JayRogers and Phi35, their code examples helped a lot in writing the strategy.Strategi Pine Script®oleh MRKCHAMPION52
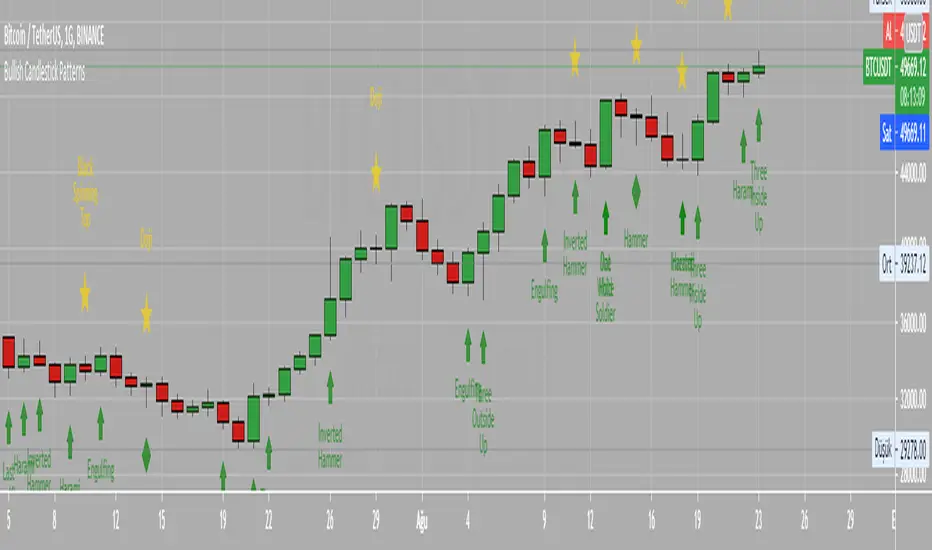
Bullish Candlestick PatternsBullish Abandone Baby Bullish Above The Stomach Bullish Belt Hold Bullish Breakaway Bullish Concealing Baby Swallow Bullish Counterattack Lines Bullish Deliberation Block Bullish Descent Block Bullish Doji Star Bullish Downside Gap Two Rabbits Bullish Dragonfly Doji Bullish Engulfing Bullish Hammer Bullish Harami Bullish Harami Cross Bullish High Price Gapping Play Bullish Homing Pigeon Bullish Hook Reversal Bullish Inverted Hammer Bullish Island Reversal Bullish Kicking Bullish Ladder Bottom Bullish Last Engulfing Bottom Bullish Mat Hold Bullish Matching Low Bullish Meeting Line Bullish Morning Doji Star Bullish Morning Star Bullish On Neck Bullish One White Soldier Bullish Piercing Line Bullish Rising Three Methods Bullish Rising Window Bullish Separating Lines Bullish Side by Side White Lines Bullish Stick Sandwich Bullish Takuri Line Bullish Three Gap Downs Bullish Three Inside Up Bullish Three Line Strike Bullish Three Outside Up Bullish Three Stars in the South Bullish Three White Soldiers Bullish Thrusting Line During Uptrend Bullish Tower Bottom Bullish Tristar Bullish Tweezers Bottom Bullish Two Rabbits Bullish Unique Three River Bottom Bullish Upside Gap Three Methods Bullish Upside Tasuki GapPenunjuk Pine Script®oleh ceyhunTelah dikemas kini 66 1 K
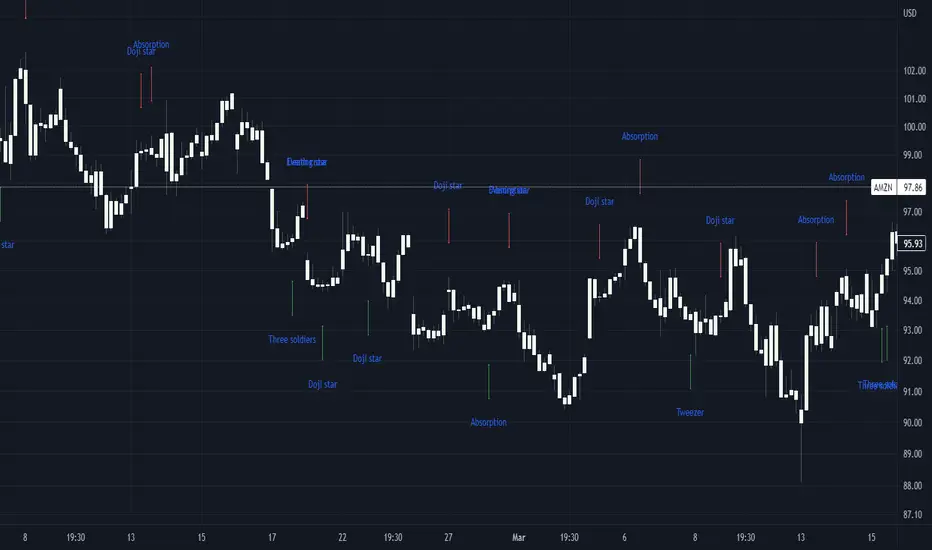
Basic candle patternsBasic candle patterns marker marks: - Doji stars - Doji graves - Doji dragonflies - Hammers - Reversed hammers - Hanging mans - Falling stars - Absorption up/down - Tweezers up/down - Three inside ups/downsPenunjuk Pine Script®oleh RomanLosevTelah dikemas kini 1212505
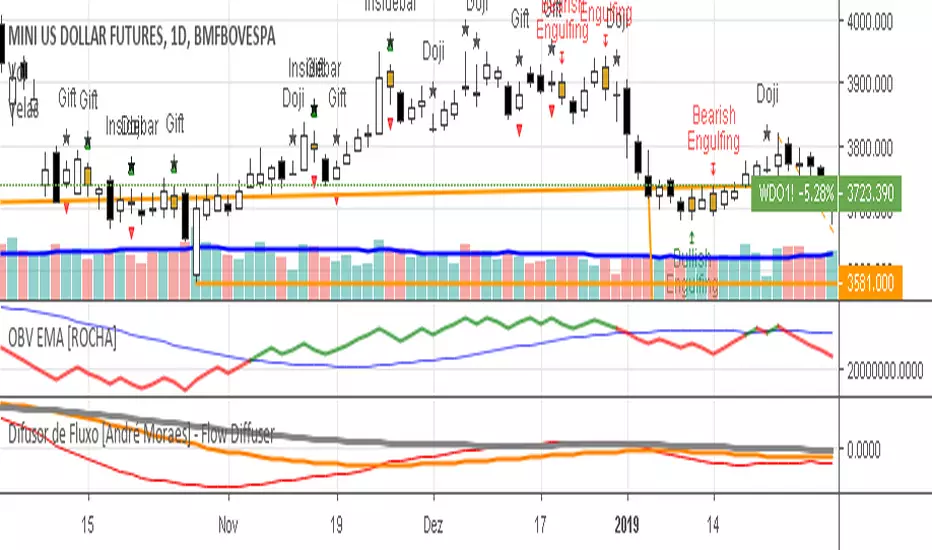
Candlesticks Patterns Identified [ROCHA]Candlesticks Patterns IdentifiedPenunjuk Pine Script®oleh alexandressrochaTelah dikemas kini 66362
Candle Patterns without LabelsThis is the same as other candle patterns it appears above and below candles except there are no labels just small icon.Penunjuk Pine Script®oleh autemox11230
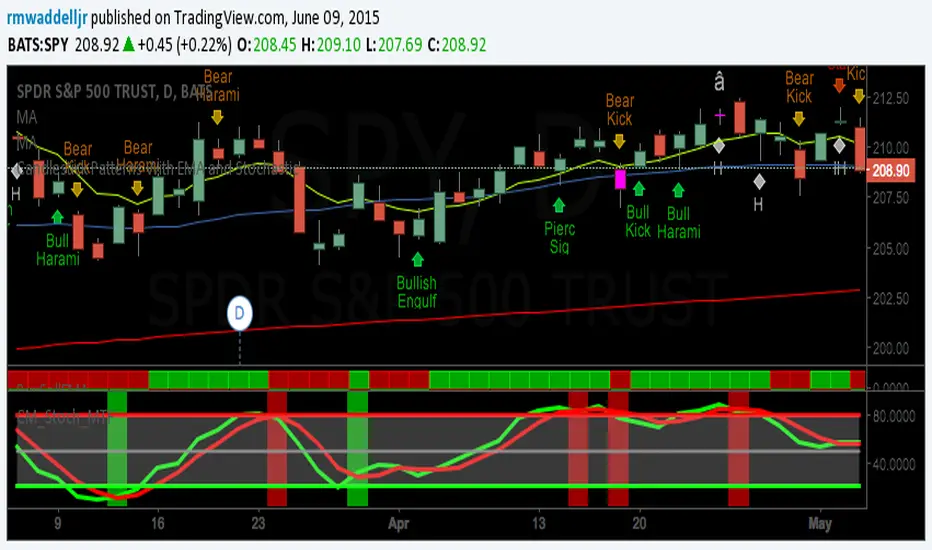
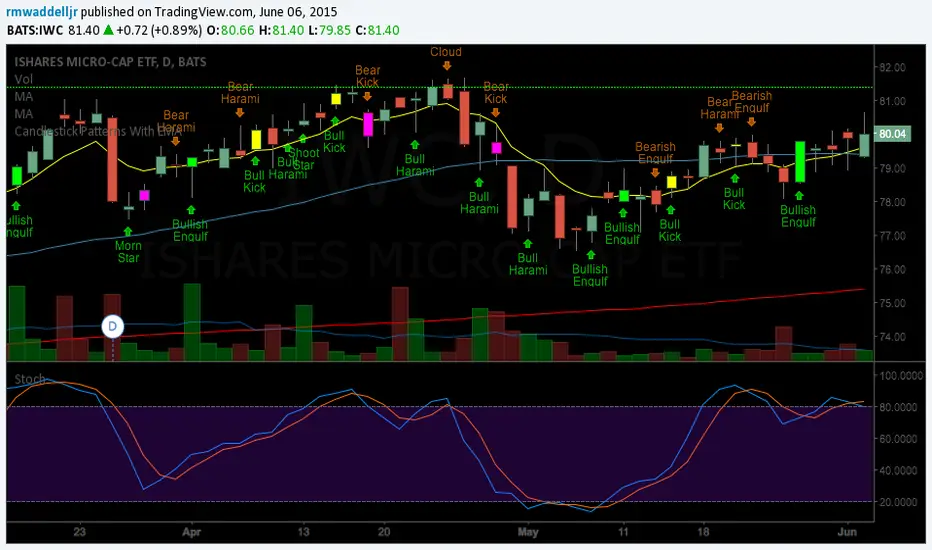
Candlestick Patterns With EMA and Stochastic6/11/15, Corrected barcolor errors. Candlestick patterns identified and color coded according to position above or below 8EMA(TLine). Special thanks to repo32, DavidR, and Chris Moody for coding ideas. Bullish candlestick buy signals have a greater probability of success when Stochastics are oversold. Bearish ones have a greater probability of success when overbought. Stack as many factors in your favor as possible. A candlestick signal by itself is of little value unless you apply additional information with it. An 8 EMA is coded also to help with buy/sell signals. Some of the videos by Steven Bigalow are on the Web to see how he uses it. www.youtube.com Regardless of systems and strategies used, make your second trade first: Know when you're going to exit. Risk management rules. Good luck and good trading.Penunjuk Pine Script®oleh rmwaddelljr1111 3.1 K
Candlestick Patterns With EMA and StochasticCandlestick patterns identified and color coded according to position above or below 8EMA(TLine). Special thanks to repo32, DavidR, and Chris Moody for coding ideas. Bullish candlestick buy signals have a greater probability of success when Stochastics are oversold. Bearish ones have a greater probability of success when overbought. Stack as many factors in your favor as possible. A candlestick signal by itself is of little value unless you apply additional information with it. Regardless of systems and strategies used, make your second trade first: Know when you're going to exit. Risk management rules. Good luck and good trading.Penunjuk Pine Script®oleh rmwaddelljr 1 K
Candlestick Patterns With EMA Thanks to repo32 as I embellished on his script "Candlestick patterns Identified" I also copied code ideas from DavidR and Chris Moody. I have huge respect for you guys who publish script with such ease. My coding is a work in progress. This script still needs improving. So let me know if you have suggestions. The whole idea was to present these patterns in context of Steve Bigalow's work. I hope it helps in some way. Penunjuk Pine Script®oleh rmwaddelljr11903
Candlestick Patterns Identified (updated 3/11/15)I decided to republish this one without the trend filter and with all the major symbols active. This will allow for all the patterns to show up. Due to 15 different candlestick formations in this one script, it will be difficult to turn off the last few due to screen size. You can turn off individual patterns on the settings screen. I have everything spelled out except the hammer and inverted hammer. They are "H" and "IH" respectively on the charts. They show up so often that they cluttered the charts. The default script has: Doji, Evening Star, Morning Star, Shooting Star, Hammer, Inverted Hammer, Bearish Harami, Bullish Harami, Bearish Engulfing, Bullish Engulfing, Piercing Line, Bullish Belt, Bullish Kicker, Bearish Kicker, Hanging man, and Dark Cloud Cover. You can turn off what you don't like. The Piercing Line, Bullish Belt, and the Kickers will usually show up better in the daily charts. I recommend watching videos with Stephen Bigalow to get a feel for how to trade these. You will want to add an 8 EMA to your chart with his setups. Enjoy. If you want the old version: Take a look at the related ideas below.Penunjuk Pine Script®oleh repo32Telah dikemas kini 266266 31.8 K
RWB Rocket PatternRWB Rocket Pattern OVERVIEW This indicator visualizes the Red White Blue (RWB) momentum system using 13 lines on your chart: 6 short-term EMAs (red), 6 long-term EMAs (blue), and a dotted close line. When all 12 EMAs stack perfectly from shortest on top to longest on bottom with a visible gap between the red and blue groups, the stock is in a "Rocket" pattern — a strong sustained uptrend. The close line (13th line) shows whether price is leading the averages higher. EMA PERIODS Red (short-term): 3, 5, 8, 10, 12, 15 Blue (long-term): 30, 35, 40, 45, 50, 60 SIGNALS ROCKET (green label) — Strong Rocket. All 12 EMAs perfectly stacked with white space and close leading above all red EMAs. Strongest bullish signal. RWB (green triangle) — Perfect RWB stacking formed but close not yet leading all reds. Bnce (teal diamond) — Price dipped into the red EMAs and bounced back above them while the RWB structure held. Potential re-entry point. X (red cross) — Close dropped below the lowest red EMA. Early warning of breakdown. Lost (orange triangle) — Perfect RWB stacking has broken down. SUB (red label) — Submarine. All 12 EMAs inversely stacked. Bearish. RIBBON FILLS Green fill between red and blue ribbons = healthy white space gap (bullish). Orange fill = gap has collapsed (caution). DASHBOARD The corner table shows a real-time Rocket Strength Score (0-100) and pattern status including EMA stacking, white space width, close position, how many EMAs are rising, and how long the pattern has held. HOW TO USE 1. Apply to a Weekly chart for the classic RWB setup. Daily also works. 2. Look for scores above 90 with "STRONG ROCKET" status for high-conviction momentum stocks. 3. Use Bnce signals to time re-entries on pullbacks within an active Rocket. 4. Watch for X crosses and Lost signals as exit warnings. 5. Avoid longs when SUB (Submarine) is active. ALERTS Six built-in alerts are included. Right-click the indicator, select "Add Alert", and choose from: Strong Rocket, RWB Formed, Rocket Lost, Bounce Into Reds, Close Below Reds, or Submarine Formed. SETTINGS All EMA periods, colors, ribbon fills, signals, background tinting, and dashboard position are configurable in the indicator settings. DISCLAIMER For educational purposes only. Not financial advice. Always perform your own research before making trading decisions.Penunjuk Pine Script®oleh alainraad4
ICT Liquidity Sweep/Swing Fail Pattern V.1# ICT Liquidity Sweep/Swing Fail Pattern V.1 ## Indicator Description & User Guide --- ## 📊 Indicator Overview **Name:** ICT Liquidity Sweep/Swing Fail Pattern V.1 **Type:** Support/Resistance & Liquidity Detection **Trading Style:** ICT Concepts (Inner Circle Trader) **Best Timeframes:** 1M, 5M, 15M, 1H --- ## 🎯 Core Features ### 1. **Support & Resistance Lines** - Automatically draws key swing high and swing low levels - Based on significant pivot points in price structure - Updates dynamically as new swings form ### 2. **"X" Mark - Liquidity Sweep** - **Symbol:** X marker on chart - **Meaning:** Indicates a liquidity sweep (stop hunt) - **What it shows:** Price briefly moved beyond a key level to trigger stops, then reversed - **Trading significance:** High-probability reversal zones after liquidity is taken ### 3. **"SFP" Label - Swing Failure Pattern** - **Symbol:** SFP text label - **Meaning:** Swing Failure Pattern detected - **What it shows:** Price attempted to make a new high/low but failed and reversed sharply - **Trading significance:** Strong reversal signal - smart money rejecting the level --- ## 📈 How to Use This Indicator ### Entry Setup Strategy: #### **For SHORT Trades (Sell):** 1. Wait for **SFP** to appear at a swing high 2. Look for **X marker** confirming liquidity sweep above the high 3. **Entry Zone (Red Box):** Enter SHORT positions when price returns to this zone 4. **Stop Loss:** Place above the red zone (above the swept high) 5. **Take Profit (Green Box):** Target the green zone below #### **For LONG Trades (Buy):** 1. Wait for **SFP** to appear at a swing low 2. Look for **X marker** confirming liquidity sweep below the low 3. **Entry Zone (Green Box):** Enter LONG positions when price returns to this zone 4. **Stop Loss:** Place below the green zone (below the swept low) 5. **Take Profit (Red Box):** Target the red zone above --- ## 🎨 Color Coding System | Color | Zone Type | Usage | |-------|-----------|-------| | 🔴 **Red Box** | Stop Loss / Supply Zone | Place SL here for LONG trades / Entry zone for SHORT trades | | 🟢 **Green Box** | Take Profit / Demand Zone | Target zone for LONG trades / Place SL here for SHORT trades | | ❌ **X Mark** | Liquidity Sweep Point | Stop hunt occurred - reversal likely | | 📝 **SFP Label** | Swing Failure Pattern | Failed breakout - strong reversal signal | --- ## 💡 Trading Examples ### Example 1: SHORT Trade (As shown in your chart) ``` 1. SFP appears at swing high (Red zone around 4,000) 2. X marker confirms liquidity sweep above the high 3. Entry: SHORT when price re-enters red zone 4. Stop Loss: Above red zone (e.g., 4,002) 5. Take Profit: Green zone below (3,964-3,972) 6. Risk:Reward = 1:3+ ``` ### Example 2: LONG Trade ``` 1. SFP appears at swing low (Green zone) 2. X marker confirms liquidity sweep below the low 3. Entry: LONG when price re-enters green zone 4. Stop Loss: Below green zone 5. Take Profit: Previous red zone above 6. Risk:Reward = 1:2 minimum ``` --- ## ⚠️ Important Trading Rules ### ✅ DO: - Wait for BOTH SFP and X marker confirmation - Enter on price returning to the zone (not on first touch) - Use proper position sizing (1-2% risk per trade) - Combine with market structure analysis - Look for confluences (orderblocks, fair value gaps) ### ❌ DON'T: - Trade against the higher timeframe trend - Enter without confirmation signals - Ignore the colored zones for SL/TP placement - Overtrade - wait for quality setups - Move stop loss to breakeven too early --- ## 🔧 Indicator Settings (Typical) **Adjustable Parameters:** - Swing Length: Number of bars to identify swing points - Show/Hide X markers - Show/Hide SFP labels - Zone opacity and colors - Line thickness --- ## 📚 ICT Concepts Explained ### **Liquidity Sweep:** Smart money intentionally pushes price beyond key levels to trigger retail stop losses, then reverses to their intended direction. The X marker identifies these moments. ### **Swing Failure Pattern (SFP):** Price attempts to make a new high/low but lacks follow-through, indicating weak momentum and likely reversal. Similar to a "false breakout" but more specific to swing structures. ### **Supply & Demand Zones:** - **Red zones** = Areas where selling pressure overwhelmed buyers - **Green zones** = Areas where buying pressure overwhelmed sellers - These zones act as magnets for price to return and react --- ## 🎓 Best Practices 1. **Confluence is Key:** - Combine with daily/weekly bias - Check for orderblocks nearby - Look for imbalances (FVG) 2. **Session Timing:** - Best during London/New York sessions - Avoid low liquidity periods 3. **Risk Management:** - Never risk more than 1-2% per trade - Use proper lot sizing - Take partial profits at key levels 4. **Timeframe Correlation:** - Check higher timeframe for bias - Enter on lower timeframe for precision - Exit based on higher timeframe targets --- ## 📞 Support & Updates **Version:** 1.0 **Compatibility:** TradingView Pine Script v5 **Updates:** Regular improvements based on ICT methodology --- ## ⚡ Quick Reference Card | Signal | Action | SL Placement | TP Target | |--------|--------|--------------|-----------| | SFP + X at High | SHORT at Red Zone | Above Red | Green Zone | | SFP + X at Low | LONG at Green Zone | Below Green | Red Zone | **Remember:** The indicator shows you WHERE to trade, but YOU decide WHEN based on confirmation and market context. --- *Disclaimer: This indicator is a tool for technical analysis. Always use proper risk management and never trade with money you cannot afford to lose.*Penunjuk Pine Script®oleh wut_trader99 3.7 K
Bassi's Pattern Breakout IndicatorBASSI'S PATTERN BREAKOUT INDICATOR Author: Bassi | Published 2025 One of the cleanest and most accurate classic pattern detectors on TradingView – proudly coded and shared by Bassi. Detects & confirms breakouts from: • Double Top / Double Bottom • Triple Top / Triple Bottom • Head & Shoulders • Inverse Head & Shoulders Key Features: • 100% non-repainting – signals only appear after candle close • Smart breakout confirmation using the correct neckline level • Visual pattern drawing (tops/bottoms + necklines) • Clear breakout labels with vertical confirmation lines • Real-time TradingView alerts (one alert per bar close) • All alerts include "Bassi" prefix so you know it's the original • Dynamic coloring for Double Bottom (red in lower areas, green in higher areas) • No messy BUY/SELL labels – clean professional look (as requested by the community) Why traders love it: - Extremely reliable on all timeframes (1m to monthly) - Works perfectly on Forex, Stocks, Crypto, Indices - No false signals during consolidation - Perfect for swing trading, scalping and position trading Settings: • Pivot Left/Right Bars – adjust sensitivity • Price Tolerance % – how flat the tops/bottoms must be • Max Pivot Storage – memory management • Enable/disable alerts and visual markers How to use: 1. Add to chart 2. Create alert → select "Bassi's Pattern Breakout Indicator" 3. Choose "Once per bar close" 4. Get notified instantly on every confirmed breakout! This is the original and only authorized version by Bassi. If you enjoy this indicator, please leave a like and follow for future updates! © Bassi 2025 – All rights reserved #pattern #breakout #doubletop #doublebottom #headandshoulders #tradingview #bassiPenunjuk Pine Script®oleh Mahdibas36
IU Engulfing Candlestick PatternDISCRIPTION 📈 The IU Engulfing Candlestick Pattern indicator spotlights both bullish and bearish engulfing formations in real‑time. It shades each pattern with a transparent box and drops a concise label so you can catch potential reversals at a glance—no clutter, no noise, just the candles that matter. USER INPUTS : 1. Pattern Recognition Based on = “Both” | “Wicks” | “Body” ( Default Both ) • Both → only highlights candles that satisfy **both** wick‑and‑body engulfing rules • Wicks → checks full candle range (high‑to‑low) • Body → checks only the real bodies (open‑to‑close) 2. Show Labels ( Default true ) If ticked then it will show the text as "Bullish Engulfing" or "Bearish Engulfing". 3. Show The Box ( Default true) if ticked then it will show the green or red boxes. INDICATOR LOGIC: 🔹 Bullish Engulfing (green box) – Current bar closes higher than it opens and fully “wraps” the prior bar per your chosen rule. 🔹 Bearish Engulfing (red box) – Current bar closes lower than it opens and fully “wraps” the prior bar per your chosen rule. 🔸 When a pattern confirms: 1. The script records the local high/low range. 2. Draws a semi‑transparent box spanning the engulfing pair. 3. Prints a compact up/down label exactly at the reaction point. 4. Fires a once‑per‑bar alert (“Bullish Engulfing” / “Bearish Engulfing”) you can route to webhooks or notifications. WHY IT IS UNIQUE: ✨ Combines classic body‑only engulfing with an optional wick filter, letting traders demand stricter confirmation when markets are noisy. ✨ Box overlays visually segment the engulfed range—clearer than single‑bar markers. ✨ Lightweight: one input, zero repaint, and capped at 500 boxes to keep charts responsive. ✨ Ready‑to‑use alerts—no extra code needed for automation. HOW USER CAN BENIFIT FROM IT : - Spot early reversal zones or continuation thrusts without scanning candle by candle. - Pair the alerts with trading bots, TradingView strategy testers, or mobile push notifications. - Adapt the strictness (Body vs. Wicks vs. Both) to suit different assets, timeframes, or volatility regimes. - Use the colored range boxes as dynamic support/resistance references for entries, targets, and stop‑loss placement. 📌 Tip: Test on multiple instruments and timeframes to find the sweet spot that matches your risk profile. This script is for educational purposes—always combine with sound risk management and confirm signals with broader market context. Disclaimer : This Video is not financial advice, it's for educational purposes only highlighting the power of coding( pine script) in TradingView, I am not a SEBI-registered advisor. Trading and investing involve risk, and you should consult with a qualified financial advisor before making any trading decisions. I do not guarantee profits or take responsibility for any losses you may incur. Penunjuk Pine Script®oleh Shivam_Mandrai139
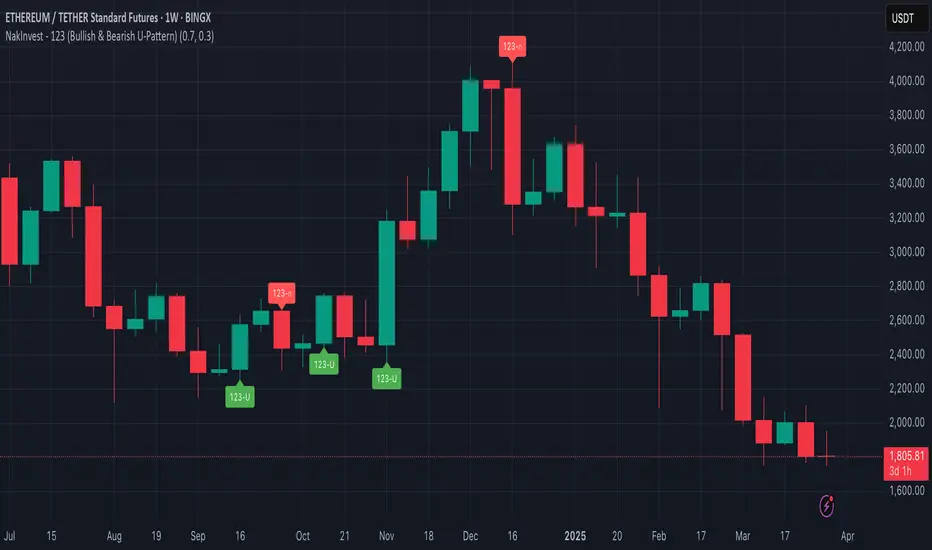
NakInvest - 123 (Bullish & Bearish U-Pattern)📘 Description: U-Shape 123 (Bullish & Bearish Identifier) This indicator helps you identify the 123 reversal pattern, a powerful yet simple price action setup taught by renowned Brazilian trader Stormer. I learned this pattern from Lucas Nakata, founder of NakInvest, who was a student of Stormer. Stormer has popularized and refined this setup in the Brazilian trading community, especially for identifying U-shaped reversals that precede strong directional moves. ⸻ 🔎 What is the 123 Pattern? The 123 pattern is a 3-candle formation used to spot bullish or bearish reversals. It forms a “U” or inverted “U” shape and is based purely on candlestick structure — no indicators or lagging signals. There are two versions: ✅ Bullish 123 (“U” pattern) • Candle 1: Red candle with a large body (selling pressure). • Candle 2: Small candle of any color (pause or indecision). • Candle 3: Green candle with a body at least 70% the size of candle 1 (strong bullish push). This indicates a potential bullish reversal from a prior downtrend. ❌ Bearish 123 (inverted “U” pattern) • Candle 1: Green candle with a large body (buying pressure). • Candle 2: Small candle of any color (pause or indecision). • Candle 3: Red candle with a body at least 70% the size of candle 1 (strong bearish push). This indicates a potential bearish reversal from a prior uptrend.Penunjuk Pine Script®oleh feliperazeek22250
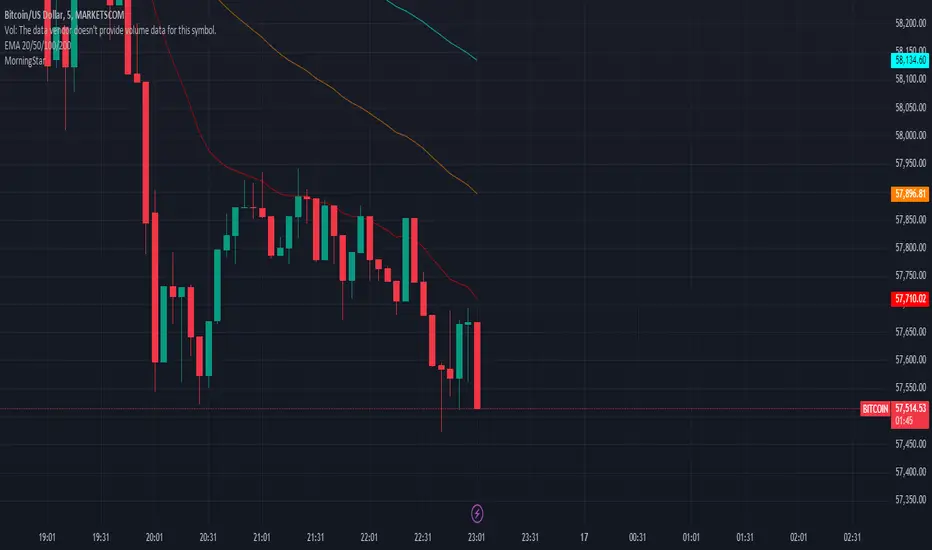
Morning Star Pattern### Purpose and Use of the Output - **Identifying Bullish Reversal**: The Morning Star pattern is a bullish reversal signal that traders look for at the end of a downtrend. When this pattern appears, it suggests that the market may be shifting from bearish to bullish sentiment. - **Trading Decisions**: Traders can use this indicator to make informed decisions about entering long positions. The appearance of the Morning Star pattern may prompt traders to buy, anticipating a price increase. - **Visual Representation**: The plotted shape on the chart provides a visual cue for traders, making it easier to spot potential trading opportunities without having to analyze each candle manually. ### Conclusion This Pine Script code is a useful tool for traders who want to automate the detection of the Morning Star candlestick pattern on their charts. By visually marking this pattern, traders can quickly identify potential bullish reversal points and make more informed trading decisions.Penunjuk Pine Script®oleh shubshete00716
Smarter Pullback + Candlestick Pattern (Steven Hart)Built with love "Smarter Pullback + Candlestick Pattern" This indiator will help you to find a Pullback + Candlestick Pattern, inspirated by Steven Hart You can combine with your own strategy, or use this purely DISCLAIMER : Measure the risk first before use it in real market Backtest The Strategy was very important, so you know the probability Fundamentally Logical : Pullback (Some Previous candle is Red for Bull Pullback vice versa) the Entry candle must be a Candlestick Pattern Features : 1. Engulfing 2. Hammer & Shooting Star 3. Doji How to use it : 1. Adjust the Pullback Period 2. Check and Uncheck the Pattern you want to see 3. Adjust the style to your favourite Regards, Hanabil Penunjuk Pine Script®oleh hanabilTelah dikemas kini 55789
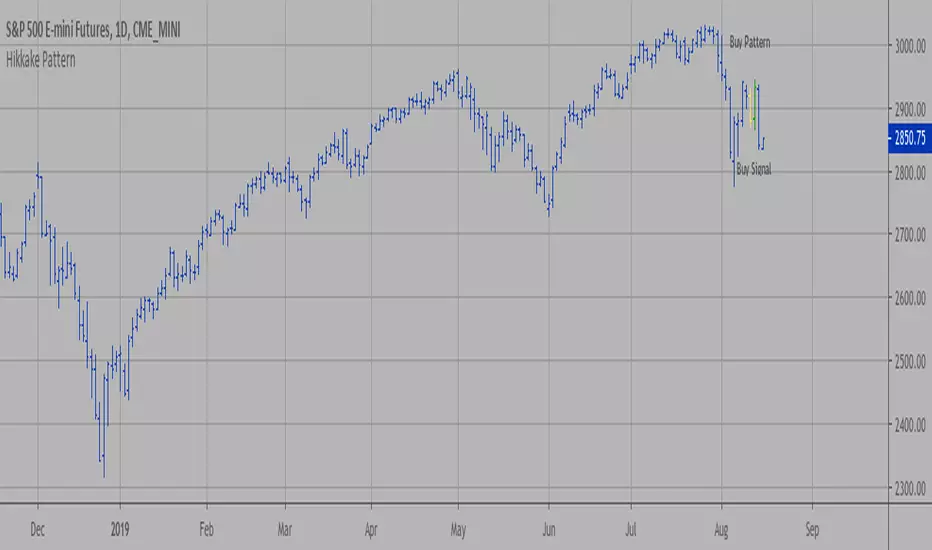
Hikkake Pattern The hikkake pattern is a price pattern used by technical analysts and traders hoping to identify a short-term move in the market's direction. The pattern has two different setups, one implying a short-term downward movement in price action, and a second setup implying a short-term upward trend in price. The Hikkake pattern (pronounced Hĭ KAH kay) is a complex bar or candle pattern that begins to move in one direction but reverses quickly and is said to establish a forecast for a move in the opposite direction. This pattern was developed by Daniel L. Chesler, CMT, who published a description of the pattern first in 2003.Penunjuk Pine Script®oleh HPotter44167
DR Pattern Strategy Beta1DR Pattern Strategy Beta1 Test only DR Pattern Strategy Beta1 Test only DR Pattern Strategy Beta1 Test only Penunjuk Pine Script®oleh Wolfhedge223
Swing Failure Pattern Strategy Btc Only 5min🔍 Overview The Swing Failure Pattern (SFP) Strategy is a pure price-action trading system designed to capture liquidity sweeps and market reversals around key swing highs and lows. It is based on the concept that price often briefly breaks a swing level to trigger stop-losses, then reverses in the opposite direction. This strategy trades only confirmed SFP setups, ensuring disciplined entries with clearly defined risk. 📈 Bullish SFP (Long Setup) A Bullish Swing Failure Pattern forms when: A valid swing low is created Price wicks below the swing low The candle closes back above the swing level Confirmation occurs when price closes above the opposing high ➡️ Action: Enter LONG on the confirmation candle close 📉 Bearish SFP (Short Setup) A Bearish Swing Failure Pattern forms when: A valid swing high is created Price wicks above the swing high The candle closes back below the swing level Confirmation occurs when price closes below the opposing low ➡️ Action: Enter SHORT on the confirmation candle close 🛑 Risk Management Stop Loss Long → Low of the SFP wick Short → High of the SFP wick Take Profit Fixed Risk : Reward = 1 : 2 All SL and TP levels are fixed at entry (no repainting) 🔁 Trailing Take Profit (Optional) Trailing TP can be enabled from settings Trailing starts after 1R profit Trail distance is R-based and fully adjustable Works for both long and short trades ⏰ Time Filters Optional No-Trade on Saturday & Sunday Prevents new entries during weekends Active trades continue to manage SL & TP normally ⚙️ Strategy Features Price-action based (no indicators) Confirmation-only entries No repainting logic Works on all markets and timeframes Orders executed on candle close 🎯 Best Use Cases Forex Indices Crypto Futures Best performance during London & New York sessions ⚠️ Disclaimer This strategy is intended for educational and backtesting purposes only. Always test and manage risk appropriately before live trading.Strategi Pine Script®oleh Danish742111
Inside Bar Breakout ( candlestick pattern).📌 What Is This Indicator? BOIB Pro identifies a very strict form of inside bar: ✅ The inside bar candle’s entire range (body + wicks) must be inside the BODY of the previous candle (mother candle). ❌ If even a single wick is outside the mother body, the setup is rejected. This filters out weak and noisy inside bars and focuses only on true compression candles. ⸻ 📐 Pattern Rules (Strict) 1️⃣ Mother Candle • The candle immediately before the inside bar 2️⃣ Body-Only Inside Bar (BOIB) A valid BOIB must satisfy: • Inside bar high ≤ mother candle body high • Inside bar low ≥ mother candle body low ⚠️ Normal inside bars (inside wicks only) are ignored. ⸻ ⏱️ Breakout Window Logic After a valid BOIB forms: • The indicator waits for the next 1 to 5 candles (user-configurable) • Entry is triggered only if price CLOSES outside the BOIB range ✅ Long Signal • Candle closes above BOIB high ✅ Short Signal • Candle closes below BOIB low If no breakout occurs within the window → setup expires automatically ⸻ 🎯 Entry, Stop Loss & Take Profit Logic Once a valid breakout/breakdown occurs, the indicator automatically draws a professional trade template: Entry • At the close of the breakout candle Stop Loss • Long → below BOIB low • Short → above BOIB high • Optional buffer: • ATR-based • Percentage-based • Or none Take Profits • TP1: Risk-Reward based (default 1R) • TP2: Extended target (default 2R) All levels are clearly visualized using: • Horizontal price lines • Risk and reward boxes • Informational labels ⸻ 📊 Best Use Cases • Crypto (BTC, ETH, major alts) • Timeframes: • Scalping: 5m • Day trading: 15m / 30m • Works best when combined with: • Market structure • Trend bias • Support / resistance ⸻ ⚠️ Important Notes • This is NOT an auto-trading system • Signals should always be used with: • Proper risk management • Market context • Inside bars in sideways or low-volume markets may fail ⸻ 📚 Educational Purpose Disclaimer This indicator is provided for educational and analytical purposes only. It does not constitute financial advice. Trading involves risk, and past behavior does not guarantee future results.Penunjuk Pine Script®oleh Thebitcoin371136
SAMIR-Pattern Detector: (Debug Mode)fractal pattern to descover movment action then apply fibo on the patternPenunjuk Pine Script®oleh abohadeel2509411111