Penunjuk Pine Script®
Cari dalam skrip untuk "pattern"

Cross Asset Class Row Stack v2What You're Seeing
Looking at your cross-asset indicator, you have a global market pulse showing:
US Equities (top rows) - SPY, QQQ, RUT, NDX, DJI, RSP
These show the health of American stock markets across different segments
Large cap, tech, small cap, blue chip, etc.
Risk Indicators - VIX, US10YR
VIX measures fear/volatility
Bond yields show rate expectations and inflation sentiment
Commodities & Currencies - OIL, USDJPY, DXY, CXY
Oil reflects global growth and energy demand
USD pairs show dollar strength vs other currencies
These are leading indicators for inflation and economic health
International Markets - NIFTY, GER40, HK50, UK100, HSI, IRUS, PSEI, AU30
Show if weakness/strength is global or US-centric
Emerging markets vs developed markets
Why This Matters
The pattern across all assets tells you:
If everything is green → Risk-on, growth sentiment strong, global demand healthy
If tech (QQQ, MAG5) is down but commodities up → Inflation concerns, Fed tightening
If VIX is high and bonds rallying (US10YR down) → Flight to safety, market stress
If emerging markets lag → Risk appetite weakening
If USD strength (DXY up) → Safe haven buying, emerging market headwinds
What You Should Expect Next 📊
Based on typical market mechanics:
Sector Rotation Clues
If small caps (RUT) underperform large caps (SPY) → Flight to quality, economic slowdown ahead
If tech (QQQ) rallies hard → Risk appetite, rate cut expectations, or AI enthusiasm
Divergences Signal Turns
When international markets diverge from US (HSI, GER40 weak but SPY strong) → Warning sign
When bonds rally hard while stocks hold up → Market pricing in cuts soon
Commodity-Equity Relationship
Oil up + Equities down = Stagflation risk
Oil down + Equities up = Goldilocks scenario (growth without inflation)
Currency Strength
Strong USD (DXY up) typically coincides with:
Weak emerging markets (NIFTY, PSEI struggle)
Tech underperformance (rate sensitivity)
Commodity underperformance (priced in USD)
Mean Reversion Signals
When one asset class (like commodities) gets too extreme vs others → Rotation likely
When VIX diverges from market movements → Volatility expansion expected
Action Items to Monitor 🎯
Create alerts for:
Divergence events - When your top gainers/losers change dramatically
Sector strength shifts - Watch if DJI outperforms QQQ (value vs growth)
International weakness - If Asian/European indices start failing while US holds
Rate signals - US10YR changes often precede equity moves
Dollar extremes - DXY above/below key levels affect emerging markets
Example Scenario from Image 1
Looking back at your first chart, if I saw:
QQQ, MAG5, NDX down (tech weak)
OIL, DXY, US10YR rising (inflation/rate concerns)
NIFTY, GER40 weaker than SPY (US insulated but others suffering)
I'd expect: Continued rotation from growth to value, rate hikes priced in longer, and potential emerging market weakness ahead.
The power of this indicator: It lets you see correlation breakdowns at a glance. When correlations break → opportunities and risks emerge! 📈
Does this framework help? What specific patterns are you seeing in your current data? 🤔
Penunjuk Pine Script®

Probability Zone - Forex KemangKey Features:
✅ Multi-Zone Detection:
Fibonacci levels (bullish & bearish)
Supply/Demand zones (RBD & DBR patterns)
Support/Resistance (pivot points)
First Candle Box (H1 range, first 3 hours)
✅ Probability Box with Percentage:
BUY LINE (green) with the text "BUY X%" when the convergence zone supports buying
SELL LINE (red) with the text "SELL X%" when the convergence zone supports selling
Percentage 0-100% based on the number of zones that meet
✅ How it Works:
The indicator scans all zones (Fibonacci, S/D, S/R)
When multiple zones meet in the same area (the threshold can be adjusted)
Calculates BUY/SELL probability based on zone type
Creates boxes with percentage labels
✅ Customizable Settings:
Minimum Probability: Only displays zones with a probability ≥ X%
Zone Convergence Threshold: How close the zones should meet (0.1-2.0%)
Buy, Sell, and High Probability Zone Colors
✅ Info Table (top right):
Current Direction (Buy/Sell)
Current Price Probability
Number of Detected Zones
Penunjuk Pine Script®

SMC Pro BTC - ICT Order Blocks & FVG [DOE]# SMC Pro BTC - ICT Order Blocks & FVG
A multi-timeframe smart money concepts engine built exclusively for Bitcoin. This indicator combines order blocks, fair value gaps, liquidity sweeps, break of structure, and premium discount zone analysis into one backtest-verified, non-repainting strategy — every signal you see in history is exactly what you would have seen live.
Built by a former quantitative analyst from a US-based systematic fund. The structural logic behind this indicator is the same order flow mechanics that institutional algorithms use to identify and exploit liquidity imbalances — adapted for retail traders on TradingView. At the fund, we did not use RSI or MACD. We tracked where unfilled orders sat, where liquidity clustered, and where price needed to travel to resolve imbalances. That is what Smart Money Concepts formalizes, and that is what this indicator automates.
This is a free, open-source tool. All backtest results below are fully reproducible on your chart with the default settings. No hidden parameters. No curve-fitting. No repainting.
## TWO STRATEGY MODES — CHOOSE YOUR RISK PROFILE
The indicator offers two distinct execution modes built on the same structural foundation. The difference is filter strictness — one prioritizes opportunity, the other prioritizes quality. Both include commissions and slippage in their backtested results, because a backtest without commissions is fiction.
### AGGRESSIVE MODE
Entries fire on any valid Break of Structure (BOS) or Change of Character (CHoCH) confirmed by an order block and fair value gap on the confirmation timeframe. This mode captures more setups, including momentum re-entries and early reversal signals. It accepts a lower win rate in exchange for catching a larger portion of trending moves.
| Metric | Value |
|---|---|
| Total Trades | 55 |
| Win Rate | 49.09% |
| Net P&L | +49.12% |
| Profit Factor | 1.41 |
| Max Drawdown | 14.70% |
A 49% win rate may not sound impressive on the surface. But this is not a coin flip. The 1.41 profit factor means that winning trades meaningfully outweigh losers — the strategy is designed to let winners run through a configurable risk-to-reward ratio. Over 55 trades with real commissions (0.075% per trade) and slippage (3 ticks per order), the system returned nearly 50% on initial capital. That is what positive expectancy looks like in practice.
Mark Douglas wrote that there is a random distribution between wins and losses for any set of variables that define an edge. You do not need to win every trade. You need an edge and the discipline to follow it over a series. This mode is built for that exact mindset.
### SELECTIVE MODE
Adds a premium/discount zone filter on top of all Aggressive conditions. Longs are only permitted in the discount zone of the higher-timeframe dealing range. Shorts are only permitted in the premium zone. This single structural filter cuts the trade count by more than half while dramatically improving signal quality.
| Metric | Value |
|---|---|
| Total Trades | 21 |
| Win Rate | 61.90% |
| Net P&L | +26.92% |
| Profit Factor | 2.347 |
| Max Drawdown | 8.66% |
A profit factor above 2.0 combined with single-digit drawdown is rare for any fully disclosed, non-repainting BTC strategy. The Selective mode achieves both over three full years of data. The tradeoff is fewer trades — 21 versus 55 — which means this mode requires patience. It is designed for traders who prefer waiting for optimal positioning over catching every move.
Both modes are provided so you can evaluate the tradeoff between frequency and precision on your own terms. There is no objectively "better" mode. There is only the mode that matches your risk tolerance and psychological profile.
## ENTRY LOGIC — STEP BY STEP
Every signal is generated through a strict multi-timeframe confluence model. No single condition is sufficient. The indicator requires alignment across structure, zone, imbalance, and liquidity before producing a signal. Here is the full logic for long entries — short entries mirror the process with inverted conditions.
### LONG ENTRY SEQUENCE
**Step 1 — HTF Directional Bias (Break of Structure)**
The Direction Timeframe (default: 4H) detects a bullish break of structure or change of character using swing highs and lows. This establishes the higher-timeframe directional bias. Without bullish structure on the HTF, no long signal can fire. This is the first gate.
**Step 2 — MTF Confirmation (Structural Alignment)**
The Confirmation Timeframe (default: 1H) must confirm with its own bullish BOS or CHoCH, aligning both timeframes in the same direction. This dual-timeframe structural alignment filters out a significant amount of noise and counter-trend traps.
**Step 3 — Order Block Identification**
The script looks back up to the configured OB Lookback Bars to find the last bearish candle before the impulsive bullish move — the order block where smart money accumulated positions. This zone represents an area of institutional demand that is likely to attract price on a revisit.
**Step 4 — Fair Value Gap Validation**
The indicator checks for a bullish fair value gap (the gap between candle 1's high and candle 3's low in a three-candle sequence) that overlaps the identified order block zone. An OB alone is a level. An OB combined with an FVG is confluence — two independent structural signals agreeing on the same price zone. This overlap is where the highest-probability entries concentrate.
**Step 5 — Liquidity Sweep Confirmation**
Before the signal can fire, the indicator verifies that a recent liquidity sweep occurred within the configured Sweep Memory window. A liquidity sweep means price dipped below a prior swing low, triggering stop-loss orders and pending sell orders, before reversing. This is the classic ICT stop hunt — institutional participants accumulating liquidity from retail stop-outs. Without this sweep, the setup lacks the liquidity fuel that drives the reversal.
**Step 6 — Premium/Discount Zone Filter (Selective Mode Only)**
In Selective mode, the entry must occur in the discount zone of the HTF dealing range, defined by the P/D Zone Threshold parameter. This ensures longs are taken only when price is trading at a structural discount — the lowest-risk portion of the range.
**Step 7 — Execution**
All conditions are met. The long signal fires on the next confirmed bar. Stop-loss is placed below the order block low minus the SL Buffer percentage. Take-profit is calculated at the configured Risk:Reward Ratio distance from entry. Both levels are plotted visually on the chart.
### SHORT ENTRY SEQUENCE
The short entry mirrors the long with inverted conditions across all seven steps:
1. HTF bearish BOS or CHoCH establishes bearish bias
2. MTF bearish BOS or CHoCH confirms the direction
3. Bearish order block identified (last bullish candle before the sell-off)
4. Bearish fair value gap overlaps the order block zone
5. Liquidity sweep above a prior swing high (stop hunt to the upside)
6. Price in the premium zone of the HTF dealing range (Selective mode only)
7. SL placed above OB high plus buffer; TP calculated at R:R distance below entry
Every step is objective. There is no discretionary component. The indicator either detects the confluence or it does not. This is not chart art — it is structure, codified.
## FEATURES
- Non-repainting, non-lookahead signals — barstate.isconfirmed enforced on all calculations; what you see in history is what you would have seen live
- Multi-timeframe structure analysis — HTF for direction, MTF for confirmation, entry timeframe for execution
- Order block detection with configurable lookback depth and automatic invalidation when price trades through the zone
- Fair value gap multi-zone display — shows up to N unfilled FVGs per direction simultaneously, configurable by maximum count and maximum distance from current price, so you only see the gaps that are structurally relevant to your current timeframe and price action
- Liquidity sweep recognition with adjustable memory window for detecting stop hunts before entries
- Break of Structure (BOS) and Change of Character (CHoCH) detection via swing-point analysis on multiple timeframes
- Premium/discount zone mapping from the HTF dealing range, with configurable threshold for zone extremes
- Automatic trade management — stop-loss and take-profit levels plotted with visual trade boxes on every signal
- Two strategy modes — Aggressive for opportunity-seeking traders, Selective for precision-focused traders
- Fully configurable parameters — every setting is exposed with sensible defaults optimized for BTC 4H
- Built-in strategy engine — run backtests directly in TradingView's Strategy Tester with your own commission and slippage settings
- Clean chart presentation — signals, zones, and labels are designed for readability on both desktop and mobile
## SETTINGS DOCUMENTATION
**Strategy Mode** — Aggressive / Selective
Aggressive uses the full confluence model: BOS/CHoCH + Order Block + FVG + Liquidity Sweep. Selective adds the premium/discount zone filter on top of everything. If you are new to smart money concepts, start with Selective — fewer signals, but each one carries stronger structural backing.
**Direction TF (HTF)** — Default: 240 (4H)
The higher timeframe that establishes directional bias through structural breaks. Increase to Daily (1440) for fewer, higher-conviction signals on larger moves. Decrease to 60 (1H) for more responsive structure detection on shorter swings.
**Confirmation TF (MTF)** — Default: 60 (1H)
The mid timeframe that confirms HTF bias before any entry can trigger. Must be lower than or equal to the Direction TF. The default 240/60 pair provides a 4:1 ratio that balances responsiveness with structural reliability.
**Swing Length** — Default: 10 | Range: 3-50
The number of bars used to identify swing highs and swing lows for structural analysis. Lower values increase sensitivity (more BOS/CHoCH signals, more noise). Higher values detect only major structural shifts. The default of 10 is balanced for BTC on the 4H timeframe.
**OB Lookback Bars** — Default: 15 | Range: 3-30
How far back the script searches for a valid order block after a structural break is detected. Smaller values yield higher precision but may miss valid blocks that formed earlier. Larger values capture more blocks but increase the risk of the OB being partially mitigated.
**Sweep Memory** — Default: 20 bars | Range: 5-50
The lookback window for detecting a liquidity sweep before confirming an entry. If valid sweeps are being missed on your asset or timeframe, increase this value. If you want tighter sweep-to-entry timing, decrease it.
**Risk:Reward Ratio** — Default: 2.0 | Range: 1.0-5.0
Determines take-profit placement relative to stop-loss distance. At 2.0, the TP is placed twice the SL distance from entry. Higher values produce larger winning trades but lower win rates. Always re-run the backtest after changing this setting to understand the impact on overall expectancy.
**SL Buffer %** — Default: 0.3 | Range: 0.0-2.0
A buffer added beyond the order block boundary for stop-loss placement, designed to prevent wick stop-outs on volatile assets like BTC. At 0.3%, a $100,000 OB low places the stop-loss at $99,700.
**P/D Zone Threshold** — Default: 0.80 | Range: 0.50-0.85 | Selective Mode Only
Controls how deep into the premium or discount zone price must be for an entry to qualify. At 0.80, longs require price to be in the bottom 20% of the HTF range and shorts require the top 20%. At 0.50, the indicator uses standard equilibrium (above/below 50%). This parameter is ignored in Aggressive mode.
**Max FVGs per Side** — Default: 5 | Range: 1-10
Controls how many unfilled fair value gaps are displayed per direction (bullish and bearish independently). At 5, the chart shows up to 5 active bullish FVGs and 5 active bearish FVGs simultaneously. Lower values reduce visual clutter on smaller timeframes. Higher values provide more structural context on higher timeframes where gaps may persist longer. When the limit is reached, the oldest FVG is removed to make room for the newest one.
**FVG Max Distance %** — Default: 8.0 | Range: 1.0-25.0
FVGs whose midpoint is further than this percentage from the current price are automatically hidden. This keeps the chart focused on structurally relevant gaps — a gap at 85K is not actionable when price is at 97K. On higher timeframes or during high-volatility periods, increase this value to retain wider context. On lower timeframes or in tight ranges, decrease it to keep only the nearest gaps visible.
**Show Trade Boxes** — On / Off
Toggles the visual boxes that display entry, stop-loss, and take-profit levels for each signal. Green boxes indicate long positions. Red boxes indicate short positions.
## CONCEPTS EXPLAINED
For traders learning smart money concepts, here is a plain-language breakdown of every structural element this indicator uses.
**Order Blocks (OB)**
An order block is the last opposing candle before a significant impulsive move. In a bullish scenario, it is the last bearish candle before a strong rally. Institutional traders place large orders at these levels during accumulation or distribution phases, creating zones where price is statistically likely to react when it returns. Order blocks are the foundation of SMC entry models — they represent where smart money positioned itself.
**Fair Value Gap (FVG)**
A fair value gap is a three-candle price imbalance where a gap exists between candle 1's high (or low) and candle 3's low (or high). In a bullish FVG, candle 2 moved so aggressively that it left a gap between candle 1's high and candle 3's low. These gaps represent areas where price moved too fast for orders to fill completely. Markets tend to return to these inefficiencies to rebalance. When an FVG overlaps an order block, you have two independent structural signals pointing to the same zone — that is high-probability confluence.
**Break of Structure (BOS)**
A break of structure occurs when price moves beyond a prior swing high (bullish BOS) or swing low (bearish BOS) in the direction of the prevailing trend. It signals continuation — the trend is intact and expanding. This indicator uses BOS detection on both the higher timeframe and the confirmation timeframe to ensure structural alignment before entries.
**Change of Character (CHoCH)**
A change of character is a structural break against the prevailing trend, signaling a potential reversal. In a downtrend, a CHoCH occurs when price breaks above the most recent lower high. This is significant because it is the first objective signal that sellers may be losing control. The indicator treats CHoCH as a valid trigger alongside BOS, allowing entries on both trend continuations and early reversals.
**Liquidity Sweep**
A liquidity sweep occurs when price briefly pushes beyond a key structural level — a swing high or swing low — to trigger clustered stop-loss orders and pending orders, then reverses. This is a core ICT concept. Institutional participants need liquidity to fill large positions, and retail stop-losses provide that liquidity. The sweep-and-reverse pattern is one of the most reliable structural signals in price action analysis. This indicator requires a confirmed sweep before any entry signal fires.
**Premium and Discount Zones**
The premium/discount zone model divides the higher-timeframe dealing range into two halves using the 50% equilibrium level. The upper half is the premium zone — where price is expensive relative to the range, favoring short positions. The lower half is the discount zone — where price is cheap relative to the range, favoring long positions. The Selective mode narrows this further using the P/D Zone Threshold, requiring entries at the extremes of these zones for maximum positional advantage.
## HOW TO USE THIS INDICATOR
**Step 1 — Add to Chart**
Add the indicator to any BTCUSDT chart. The default settings are optimized for the 4H timeframe on Binance data, but the logic works on any Bitcoin pair and can be adapted to other timeframes by adjusting the Direction TF, Confirmation TF, and Swing Length parameters.
**Step 2 — Choose Your Mode**
Open Settings and select either Aggressive or Selective mode. Aggressive generates more signals and captures more of the trend. Selective generates fewer, higher-quality signals with tighter risk control. If you are still learning smart money concepts, Selective mode provides a cleaner read because every signal has maximum structural confluence.
**Step 3 — Read the Signals**
Entry arrows appear directly on the chart when all confluence conditions are met. Green arrows indicate long entries. Red arrows indicate short entries. Stop-loss and take-profit levels are plotted as horizontal lines extending from each signal.
**Step 4 — Enable Trade Boxes**
Turn on Show Trade Boxes in Settings for a clear visual representation of each trade's risk and reward. The box spans from entry to TP, with the SL level marked. This makes it easy to evaluate the risk-reward ratio of each signal at a glance.
**Step 5 — Run the Strategy Tester**
Open TradingView's Strategy Tester panel to verify the backtest results on your chart and data. Set commission and slippage to match your exchange's actual fees. The default commission of 0.075% per trade represents Binance taker fees. Adjust if you trade on a different exchange.
**Step 6 — Adjust Settings Carefully**
If you modify parameters, change one at a time and re-run the backtest after each change to understand the isolated impact. The default settings are the product of extensive testing — they are not arbitrary. Move away from them deliberately, not casually.
**Step 7 — Combine with Your Own Context**
This indicator provides structural signals based on smart money concepts. It does not account for fundamental catalysts, macroeconomic events, or on-chain data. Use these signals as one input within your broader analytical framework. The strongest results come from traders who combine structural signals with their own understanding of market context.
**Step 8 — Manage Risk**
No indicator guarantees profits. Size your positions according to your account size and risk tolerance. Never risk more than you can afford to lose on a single trade. The backtest results represent historical performance under specific conditions — live trading introduces variables that backtests cannot fully capture.
## BACKTEST CONDITIONS — FULL TRANSPARENCY
Every number published here is reproducible. Load the indicator with default settings on BTCUSDT 4H and open the Strategy Tester. Here are the exact conditions:
- Symbol: BTCUSDT (Binance)
- Timeframe: 4H
- Period: January 2023 through February 2026 (3+ years of data)
- Initial Capital: $10,000
- Order Size: 100% of equity per trade
- Commission: 0.075% per trade (Binance taker fee)
- Slippage: 3 ticks per order
- Non-repainting: barstate.isconfirmed enforced on all signal calculations
- No lookahead bias: lookahead = barmerge.lookahead_off on all request.security() calls
- No future leakage: entries execute on the bar after all conditions are confirmed
Sample sizes are moderate — 55 trades for Aggressive, 21 for Selective. The Selective mode's 21 trades in particular should be supplemented with forward-testing on live data to build stronger statistical confidence. Both modes are provided so you can evaluate the frequency-versus-quality tradeoff with full transparency.
Past performance under specific historical conditions does not guarantee future results. Markets evolve. Volatility regimes shift. The only honest way to evaluate any strategy is continuous forward-testing alongside historical backtesting.
## DISCLAIMER
This indicator is published for educational and informational purposes only. It is not financial advice, investment advice, or a recommendation to buy or sell any asset.
Trading Bitcoin and other financial instruments involves substantial risk of loss. Leverage, volatility, exchange downtime, liquidity gaps, and other real-world factors can significantly impact live performance versus backtested results.
You should carefully consider your financial objectives, level of experience, and risk appetite before trading. Never trade capital you cannot afford to lose. You are solely responsible for your own trading decisions and their outcomes.
The author makes no guarantees about the accuracy, completeness, or reliability of this indicator or its signals. Use it at your own risk.
---
**Suggested Tags:** `smartmoneyconcepts` `orderblocks` `fairvaluegap` `bitcoin` `ICT` `BOS` `liquidez` `bloques` `accionprecio`
---
## VERSION EN ESPANOL (Resumen)
Para la documentacion completa, consulta la seccion en ingles arriba. A continuacion, un resumen de los puntos clave.
---
### Que es SMC Pro BTC
Motor de smart money concepts multi-temporal construido exclusivamente para Bitcoin. Combina bloques de ordenes, fair value gaps, barridos de liquidez, rupturas de estructura y zonas premium/descuento en una sola estrategia verificada por backtest, sin repintado y de codigo abierto. Desarrollado por un ex-analista cuantitativo de un fondo sistematico en Estados Unidos — la misma mecanica de flujo de ordenes que usan los algoritmos institucionales, adaptada para traders retail en TradingView.
Todos los resultados son reproducibles con los ajustes por defecto. Sin parametros ocultos. Sin sobreajuste.
### Dos Modos de Estrategia
**Modo Agresivo** — Entradas en cualquier BOS/CHoCH valido confirmado por bloque de ordenes + FVG + barrido de liquidez. Mas operaciones, mayor exposicion a movimientos tendenciales.
| Metrica | Valor |
|---|---|
| Total de Trades | 55 |
| Win Rate | 49.09% |
| P&L Neto | +49.12% |
| Factor de Beneficio | 1.41 |
| Drawdown Maximo | 14.70% |
**Modo Selectivo** — Agrega filtro de zona premium/descuento. Longs solo en zona de descuento, shorts solo en zona premium. Menos operaciones, mayor calidad por senal.
| Metrica | Valor |
|---|---|
| Total de Trades | 21 |
| Win Rate | 61.90% |
| P&L Neto | +26.92% |
| Factor de Beneficio | 2.347 |
| Drawdown Maximo | 8.66% |
Ambos modos incluyen comisiones (0.075%) y slippage (3 ticks) en los resultados. No hay un modo objetivamente mejor — solo el que se ajusta a tu perfil de riesgo.
### Como Usar
- **Agrega el indicador** a cualquier chart BTCUSDT (optimizado para 4H, Binance). Selecciona modo Agresivo o Selectivo en Configuracion.
- **Lee las senales:** flechas verdes = largo, flechas rojas = corto. Activa Show Trade Boxes para ver entrada, SL y TP visualmente. Los FVGs activos se muestran como zonas en el chart — configura cuantos quieres ver y a que distancia maxima del precio con Max FVGs per Side y FVG Max Distance %.
- **Verifica con el Strategy Tester:** abre el panel de Strategy Tester de TradingView, ajusta comisiones y slippage a las tarifas de tu exchange, y confirma los resultados en tu propio chart.
- **Gestiona tu riesgo:** ningun indicador garantiza ganancias. Dimensiona posiciones segun tu cuenta y tolerancia al riesgo. Combina estas senales con tu propio analisis fundamental y de contexto de mercado.
### Condiciones del Backtest
BTCUSDT (Binance) | 4H | Enero 2023 - Febrero 2026 | Capital: $10,000 | 100% equity por trade | Comision: 0.075% | Slippage: 3 ticks | Sin repintado (barstate.isconfirmed) | Sin lookahead bias | Sin filtracion futura.
### Aviso Legal
Este indicador se publica con fines educativos e informativos unicamente. No constituye asesoria financiera ni recomendacion de compra o venta. Operar Bitcoin implica riesgo sustancial de perdida. Nunca operes con capital que no puedas permitirte perder. El rendimiento pasado no garantiza resultados futuros. Usalo bajo tu propio riesgo.
Strategi Pine Script®

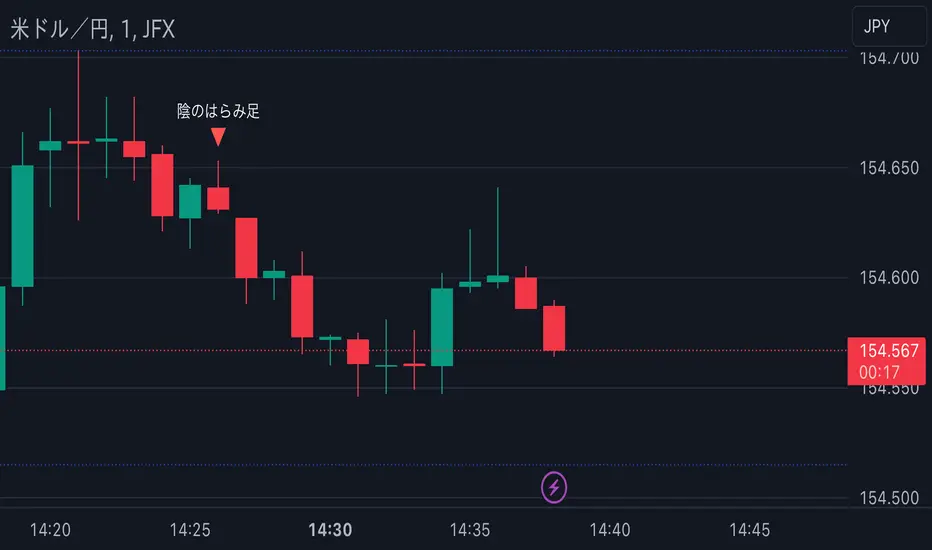
Candlestick Reversal SignalsTitle: Candlestick Reversal Signals
This Pine Script indicator is designed to identify and plot signals for two key candlestick reversal patterns: Bullish and Bearish Engulfing patterns, as well as Bullish and Bearish Harami patterns. These patterns are widely recognized for their ability to indicate potential trend reversals in the market, providing traders with valuable insights for making informed trading decisions.
Features:
• Bullish Engulfing Pattern:
• Conditions: This pattern is identified when the current candle’s close is higher than the previous candle’s open, and the current candle’s open is lower than the previous candle’s close. Additionally, the current candle’s close must be higher than the previous candle’s close, and the current candle’s open must be lower than the previous candle’s open.
• Signal: When a Bullish Engulfing pattern is detected, a green label is plotted below the relevant bar, indicating a potential upward reversal.
• Bearish Engulfing Pattern:
• Conditions: This pattern is identified when the current candle’s close is lower than the previous candle’s open, and the current candle’s open is higher than the previous candle’s close. Additionally, the current candle’s close must be lower than the previous candle’s close, and the current candle’s open must be higher than the previous candle’s open.
• Signal: When a Bearish Engulfing pattern is detected, a red label is plotted above the relevant bar, indicating a potential downward reversal.
• Bullish Harami Pattern:
• Conditions: This pattern is identified when the previous candle is a bearish candle (open higher than close), and the current candle is a bullish candle (close higher than open) that is contained within the body of the previous bearish candle.
• Signal: When a Bullish Harami pattern is detected, a green label is plotted below the relevant bar, indicating a potential upward reversal.
• Bearish Harami Pattern:
• Conditions: This pattern is identified when the previous candle is a bullish candle (open lower than close), and the current candle is a bearish candle (close lower than open) that is contained within the body of the previous bullish candle.
• Signal: When a Bearish Harami pattern is detected, a red label is plotted above the relevant bar, indicating a potential downward reversal.
Usage:
To use this script, simply add it to your TradingView chart. The script will automatically highlight the Bullish and Bearish Engulfing patterns, as well as Bullish and Bearish Harami patterns, by plotting green and red labels on the chart. These visual signals make it easy to spot potential reversal points, helping traders to identify and capitalize on trading opportunities.
Example:
• When you see a green “Bullish Engulfing” label below a candlestick, it suggests that the market might reverse upwards, signaling a potential buy opportunity.
• Conversely, a red “Bearish Engulfing” label above a candlestick suggests a potential downward reversal, signaling a potential sell opportunity.
• A green “Bullish Harami” label below a candlestick also indicates a potential upward reversal.
• A red “Bearish Harami” label above a candlestick indicates a potential downward reversal.
This indicator is a valuable addition to any trader’s technical analysis toolkit, providing clear and actionable signals based on well-established candlestick patterns. By incorporating these reversal patterns into your analysis, you can enhance your trading strategy and improve your decision-making process.
Penunjuk Pine Script®
Flags and Pennants [Trendoscope®]🎲 An extension to Chart Patterns based on Trend Line Pairs - Flags and Pennants
After exploring Algorithmic Identification and Classification of Chart Patterns and developing Auto Chart Patterns Indicator , we now delve into extensions of these patterns, focusing on Flag and Pennant Chart Patterns. These patterns evolve from basic trend line pair-based structures, often influenced by preceding market impulses.
🎲 Identification rules for the Extension Patterns
🎯 Identify the existence of Base Chart Patterns
Before identifying the flag and pennant patterns, we first need to identify the existence of following base trend line pair based converging or parallel patterns.
Ascending Channel
Descending Channel
Rising Wedge (Contracting)
Falling Wedge (Contracting)
Converging Triangle
Descending Triangle (Contracting)
Ascending Triangle (Contracting)
🎯 Identifying Extension Patterns.
The key to pinpointing these patterns lies in spotting a strong impulsive wave – akin to a flagpole – preceding a base pattern. This setup suggests potential for an extension pattern:
A Bullish Flag emerges from a positive impulse followed by a descending channel or a falling wedge
A Bearish Flag appears after a negative impulse leading to an ascending channel or a rising wedge.
A Bullish Pennant is indicated by a positive thrust preceding a converging triangle or ascending triangle.
A Bearish Pennant follows a negative impulse and a converging or descending triangle.
🎲 Pattern Classifications and Characteristics
🎯 Bullish Flag Pattern
Characteristics of Bullish Flag Pattern are as follows
Starts with a positive impulse wave
Immediately followed by either a short descending channel or a falling wedge
Here is an example of Bullish Flag Pattern
🎯 Bearish Flag Pattern
Characteristics of Bearish Flag Pattern are as follows
Starts with a negative impulse wave
Immediately followed by either a short ascending channel or a rising wedge
Here is an example of Bearish Flag Pattern
🎯 Bullish Pennant Pattern
Characteristics of Bullish Pennant Pattern are as follows
Starts with a positive impulse wave
Immediately followed by either a converging triangle or ascending triangle pattern.
Here is an example of Bullish Pennant Pattern
🎯 Bearish Pennant Pattern
Characteristics of Bearish Pennant Pattern are as follows
Starts with a negative impulse wave
Immediately followed by either a converging triangle or a descending converging triangle pattern.
Here is an example of Bearish Pennant Pattern
🎲 Trading Extension Patterns
In a strong market trend, it's common to see temporary periods of consolidation, forming patterns that either converge or range, often counter to the ongoing trend direction. Such pauses may lay the groundwork for the continuation of the trend post-breakout. The assumption that the trend will resume shapes the underlying bias of Flag and Pennant patterns
It's important, however, not to base decisions solely on past trends. Conducting personal back testing is crucial to ascertain the most effective entry and exit strategies for these patterns. Remember, the behavior of these patterns can vary significantly with the volatility of the asset and the specific timeframe being analyzed.
Approach the interpretation of these patterns with prudence, considering that market dynamics are subject to a wide array of influencing factors that might deviate from expected outcomes. For investors and traders, it's essential to engage in thorough back testing, establishing entry points, stop-loss orders, and target goals that align with your individual trading style and risk appetite. This step is key to assessing the viability of these patterns in line with your personal trading strategies and goals.
It's fairly common to witness a breakout followed by a swift price reversal after these patterns have formed. Additionally, there's room for innovation in trading by going against the bias if the breakout occurs in the opposite direction, specially when the trend before the formation of the pattern is in against the pattern bias.
🎲 Cheat Sheet
🎲 Indicator Settings
Custom Source : Enables users to set custom OHLC - this means, the indicator can also be applied on oscillators and other indicators having OHLC values.
Zigzag Settings : Allows users to enable different zigzag base and set length and depth for each zigzag.
Scanning Settings : Pattern scanning settings set some parameters that define the pattern recognition process.
Display Settings : Determine the display of indicators including colors, lines, labels etc.
Backtest Settings : Allows users to set a predetermined back test bars so that the indicator will not time out while trying to run for all available bars.
Penunjuk Pine Script®

eHarmonicpatternsExtendedLibrary "eHarmonicpatternsExtended"
Library provides an alternative method to scan harmonic patterns. This is helpful in reducing iterations. Republishing as new library instead of existing eHarmonicpatterns because I need that copy for existing scripts.
scan_xab(bcdRatio, err_min, err_max, patternArray) Checks if bcd ratio is in range of any harmonic pattern
Parameters:
bcdRatio : AB/XA ratio
err_min : minimum error threshold
err_max : maximum error threshold
patternArray : Array containing pattern check flags. Checks are made only if flags are true. Upon check flgs are overwritten.
scan_abc_axc(abcRatio, axcRatio, err_min, err_max, patternArray) Checks if abc or axc ratio is in range of any harmonic pattern
Parameters:
abcRatio : BC/AB ratio
axcRatio : XC/AX ratio
err_min : minimum error threshold
err_max : maximum error threshold
patternArray : Array containing pattern check flags. Checks are made only if flags are true. Upon check flgs are overwritten.
scan_bcd(bcdRatio, err_min, err_max, patternArray) Checks if bcd ratio is in range of any harmonic pattern
Parameters:
bcdRatio : CD/BC ratio
err_min : minimum error threshold
err_max : maximum error threshold
patternArray : Array containing pattern check flags. Checks are made only if flags are true. Upon check flgs are overwritten.
scan_xad_xcd(xadRatio, xcdRatio, err_min, err_max, patternArray) Checks if xad or xcd ratio is in range of any harmonic pattern
Parameters:
xadRatio : AD/XA ratio
xcdRatio : CD/XC ratio
err_min : minimum error threshold
err_max : maximum error threshold
patternArray : Array containing pattern check flags. Checks are made only if flags are true. Upon check flgs are overwritten.
isHarmonicPattern(x, a, b, c, d, flags, errorPercent) Checks for harmonic patterns
Parameters:
x : X coordinate value
a : A coordinate value
b : B coordinate value
c : C coordinate value
d : D coordinate value
flags : flags to check patterns. Send empty array to enable all
errorPercent : Error threshold
Returns: Array of boolean values which says whether valid pattern exist and array of corresponding pattern names
isHarmonicProjection(x, a, b, c, flags, errorPercent) Checks for harmonic pattern projection
Parameters:
x : X coordinate value
a : A coordinate value
b : B coordinate value
c : C coordinate value
flags : flags to check patterns. Send empty array to enable all
errorPercent : Error threshold
Returns: Array of boolean values which says whether valid pattern exist and array of corresponding pattern names.
get_prz_range(x, a, b, c, patternArray, errorPercent, start_adj, end_adj) Provides PRZ range based on BCD and XAD ranges
Parameters:
x : X coordinate value
a : A coordinate value
b : B coordinate value
c : C coordinate value
patternArray : Pattern flags for which PRZ range needs to be calculated
errorPercent : Error threshold
start_adj : - Adjustments for entry levels
end_adj : - Adjustments for stop levels
Returns: Start and end of consolidated PRZ range
get_prz_range_xad(x, a, b, c, patternArray, errorPercent, start_adj, end_adj) Provides PRZ range based on XAD range only
Parameters:
x : X coordinate value
a : A coordinate value
b : B coordinate value
c : C coordinate value
patternArray : Pattern flags for which PRZ range needs to be calculated
errorPercent : Error threshold
start_adj : - Adjustments for entry levels
end_adj : - Adjustments for stop levels
Returns: Start and end of consolidated PRZ range
Perpustakaan Pine Script®
4H HOD/LOD Checkpoint Analysis4H HOD/LOD Checkpoint Analysis - Detailed User Guide
OVERVIEW
This indicator is a data-driven probability framework for NQ Futures traders that predicts High-of-Day (HOD) and Low-of-Day (LOD) placement based on statistical analysis of 3,136+ trading days (2013-2025). Unlike traditional indicators that rely on technical signals, this tool uses checkpoint-based state analysis with zero forward-looking bias to provide real-time probabilities of whether the daily range is complete.
⚠️ IMPORTANT: This indicator is specifically designed for NQ FUTURES ONLY. All probabilities, patterns, and statistics were derived from a 10+ year historical dataset of NQ 1-minute bars. Using this on other instruments will produce inaccurate results.
CORE CONCEPT: CHECKPOINT METHODOLOGY
What is a Checkpoint?
A checkpoint occurs when a 4-hour candle closes. At this moment, the indicator "locks" the current market state and calculates probabilities for the remainder of the trading day. The key innovation is that state never changes after locking - probabilities remain constant throughout the session until the next checkpoint.
The Six 4-Hour Candles (EST):
6PM (18:00-22:00) - Evening/Globex open
10PM (22:00-02:00) - Asia session
2AM (02:00-06:00) - Early London
6AM (06:00-10:00) - Late London + NY Open
10AM (10:00-14:00) - NY Morning
2PM (14:00-17:00) - NY Afternoon (3 hours only)
Five Checkpoints:
10PM Checkpoint - After 6PM closes
2AM Checkpoint - After 10PM closes
6AM Checkpoint - After 2AM closes
10AM Checkpoint - After 6AM closes (most critical)
2PM Checkpoint - After 10AM closes (highest conviction fade signals)
HOW IT WORKS: THE THREE-FACTOR STATE SYSTEM
At each checkpoint, the indicator evaluates three critical factors to determine probability:
1. ELIMINATIONS (Quantity)
An "elimination" occurs when a candle trades beyond a previous candle's high or low, effectively removing that candle from contention for HOD/LOD.
Example at 10AM Checkpoint:
6PM high = 18,000
10PM high = 18,050 (eliminates 6PM high)
2AM high = 18,100 (eliminates 10PM high)
6AM high = 18,075 (does NOT eliminate 2AM high)
Result: 2 eliminations
The number of eliminations indicates trend strength:
0 eliminations = Range-bound, high probability extremes already set
1-2 eliminations = Moderate trend
3-4 eliminations = Strong trend day, range likely to extend
2. STRUCTURE (Pattern Type)
The indicator distinguishes between two elimination patterns:
Sequential: Eliminations occur in order (6pm → 10pm → 2am → 6am → 10am)
Indicates smooth, consistent trend
Example: 10pm eliminates 6pm, then 2am eliminates 10pm (sequential)
Skip: Eliminations skip candles
Indicates choppy/reversal behavior
Example: 2am eliminates 6pm but NOT 10pm (skip pattern)
Why it matters: Skip patterns show 2X probability differences compared to sequential patterns. At 10AM checkpoint with 2 eliminations, skip pattern shows 64% participation rate vs 36% for sequential pattern with previous survived.
3. PREVIOUS CANDLE STATUS
Did the immediately prior candle get eliminated?
Eliminated: Previous candle's high/low was taken out
Indicates relentless trend
Higher probability of continuation
Survived: Previous candle's high/low still intact
Indicates trend pause
Higher probability of mean reversion or range completion
Critical insight: High and low are tracked separately. At 2AM checkpoint, 10PM might have eliminated 6PM high (relentless uptrend) but NOT eliminated 6PM low (low survived). This creates different probabilities for HOD vs LOD.
VISUAL ELEMENTS
4-Hour Candle Boxes
Each 4H candle is displayed as a colored box showing its range:
Gray = 6PM (evening)
Blue = 10PM (Asia)
Purple = 2AM (early London)
Orange = 6AM (London + NY Open) - THE CURVE SESSION
Teal = 10AM (NY morning) - THE MONEY SESSION
Red = 2PM (NY afternoon) - THE FADE SESSION
HOD/LOD Lines
Black horizontal lines extend from current HOD/LOD with labels showing:
Which candle set the extreme
Current price level
THE CHECKPOINT TABLE EXPLAINED
Table Header:
Shows current checkpoint (e.g., "🎯 10AM CHECKPOINT") or "⏳ PRE-CHECKPOINT" if between checkpoints.
Main Metrics (Side-by-Side Comparison):
The table displays HOD and LOD separately in two columns because they can have different patterns:
METRIC
HODLOD Eliminations
Number of candles eliminated so far for highs
Number of candles eliminated so far for lows
Structure
Sequential or Skip pattern for highs
Sequential or Skip pattern for lows
Prev Candle
Was previous candle's high eliminated or did it survive?
Was previous candle's low eliminated or did it survive?
Pattern
Combined interpretation: Relentless/Paused/Skip/Early
Combined interpretation: Relentless/Paused/Skip/Early
Color Coding:
Structure Row:
White = Sequential (smooth trend)
Orange = Skip (choppy/reversal)
Previous Candle Row:
Red = Eliminated (relentless trend continuing)
Blue = Survived (trend paused)
Pattern Row:
Red = Relentless (previous eliminated + sequential = strong trend)
Blue = Paused (previous survived + sequential = trend pause)
Orange = Skip/Chop (skip pattern = reversal likely)
Gray = Early (0-1 eliminations, too early to tell)
Probability Section:
Prob Already In: Percentage chance that HOD/LOD has already been set
Color coding:
Green (>75%) = High confidence extreme is in, FADE
Yellow (45-75%) = Moderate confidence
Red (<45%) = Low confidence extreme is in, CONTINUATION likely
Sample Size: Shows how many historical occurrences match this exact state (n=XXX)
Larger samples = higher confidence
Most common states have n=500-2,000+
Current: Which candle currently holds HOD/LOD
Pattern Guide Section:
Appears when you have 2+ eliminations. Provides interpretation:
📈 Paused: Trend has paused, 2pm more likely to set extreme
📈 Relentless: Breaking higher/lower, continuation expected
📈 Skip/Chop: Choppy pattern, next session likely
Same for lows with 📉 symbol.
PRACTICAL TRADING EXAMPLES
Example 1: High Conviction Fade Setup
State at 10AM Checkpoint:
Eliminations: 0 (both HOD/LOD)
Structure: None (no eliminations yet)
Prev Candle: Survived
Table shows:
HOD Prob Already In: 68.9% (n=582)
LOD Prob Already In: 73.6% (n=785)
Interpretation: Range is likely complete. Fade extremes. With 0 eliminations and 70%+ probability, this is a high-conviction mean reversion signal.
Example 2: Strong Continuation Signal
State at 10AM Checkpoint:
Eliminations: 3 (both HOD/LOD)
Structure: Sequential
Prev Candle: Eliminated (relentless)
Table shows:
HOD Prob Already In: 29.8% (n=1,758)
LOD Prob Already In: 34.6% (n=1,451)
Pattern: 📈 Relentless / 📉 Relentless
Interpretation: Strong trend day. Only 30-35% chance range is complete. Look for breakouts in direction of trend. 10AM and 2PM likely to extend range.
Example 3: Pattern Structure Edge
State at 10AM Checkpoint:
Eliminations: 2 (HOD)
Structure: Skip (orange background)
Prev Candle: Eliminated vs Alternative State:
Eliminations: 2 (HOD)
Structure: Sequential
Prev Candle: Survived
Result: Skip pattern shows 64% chance 10AM participates vs 36% for sequential+survived. Skip pattern = 2X more likely to see 10AM high. This structural edge is unique to this indicator.
Example 4: Different HOD vs LOD Patterns
State at 10AM Checkpoint:
HOD: 2 eliminations, Sequential, Previous Eliminated (Relentless) = 46.7% in
LOD: 2 eliminations, Skip, Previous Eliminated (Choppy) = 48.4% in
Interpretation: Highs show relentless uptrend but lows show choppy behavior. This divergence suggests potential for upside continuation but with volatility. Not a clean trend day.
KEY CHECKPOINT STATISTICS (DERIVED FROM 10-YEAR DATASET)
10PM Checkpoint (After 6PM):
Very early in day
13.5% HOD in, 21.3% LOD in
Most likely outcome: Range extends into 6AM/10AM
2AM Checkpoint (After 10PM):
Still early
With 0 elims: 22-31% in (balanced)
With 1 elim: 8-12% in (strong trend signal)
6AM Checkpoint (After 2AM) - Critical Decision Point:
With 0 elims: 40-47% in (balanced, could go either way)
With 2 elims: 18-22% in (strong trend into 6AM/10AM)
Most likely outcome: 10AM sets extremes (~38-40%)
10AM Checkpoint (After 6AM) - Highest Conviction:
With 0 elims: 69-74% in → FADE (high confidence)
With 3 elims: 30-35% in → BUY/SELL continuation
This is THE money checkpoint for high-probability setups
2PM Checkpoint (After 10AM) - Maximum Fade Conviction:
With 0-3 elims: 67-95% in → FADE strongly
With 4 elims: 49-61% in (monster trend, weaker fade)
2PM is primarily a mean reversion session
UNDERSTANDING THE UNDERLYING DATA
All probabilities are derived from analysis of:
Instrument: NQ Futures (E-mini NASDAQ-100)
Timeframe: 1-minute bars
Period: January 2013 - December 2025
Sample: 3,136+ complete trading days
Methodology: Real-time checkpoint analysis with zero forward-looking bias
Why NQ-Specific?
Each futures contract has unique:
Session characteristics (6AM in NQ shows 60-64% curve behavior, other sessions differ)
Timing patterns (NQ's 10AM session has 67-74% immediate takeouts)
Volatility profiles (NQ 2PM shows 56% bullish bias vs ES shows different bias)
Using this indicator on ES, RTY, or other instruments will produce inaccurate results because the probability tables are NQ-specific.
ORIGINALITY & INNOVATION
What Makes This Indicator Unique:
Zero Forward-Looking Bias: State locks at checkpoint moments. Traditional indicators recalculate continuously, introducing bias. This indicator freezes probabilities at the exact moment a 4H candle closes.
Three-Factor State System: Combines elimination count, structure pattern, and previous candle status. Most indicators only track one dimension. This multi-factor approach provides 2X+ probability differentials.
Separate HOD/LOD Tracking: Highs and lows can have different patterns simultaneously (relentless high with choppy low). This indicator tracks them separately for precision.
Pattern Structure Analysis: Distinguishes between sequential and skip patterns, a concept not found in standard indicators. Skip patterns show mean reversion while sequential shows continuation.
10+ Year Statistical Foundation: Every probability is backed by hundreds to thousands of historical occurrences (sample sizes shown in table). Not based on theories or assumptions.
Checkpoint-Specific Probabilities: Different checkpoints have different probability profiles. 10AM checkpoint with 0 eliminations = 70%+ fade. 6AM checkpoint with same state = 40%+ fade. Context matters.
HOW TO USE THIS INDICATOR
Step 1: Wait for Checkpoint
The table will show "⏳ PRE-CHECKPOINT" until a 4H candle closes. Probabilities are only valid at checkpoint moments.
Step 2: Read the State
Check the three factors:
How many eliminations?
Sequential or skip?
Previous candle eliminated or survived?
Step 3: Check Probability
Look at "Prob Already In" percentage:
>75% (Green) = High confidence extreme is set, fade
45-75% (Yellow) = Moderate confidence, use other confirmation
<45% (Red) = Low confidence extreme is set, continuation likely
Step 4: Check Sample Size
Larger sample (n=1,000+) = higher confidence
Smaller sample (n=50-200) = use caution, edge is real but less robust
Step 5: Consider Pattern
Read the pattern guide:
Relentless = trend continuing
Paused = trend stalled, mean reversion
Skip/Chop = reversal/range likely
Step 6: Compare HOD vs LOD
If both show similar patterns = cleaner signal
If divergent patterns = complex day, be cautious
BEST PRACTICES
Focus on 10AM and 2PM checkpoints - These have the highest conviction signals
Combine with price action - Don't fade blindly at 90% probability if price is breaking out strongly
Larger samples = better edges - Prioritize setups with n=500+
Watch for pattern divergence - When HOD and LOD show different patterns, expect complexity
Remember session characteristics:
6AM = THE CURVE SESSION (60-64% mean reversion when Q2 breaks Q1)
10AM = THE MONEY SESSION (67-74% immediate takeouts, highest conviction)
2PM = THE FADE SESSION (67-95% extremes already in)
SETTINGS
Show 4H Candle Boxes - Display colored boxes for each 4H candle
Show HOD/LOD Lines - Display horizontal lines at current extremes
Show Checkpoint Analysis - Display probability table
Table Position - Choose where to place the checkpoint table
Table Size - Tiny/Small/Normal
Colors - Customize box colors for each session
LIMITATIONS & DISCLAIMERS
NQ FUTURES ONLY - Do not use on other instruments
Not a standalone system - Use as confluence with your strategy
Historical data - Past performance doesn't guarantee future results
Sample size variance - Some states have smaller samples, use judgment
Requires understanding - Read this guide fully before trading with this tool
FINAL NOTES
This indicator represents 10+ years of NQ futures data distilled into actionable, real-time probabilities. The checkpoint methodology ensures zero forward-looking bias, while the three-factor state system provides granular edge that traditional indicators miss.
Remember: This tool provides probabilities, not certainties. Trade with proper risk management, and use this as one input in your decision-making process.
Penunjuk Pine Script®

EngulfScanEngulf Scan
Introduction:
The Engulf Scan indicator helps users identify bullish and bearish engulfing candlestick patterns on their charts. These patterns are often used as signals for trend reversals and are important indicators for traders. Engulf Scan signals are generated when an engulfing pattern is swallowed by another candlestick of the opposite color.The signal of a candle engulfment formation is generated when the 1st candle is engulfed by the 2nd candle and the 2nd candle is engulfed by the 3rd candle.
Features:
Bullish Engulfing Pattern: Indicates the start of an upward trend and typically signals that the market is likely to move higher.
Bearish Engulfing Pattern: Indicates the start of a downward trend and typically signals that the market is likely to move lower.
Color Coding: Users can customize the background colors for bullish and bearish engulfing patterns.
Usage Guide:
Adding the Indicator: Add the "Engulf Scan" indicator to your TradingView chart.
Color Settings: Choose your preferred colors for bullish and bearish engulfing patterns from the indicator settings.
Pattern Detection: View the engulfing patterns on the chart with the specified colors and symbols. These patterns help identify potential trend reversal points.
Parameters and Settings:
Bullish Engulfing Color: Background color for the bullish engulfing pattern.( Green)
Bearish Engulfing Color: Background color for the bearish engulfing pattern. (Red)
Examples:
Bullish Engulfing Example: On the chart below, you can see bullish engulfing patterns highlighted with a green background. (Green)
Bearish Engulfing Example: On the chart below, you can see bearish engulfing patterns highlighted with a red background. (Red)
Frequently Asked Questions (FAQ):
How are engulfing patterns detected?
Engulfing patterns are formed when a candlestick completely engulfs the previous candlestick. For a bullish engulfing pattern, a bullish candlestick follows a bearish one. For a bearish engulfing pattern, a bearish candlestick follows a bullish one.
Which timeframes work best with this indicator?
Engulfing patterns are generally more reliable on daily and higher timeframes, but you can test the indicator on different timeframes to see if it fits your trading strategy.
Can I detect a reversal or trend?
As can be seen in the image, it sometimes appears as a return signal and sometimes as a harbinger of an ongoing trend.But it may be a mistake to use the indicator only for these purposes. However, this indicator may not be sufficient when used alone. It can be combined with different indicators from the Tradingview library.
Updates and Changelog:
v1.0: Initial release. Added detection and color coding for bullish and bearish engulfing patterns.
-Please feel free to write your valuable comments and opinions. I attach importance to your valuable opinions so that I can improve myself.
Penunjuk Pine Script®

Elliott Wave with Supertrend Exit - Strategy [presentTrading]## Introduction and How it is Different
The Elliott Wave with Supertrend Exit provides automated detection and validation of Elliott Wave patterns for algorithmic trading. It is designed to objectively identify high-probability wave formations and signal entries based on confirmed impulsive and corrective patterns.
* The Elliott part is mostly referenced from Elliott Wave by @LuxAlgo
Key advantages compared to discretionary Elliott Wave analysis:
- Wave Labeling and Counting: The strategy programmatically identifies swing pivot highs/lows with the Zigzag indicator and analyzes the waves between them. It labels the potential impulsive and corrective patterns as they form. This removes the subjectivity of manual wave counting.
- Pattern Validation: A rules-based engine confirms valid impulsive and corrective patterns by checking relative size relationships and fib ratios. Only confirmed wave counts are plotted and traded.
- Objective Entry Signals: Trades are entered systematically on the start of new impulsive waves in the direction of the trend. Pattern failures invalidate setups and stop out positions.
- Automated Trade Management: The strategy defines specific rules for profit targets at fib extensions, trailing stops at swing points, and exits on Supertrend reversals. This automates the entire trade lifecycle.
- Adaptability: The waveform recognition engine can be tuned by adjusting parameters like Zigzag depth and Supertrend settings. It adapts to evolving market conditions.
ETH 1hr chart
In summary, the strategy brings automation, objectivity and adaptability to Elliott Wave trading - removing subjective interpretation errors and emotional trading biases. It implements a rules-based, algorithmic approach for systematically trading Elliott Wave patterns across markets and timeframes.
## Trading Logic and Rules
The strategy follows specific trading rules based on the detected and validated Elliott Wave patterns.
Entry Rules
- Long entry when a new impulsive bullish (5-wave) pattern forms
- Short entry when a new impulsive bearish (5-wave) pattern forms
The key is entering on the start of a new potential trend wave rather than chasing.
Exit Rules
- Invalidation of wave pattern stops out the trade
- Close long trades on Supertrend downturn
- Close short trades on Supertrend upturn
- Use a stop loss of 10% of entry price (configurable)
Trade Management
- Scale out partial profits at Fibonacci levels
- Move stop to breakeven when price reaches 1.618 extension
- Trail stops below key swing points
- Target exits at next Fibonacci projection level
Risk Management
- Use stop losses on all trades
- Trade only highest probability setups
- Size positions according to chart timeframe
- Avoid overtrading when no clear patterns emerge
## Strategy - How it Works
The core logic follows these steps:
1. Find swing highs/lows with Zigzag indicator
2. Analyze pivot points to detect impulsive 5-wave patterns:
- Waves 1, 3, and 5 should not overlap
- Waves 3 and 5 must be longer than wave 1
- Confirm relative size relationships between waves
3. Validate corrective 3-wave patterns:
- Look for overlapping, choppy waves that retrace the prior impulsive wave
4. Plot validated waves and Fibonacci retracement levels
5. Signal entries when a new impulsive wave pattern forms
6. Manage exits based on pattern failures and Supertrend reversals
Impulsive Wave Validation
The strategy checks relative size relationships to confirm valid impulsive waves.
For uptrends, it ensures:
```
Copy code- Wave 3 is longer than wave 1
- Wave 5 is longer than wave 2
- Waves do not overlap
```
Corrective Wave Validation
The strategy identifies overlapping corrective patterns that retrace the prior impulsive wave within Fibonacci levels.
Pattern Failure Invalidation
If waves fail validation tests, the strategy invalidates the pattern and stops signaling trades.
## Trade Direction
The strategy detects impulsive and corrective patterns in both uptrends and downtrends. Entries are signaled in the direction of the validated wave pattern.
## Usage
- Use on charts showing clear Elliott Wave patterns
- Start with daily or weekly timeframes to gauge overall trend
- Optimize Zigzag and Supertrend settings as needed
- Consider combining with other indicators for confirmation
## Default Settings
- Zigzag Length: 4 bars
- Supertrend Length: 10 bars
- Supertrend Multiplier: 3
- Stop Loss: 10% of entry price
- Trading Direction: Both
Strategi Pine Script®

eHarmonicpatternsLogScaleLibrary "eHarmonicpatternsLogScale"
Library provides functions to scan harmonic patterns both or normal and log scale
getSupportedPatterns()
get_prz_range(x, a, b, c, patternArray, errorPercent, start_adj, end_adj, logScale)
Provides PRZ range based on BCD and XAD ranges
Parameters:
x : X coordinate value
a : A coordinate value
b : B coordinate value
c : C coordinate value
patternArray : Pattern flags for which PRZ range needs to be calculated
errorPercent : Error threshold
start_adj : - Adjustments for entry levels
end_adj : - Adjustments for stop levels
logScale : - calculate on log scale. Default is false
Returns: Start and end of consolidated PRZ range
get_prz_range_xad(x, a, b, c, patternArray, errorPercent, start_adj, end_adj, logScale)
Provides PRZ range based on XAD range only
Parameters:
x : X coordinate value
a : A coordinate value
b : B coordinate value
c : C coordinate value
patternArray : Pattern flags for which PRZ range needs to be calculated
errorPercent : Error threshold
start_adj : - Adjustments for entry levels
end_adj : - Adjustments for stop levels
logScale : - calculate on log scale. Default is false
Returns: Start and end of consolidated PRZ range
get_projection_range(x, a, b, c, patternArray, errorPercent, start_adj, end_adj, logScale)
Provides Projection range based on BCD and XAD ranges
Parameters:
x : X coordinate value
a : A coordinate value
b : B coordinate value
c : C coordinate value
patternArray : Pattern flags for which PRZ range needs to be calculated
errorPercent : Error threshold
start_adj : - Adjustments for entry levels
end_adj : - Adjustments for stop levels
logScale : - calculate on log scale. Default is false
Returns: Array containing start and end ranges
isHarmonicPattern(x, a, b, c, d, flags, defaultEnabled, errorPercent, logScale)
Checks for harmonic patterns
Parameters:
x : X coordinate value
a : A coordinate value
b : B coordinate value
c : C coordinate value
d : D coordinate value
flags : flags to check patterns. Send empty array to enable all
defaultEnabled
errorPercent : Error threshold
logScale : - calculate on log scale. Default is false
Returns: Array of boolean values which says whether valid pattern exist and array of corresponding pattern names
isHarmonicProjection(x, a, b, c, flags, defaultEnabled, errorPercent, logScale)
Checks for harmonic pattern projection
Parameters:
x : X coordinate value
a : A coordinate value
b : B coordinate value
c : C coordinate value
flags : flags to check patterns. Send empty array to enable all
defaultEnabled
errorPercent : Error threshold
logScale : - calculate on log scale. Default is false
Returns: Array of boolean values which says whether valid pattern exist and array of corresponding pattern names.
Perpustakaan Pine Script®

eHarmonicpatternsLibrary "eHarmonicpatterns"
Library provides an alternative method to scan harmonic patterns. This is helpful in reducing iterations
scan_xab(bcdRatio, err_min, err_max, patternArray) Checks if bcd ratio is in range of any harmonic pattern
Parameters:
bcdRatio : AB/XA ratio
err_min : minimum error threshold
err_max : maximum error threshold
patternArray : Array containing pattern check flags. Checks are made only if flags are true. Upon check flgs are overwritten.
scan_abc_axc(abcRatio, axcRatio, err_min, err_max, patternArray) Checks if abc or axc ratio is in range of any harmonic pattern
Parameters:
abcRatio : BC/AB ratio
axcRatio : XC/AX ratio
err_min : minimum error threshold
err_max : maximum error threshold
patternArray : Array containing pattern check flags. Checks are made only if flags are true. Upon check flgs are overwritten.
scan_bcd(bcdRatio, err_min, err_max, patternArray) Checks if bcd ratio is in range of any harmonic pattern
Parameters:
bcdRatio : CD/BC ratio
err_min : minimum error threshold
err_max : maximum error threshold
patternArray : Array containing pattern check flags. Checks are made only if flags are true. Upon check flgs are overwritten.
scan_xad_xcd(xadRatio, xcdRatio, err_min, err_max, patternArray) Checks if xad or xcd ratio is in range of any harmonic pattern
Parameters:
xadRatio : AD/XA ratio
xcdRatio : CD/XC ratio
err_min : minimum error threshold
err_max : maximum error threshold
patternArray : Array containing pattern check flags. Checks are made only if flags are true. Upon check flgs are overwritten.
isHarmonicPattern(x, a, c, c, d, flags, errorPercent) Checks for harmonic patterns
Parameters:
x : X coordinate value
a : A coordinate value
c : B coordinate value
c : C coordinate value
d : D coordinate value
flags : flags to check patterns. Send empty array to enable all
errorPercent : Error threshold
Returns: Array of boolean values which says whether valid pattern exist and array of corresponding pattern names
isHarmonicProjection(x, a, c, c, flags, errorPercent) Checks for harmonic pattern projection
Parameters:
x : X coordinate value
a : A coordinate value
c : B coordinate value
c : C coordinate value
flags : flags to check patterns. Send empty array to enable all
errorPercent : Error threshold
Returns: Array of boolean values which says whether valid pattern exist and array of corresponding pattern names
Perpustakaan Pine Script®

Reverse Cutlers Relative Strength Index On ChartIntroduction
The Reverse Cutlers Relative Strength Index (RCRSI) OC is an indicator which tells the user what price is required to give a particular Cutlers Relative Strength Index ( RSI ) value, or cross its Moving Average (MA) signal line.
Overview
Background & Credits:
The relative strength index ( RSI ) is a momentum indicator used in technical analysis that was originally developed by J. Welles Wilder Jr. and introduced in his seminal 1978 book, “New Concepts in Technical Trading Systems.”.
Cutler created a variation of the RSI known as “Cutlers RSI” using a different formulation to avoid an inherent accuracy problem which arises when using Wilders method of smoothing.
Further developments in the use, and more nuanced interpretations of the RSI have been developed by Cardwell, and also by well-known chartered market technician, Constance Brown C.M.T., in her acclaimed book "Technical Analysis for the Trading Professional” 1999 where she described the idea of bull and bear market ranges for RSI , and while she did not actually reveal the formulas, she introduced the concept of “reverse engineering” the RSI to give price level outputs.
Renowned financial software developer, co-author of academic books on finance, and scientific fellow to the Department of Finance and Insurance at the Technological Educational Institute of Crete, Giorgos Siligardos PHD . brought a new perspective to Wilder’s RSI when he published his excellent and well-received articles "Reverse Engineering RSI " and "Reverse Engineering RSI II " in the June 2003, and August 2003 issues of Stocks & Commodities magazine, where he described his methods of reverse engineering Wilders RSI .
Several excellent Implementations of the Reverse Wilders Relative Strength Index have been published here on Tradingview and elsewhere.
My utmost respect, and all due credits to authors of related prior works.
Introduction
It is worth noting that while the general RSI formula, and the logic dictating the UpMove and DownMove data series has remained the same as the Wilders original formulation, it has been interpreted in a different way by using a different method of averaging the upward, and downward moves.
Cutler recognized the issue of data length dependency when using wilders smoothing method of calculating RSI which means that wilders standard RSI will have a potential initialization error which reduces with every new data point calculated meaning early results should be regarded as unreliable until enough calculation iterations have occurred for convergence.
Hence Cutler proposed using Simple Moving Averaging for gain and loss data which this Indicator is based on.
Having "Reverse engineered" prices for any oscillator makes the planning, and execution of strategies around that oscillator far simpler, more timely and effective.
Introducing the Reverse Cutlers RSI which consists of plotted lines on a scale of 0 to 100, and an optional infobox.
The RSI scale is divided into zones:
• Scale high (100)
• Bull critical zone (80 - 100)
• Bull control zone (62 - 80)
• Scale midline (50)
• Bear control zone (20 - 38)
• Bear critical zone (0 - 20)
• Scale low (0)
The RSI plots which graphically display output closing price levels where Cutlers RSI value will crossover:
• RSI (eq) (previous RSI value)
• RSI MA signal line
• RSI Test price
• Alert level high
• Alert level low
The info box displays output closing price levels where Cutlers RSI value will crossover:
• Its previous value. ( RSI )
• Bull critical zone.
• Bull control zone.
• Mid-Line.
• Bear control zone.
• Bear critical zone.
• RSI MA signal line
• Alert level High
• Alert level low
And also displays the resultant RSI for a user defined closing price:
• Test price RSI
The infobox outputs can be shown for the current bar close, or the next bar close.
The user can easily select which information they want in the infobox from the setttings
Importantly:
All info box price levels for the current bar are calculated immediately upon the current bar closing and a new bar opening, they will not change until the current bar closes.
All info box price levels for the next bar are projections which are continually recalculated as the current price changes, and therefore fluctuate as the current price changes.
Understanding the Relative Strength Index
At its simplest the RSI is a measure of how quickly traders are bidding the price of an asset up or down.
It does this by calculating the difference in magnitude of price gains and losses over a specific lookback period to evaluate market conditions.
The RSI is displayed as an oscillator (a line graph that can move between two extremes) and outputs a value limited between 0 and 100.
It is typically accompanied by a moving average signal line.
Traditional interpretations
Overbought and oversold:
An RSI value of 70 or above indicates that an asset is becoming overbought (overvalued condition), and may be may be ready for a trend reversal or corrective pullback in price.
An RSI value of 30 or below indicates that an asset is becoming oversold (undervalued condition), and may be may be primed for a trend reversal or corrective pullback in price.
Midline Crossovers:
When the RSI crosses above its midline ( RSI > 50%) a bullish bias signal is generated. (only take long trades)
When the RSI crosses below its midline ( RSI < 50%) a bearish bias signal is generated. (only take short trades)
Bullish and bearish moving average signal Line crossovers:
When the RSI line crosses above its signal line, a bullish buy signal is generated
When the RSI line crosses below its signal line, a bearish sell signal is generated.
Swing Failures and classic rejection patterns:
If the RSI makes a lower high, and then follows with a downside move below the previous low, a Top Swing Failure has occurred.
If the RSI makes a higher low, and then follows with an upside move above the previous high, a Bottom Swing Failure has occurred.
Examples of classic swing rejection patterns
Bullish swing rejection pattern:
The RSI moves into oversold zone (below 30%).
The RSI rejects back out of the oversold zone (above 30%)
The RSI forms another dip without crossing back into oversold zone.
The RSI then continues the bounce to break up above the previous high.
Bearish swing rejection pattern:
The RSI moves into overbought zone (above 70%).
The RSI rejects back out of the overbought zone (below 70%)
The RSI forms another peak without crossing back into overbought zone.
The RSI then continues to break down below the previous low.
Divergences:
A regular bullish RSI divergence is when the price makes lower lows in a downtrend and the RSI indicator makes higher lows.
A regular bearish RSI divergence is when the price makes higher highs in an uptrend and the RSI indicator makes lower highs.
A hidden bullish RSI divergence is when the price makes higher lows in an uptrend and the RSI indicator makes lower lows.
A hidden bearish RSI divergence is when the price makes lower highs in a downtrend and the RSI indicator makes higher highs.
Regular divergences can signal a reversal of the trending direction.
Hidden divergences can signal a continuation in the direction of the trend.
Chart Patterns:
RSI regularly forms classic chart patterns that may not show on the underlying price chart, such as ascending and descending triangles & wedges , double tops, bottoms and trend lines etc.
Support and Resistance:
It is very often easier to define support or resistance levels on the RSI itself rather than the price chart.
Modern interpretations in trending markets:
Modern interpretations of the RSI stress the context of the greater trend when using RSI signals such as crossovers, overbought/oversold conditions, divergences and patterns.
Constance Brown, CMT , was one of the first who promoted the idea that an oversold reading on the RSI in an uptrend is likely much higher than 30%, and that an overbought reading on the RSI during a downtrend is much lower than the 70% level.
In an uptrend or bull market, the RSI tends to remain in the 40 to 90 range, with the 40-50 zone acting as support.
During a downtrend or bear market, the RSI tends to stay between the 10 to 60 range, with the 50-60 zone acting as resistance.
For ease of executing more modern and nuanced interpretations of RSI it is very useful to break the RSI scale into bull and bear control and critical zones.
These ranges will vary depending on the RSI settings and the strength of the specific market’s underlying trend.
Limitations of the RSI
Like most technical indicators, its signals are most reliable when they conform to the long-term trend.
True trend reversal signals are rare, and can be difficult to separate from false signals.
False signals or “fake-outs”, e.g. a bullish crossover, followed by a sudden decline in price, are common.
Since the indicator displays momentum, it can stay overbought or oversold for a long time when an asset has significant sustained momentum in either direction.
Data Length Dependency when using wilders smoothing method of calculating RSI means that wilders standard RSI will have a potential initialization error which reduces with every new data point calculated meaning early results should be regarded as unreliable until calculation iterations have occurred for convergence.
Penunjuk Pine Script®

Reverse Cutlers Relative Strength IndexIntroduction
The Reverse Cutlers Relative Strength Index (RCRSI) is an indicator which tells the user what price is required to give a particular Cutlers Relative Strength Index (RSI) value, or cross its Moving Average (MA) signal line.
Overview
Background & Credits:
The relative strength index (RSI) is a momentum indicator used in technical analysis that was originally developed by J. Welles Wilder Jr. and introduced in his seminal 1978 book, “New Concepts in Technical Trading Systems.”.
Cutler created a variation of the RSI known as “Cutlers RSI” using a different formulation to avoid an inherent accuracy problem which arises when using Wilders method of smoothing.
Further developments in the use, and more nuanced interpretations of the RSI have been developed by Cardwell, and also by well-known chartered market technician, Constance Brown C.M.T., in her acclaimed book "Technical Analysis for the Trading Professional” 1999 where she described the idea of bull and bear market ranges for RSI, and while she did not actually reveal the formulas, she introduced the concept of “reverse engineering” the RSI to give price level outputs.
Renowned financial software developer, co-author of academic books on finance, and scientific fellow to the Department of Finance and Insurance at the Technological Educational Institute of Crete, Giorgos Siligardos PHD. brought a new perspective to Wilder’s RSI when he published his excellent and well-received articles "Reverse Engineering RSI " and "Reverse Engineering RSI II " in the June 2003, and August 2003 issues of Stocks & Commodities magazine, where he described his methods of reverse engineering Wilders RSI.
Several excellent Implementations of the Reverse Wilders Relative Strength Index have been published here on Tradingview and elsewhere.
My utmost respect, and all due credits to authors of related prior works.
Introduction
It is worth noting that while the general RSI formula, and the logic dictating the UpMove and DownMove data series as described above has remained the same as the Wilders original formulation, it has been interpreted in a different way by using a different method of averaging the upward, and downward moves.
Cutler recognized the issue of data length dependency when using wilders smoothing method of calculating RSI which means that wilders standard RSI will have a potential initialization error which reduces with every new data point calculated meaning early results should be regarded as unreliable until enough calculation iterations have occurred for convergence.
Hence Cutler proposed using Simple Moving Averaging for gain and loss data which this Indicator is based on.
Having "Reverse engineered" prices for any oscillator makes the planning, and execution of strategies around that oscillator far simpler, more timely and effective.
Introducing the Reverse Cutlers RSI which consists of plotted lines on a scale of 0 to 100, and an optional infobox.
The RSI scale is divided into zones:
• Scale high (100)
• Bull critical zone (80 - 100)
• Bull control zone (62 - 80)
• Scale midline (50)
• Bear critical zone (20 - 38)
• Bear control zone (0 - 20)
• Scale low (0)
The RSI plots are:
• Cutlers RSI
• RSI MA signal line
• Test price RSI
• Alert level high
• Alert level low
The info box displays output closing price levels where Cutlers RSI value will crossover:
• Its previous value. (RSI )
• Bull critical zone.
• Bull control zone.
• Mid-Line.
• Bear control zone.
• Bear critical zone.
• RSI MA signal line
• Alert level High
• Alert level low
And also displays the resultant RSI for a user defined closing price:
• Test price RSI
The infobox outputs can be shown for the current bar close, or the next bar close.
The user can easily select which information they want in the infobox from the setttings
Importantly:
All info box price levels for the current bar are calculated immediately upon the current bar closing and a new bar opening, they will not change until the current bar closes.
All info box price levels for the next bar are projections which are continually recalculated as the current price changes, and therefore fluctuate as the current price changes.
Understanding the Relative Strength Index
At its simplest the RSI is a measure of how quickly traders are bidding the price of an asset up or down.
It does this by calculating the difference in magnitude of price gains and losses over a specific lookback period to evaluate market conditions.
The RSI is displayed as an oscillator (a line graph that can move between two extremes) and outputs a value limited between 0 and 100.
It is typically accompanied by a moving average signal line.
Traditional interpretations
Overbought and oversold:
An RSI value of 70 or above indicates that an asset is becoming overbought (overvalued condition), and may be may be ready for a trend reversal or corrective pullback in price.
An RSI value of 30 or below indicates that an asset is becoming oversold (undervalued condition), and may be may be primed for a trend reversal or corrective pullback in price.
Midline Crossovers:
When the RSI crosses above its midline (RSI > 50%) a bullish bias signal is generated. (only take long trades)
When the RSI crosses below its midline (RSI < 50%) a bearish bias signal is generated. (only take short trades)
Bullish and bearish moving average signal Line crossovers:
When the RSI line crosses above its signal line, a bullish buy signal is generated
When the RSI line crosses below its signal line, a bearish sell signal is generated.
Swing Failures and classic rejection patterns:
If the RSI makes a lower high, and then follows with a downside move below the previous low, a Top Swing Failure has occurred.
If the RSI makes a higher low, and then follows with an upside move above the previous high, a Bottom Swing Failure has occurred.
Examples of classic swing rejection patterns
Bullish swing rejection pattern:
The RSI moves into oversold zone (below 30%).
The RSI rejects back out of the oversold zone (above 30%)
The RSI forms another dip without crossing back into oversold zone.
The RSI then continues the bounce to break up above the previous high.
Bearish swing rejection pattern:
The RSI moves into overbought zone (above 70%).
The RSI rejects back out of the overbought zone (below 70%)
The RSI forms another peak without crossing back into overbought zone.
The RSI then continues to break down below the previous low.
Divergences:
A regular bullish RSI divergence is when the price makes lower lows in a downtrend and the RSI indicator makes higher lows.
A regular bearish RSI divergence is when the price makes higher highs in an uptrend and the RSI indicator makes lower highs.
A hidden bullish RSI divergence is when the price makes higher lows in an uptrend and the RSI indicator makes lower lows.
A hidden bearish RSI divergence is when the price makes lower highs in a downtrend and the RSI indicator makes higher highs.
Regular divergences can signal a reversal of the trending direction.
Hidden divergences can signal a continuation in the direction of the trend.
Chart Patterns:
RSI regularly forms classic chart patterns that may not show on the underlying price chart, such as ascending and descending triangles & wedges, double tops, bottoms and trend lines etc.
Support and Resistance:
It is very often easier to define support or resistance levels on the RSI itself rather than the price chart.
Modern interpretations in trending markets:
Modern interpretations of the RSI stress the context of the greater trend when using RSI signals such as crossovers, overbought/oversold conditions, divergences and patterns.
Constance Brown, CMT, was one of the first who promoted the idea that an oversold reading on the RSI in an uptrend is likely much higher than 30%, and that an overbought reading on the RSI during a downtrend is much lower than the 70% level.
In an uptrend or bull market, the RSI tends to remain in the 40 to 90 range, with the 40-50 zone acting as support.
During a downtrend or bear market, the RSI tends to stay between the 10 to 60 range, with the 50-60 zone acting as resistance.
For ease of executing more modern and nuanced interpretations of RSI it is very useful to break the RSI scale into bull and bear control and critical zones.
These ranges will vary depending on the RSI settings and the strength of the specific market’s underlying trend.
Limitations of the RSI
Like most technical indicators, its signals are most reliable when they conform to the long-term trend.
True trend reversal signals are rare, and can be difficult to separate from false signals.
False signals or “fake-outs”, e.g. a bullish crossover, followed by a sudden decline in price, are common.
Since the indicator displays momentum, it can stay overbought or oversold for a long time when an asset has significant sustained momentum in either direction.
Data Length Dependency when using wilders smoothing method of calculating RSI means that wilders standard RSI will have a potential initialization error which reduces with every new data point calculated meaning early results should be regarded as unreliable until calculation iterations have occurred for convergence.
Penunjuk Pine Script®

Inside SwingsOverview
The Inside Swings indicator identifies and visualizes "inside swing" patterns in price action. These patterns occur when price creates a series of pivots that form overlapping ranges, indicating potential consolidation or reversal zones.
What are Inside Swings?
Inside swings are specific pivot patterns where:
- HLHL Pattern: High-Low-High-Low sequence where the first high is higher than the second high, and the first low is lower than the second low
- LHLH Pattern: Low-High-Low-High sequence where the first low is lower than the second low, and the first high is higher than the second high
Here an Example
These patterns create overlapping price ranges that often act as:
- Support/Resistance zones
- Consolidation areas
- Potential reversal points
- Breakout levels
Levels From the Created Range
Input Parameters
Core Settings
- Pivot Lookback Length (default: 5): Number of bars on each side to confirm a pivot high/low
- Max Boxes (default: 100): Maximum number of patterns to display on chart
Extension Settings
- Extend Lines: Enable/disable line extensions - this extends the Extremes of the Swings to where a new Swing Started or Extended Right for the Latest Inside Swings
- Show High 1 Line: Display first high/low extension line
- Show High 2 Line: Display second high/low extension line
- Show Low 1 Line: Display first low/high extension line
- Show Low 2 Line: Display second low/high extension line
Visual Customization
Box Colors
- HLHL Box Color: Color for HLHL pattern boxes (default: green)
- HLHL Border Color: Border color for HLHL boxes
- LHLH Box Color: Color for LHLH pattern boxes (default: red)
- LHLH Border Color: Border color for LHLH boxes
Line Colors
- HLHL Line Color: Extension line color for HLHL patterns
- LHLH Line Color: Extension line color for LHLH patterns
- Line Width: Thickness of extension lines (1-5)
Pattern Detection Logic
HLHL Pattern (Bullish Inside Swing)
Condition: High1 > High2 AND Low1 < Low2
Sequence: High → Low → High → Low
Visual: Two overlapping boxes with first range encompassing second
Detection Criteria:
1. Last 4 pivots form High-Low-High-Low sequence
2. Fourth pivot (first high) > Second pivot (second high)
3. Third pivot (first low) < Last pivot (second low)
LHLH Pattern (Bearish Inside Swing)
Condition: Low1 < Low2 AND High1 > High2
Sequence: Low → High → Low → High
Visual: Two overlapping boxes with first range encompassing second
Detection Criteria:
1. Last 4 pivots form Low-High-Low-High sequence
2. Fourth pivot (first low) < Second pivot (second low)
3. Third pivot (first high) > Last pivot (second high)
Visual Elements
Boxes
- Box 1: Spans from first pivot to last pivot (larger range)
- Box 2: Spans from third pivot to last pivot (smaller range)
- Overlap: The intersection of both boxes represents the inside swing zone
Extension Lines
- High 1 Line: Horizontal line at first high/low level
- High 2 Line: Horizontal line at second high/low level
- Low 1 Line: Horizontal line at first low/high level
- Low 2 Line: Horizontal line at second low/high level
Line Extension Behavior
- Historical Patterns: Lines extend until the next pattern starts
- Latest Pattern: Lines extend to the right edge of chart
- Dynamic Updates: All lines are redrawn on each bar for accuracy
Trading Applications
Support/Resistance Levels
Inside swing levels often act as:
- Dynamic support/resistance
- Breakout confirmation levels
- Reversal entry points
Pattern Interpretation
- HLHL Patterns: Potential bullish continuation or reversal
- LHLH Patterns: Potential bearish continuation or reversal
- Overlap Zone: Key area for price interaction
Entry Strategies
1. Breakout Strategy: Enter on break above/below inside swing levels
2. Reversal Strategy: Enter on bounce from inside swing levels
3. Range Trading: Trade between inside swing levels
Technical Implementation
Data Structures
type InsideSwing
int startBar // First pivot bar
int endBar // Last pivot bar
string patternType // "HLHL" or "LHLH"
float high1 // First high/low
float low1 // First low/high
float high2 // Second high/low
float low2 // Second low/high
box box1 // First box
box box2 // Second box
line high1Line // High 1 extension line
line high2Line // High 2 extension line
line low1Line // Low 1 extension line
line low2Line // Low 2 extension line
bool isLatest // Latest pattern flag
Memory Management
- Pattern Storage: Array-based storage with automatic cleanup
- Pivot Tracking: Maintains last 4 pivots for pattern detection
- Resource Cleanup: Automatically removes oldest patterns when limit exceeded
Performance Optimization
- Duplicate Prevention: Checks for existing patterns before creation
- Efficient Redraw: Only redraws lines when necessary
- Memory Limits: Configurable maximum pattern count
Usage Tips
Best Practices
1. Combine with Volume: Use volume confirmation for breakouts
2. Multiple Timeframes: Check higher timeframes for context
3. Risk Management: Set stops beyond inside swing levels
4. Pattern Validation: Wait for confirmation before entering
Common Scenarios
- Consolidation Breakouts: Inside swings often precede significant moves
- Reversal Zones: Failed breakouts at inside swing levels
- Trend Continuation: Inside swings in trending markets
Limitations
- Lagging Indicator: Patterns form after completion
- False Signals: Not all inside swings lead to significant moves
- Market Dependent: Effectiveness varies by market conditions
Customization Options
Visual Adjustments
- Modify colors for different market conditions
- Adjust line widths for visibility
- Enable/disable specific elements
Detection Sensitivity
- Increase pivot length for smoother patterns
- Decrease for more sensitive detection
- Balance between noise and signal
Display Management
- Control maximum pattern count
- Adjust cleanup frequency
- Manage memory usage
Conclusion
The Inside Swings indicator provides a systematic approach to identifying consolidation and potential reversal zones in price action. By visualizing overlapping pivot ranges
The indicator's strength lies in its ability to:
- Identify key price levels automatically
- Provide visual context for market structure
- Offer flexible customization options
- Maintain performance through efficient memory management
Penunjuk Pine Script®

Swing Breakout System (SBS)The Swing Breakout Sequence (SBS) is a trading strategy that focuses on identifying high-probability entry points based on a specific pattern of price swings. This indicator will identify these patterns, then draw lines and labels to show confirmation.
How To Use:
The indicator will show both Bullish and Bearish SBS patterns.
Bullish Pattern is made up of 6 points: Low (0), HH (1), LL (2 | but higher than initial Low), New HH (3), LL (5), LL again (5)
Bearish Patten is made up of 6 points: High (0), LL (1), HH (2 | but lower than initial high), New LL (3), HH (5), HH again (5)
A label with an arrow will appear at the end, showing the completion of a successful sequence
Idea behind the strategy:
The idea behind this strategy, is the accumulation and then manipulation of liquidity throughout the sequence. For example, during SBS sequence, liquidity is accumulated during step (2), then price will push away to make a new high/low (step 3), after making a minor new high/low, price will retrace breaking the key level set up in step (2). This is price manipulating taking liquidity from behind high/low from step (2). After taking liquidity price the idea is price will continue in the original direction.
Step 0 - Setting up initial direction
Step 1 - Setting up initial direction
Step 2 - Key low/high establishing liquidity
Step 3 - Failed New high/low
Step 4 - Taking liquidity from step (2)
Step 5 - Taking liquidity from step 2 and 4
Pattern Detection:
- Uses pivot high/low points to identify swing patterns
- Stores 6 consecutive swing points in arrays
- Identifies two types of patterns:
1. Bullish Pattern: A specific sequence of higher lows and higher highs
2. Bearish Pattern: A specific sequence of lower highs and lower lows
Note: Because the indicator is identifying a perfect sequence of 6 steps, set ups may not appear frequently.
Visualization:
- Draws connecting lines between swing points
- Labels each point numerically (optional)
- Shows breakout arrows (↑ for bullish, ↓ for bearish)
- Generates alerts on valid breakouts
User Input Settings:
Core Parameters
1. Pivot Lookback Period (default: 2)
- Controls how many bars to look back/forward for pivot point detection
- Higher values create fewer but more significant pivot points
2. Minimum Pattern Height % (default: 0.1)
- Minimum required height of the pattern as a percentage of price
- Filters out insignificant patterns
3. Maximum Pattern Width (bars) (default: 50)
- Maximum allowed width of the pattern in bars
- Helps exclude patterns that form over too long a period
Penunjuk Pine Script®

N Bar Reversal Detector [LuxAlgo]The N Bar Reversal Detector is designed to detect and highlight N-bar reversal patterns in user charts, where N represents the length of the candle sequence used to detect the patterns. The script incorporates various trend indicators to filter out detected signals and offers a range of customizable settings to fit different trading strategies.
🔶 USAGE
The N-bar reversal pattern extends the popular 3-bar reversal pattern. While the 3-bar reversal pattern involves identifying a sequence of three bars signaling a potential trend reversal, the N-bar reversal pattern builds on this concept by incorporating additional bars based on user settings. This provides a more comprehensive indication of potential trend reversals. The script automates the identification of these patterns and generates clear, visually distinct signals to highlight potential trend changes.
When a reversal chart pattern is confirmed and aligns with the price action, the pattern's boundaries are extended to create levels. The upper boundary serves as resistance, while the lower boundary acts as support.
The script allows users to filter patterns based on the trend direction identified by various trend indicators. Users can choose to view patterns that align with the detected trend or those that are contrary to it.
🔶 DETAILS
🔹 The N-bar Reversal Pattern
The N-bar reversal pattern is a technical analysis tool designed to signal potential trend reversals in the market. It consists of N consecutive bars, with the first N-1 bars used to identify the prevailing trend and the Nth bar confirming the reversal. Here’s a detailed look at the pattern:
Bullish Reversal : In a bullish reversal setup, the first bar is the highest among the first N-1 bars, indicating a prevailing downtrend. Most of the remaining bars in this sequence should be bearish (closing lower than where they opened), reinforcing the existing downward momentum. The Nth (most recent) bar confirms a bullish reversal if its high price is higher than the high of the first bar in the sequence (standard pattern). For a stronger signal, the closing price of the Nth bar should also be higher than the high of the first bar.
Bearish Reversal : In a bearish reversal setup, the first bar is the lowest among the first N-1 bars, indicating a prevailing uptrend. Most of the remaining bars in this sequence should be bullish (closing higher than where they opened), reinforcing the existing upward momentum. The Nth bar confirms a bearish reversal if its low price is lower than the low of the first bar in the sequence (standard pattern). For a stronger signal, the closing price of the Nth bar should also be lower than the low of the first bar.
🔹 Min Percentage of Required Candles
This parameter specifies the minimum percentage of candles that must be bullish (for a bearish reversal) or bearish (for a bullish reversal) among the first N-1 candles in a pattern. For higher values of N, it becomes more challenging for all of the first N-1 candles to be consistently bullish or bearish. By setting a percentage value, P, users can adjust the requirement so that only a minimum of P percent of the first N-1 candles need to meet the bullish or bearish condition. This allows for greater flexibility in pattern recognition, accommodating variations in market conditions.
🔶 SETTINGS
Pattern Type: Users can choose the type of the N-bar reversal patterns to detect: Normal, Enhanced, or All. "Normal" detects patterns that do not necessarily surpass the high/low of the first bar. "Enhanced" detects patterns where the last bar surpasses the high/low of the first bar. "All" detects both Normal and Enhanced patterns.
Reversal Pattern Sequence Length: Specifies the number of candles (N) in the sequence used to identify a reversal pattern.
Min Percentage of Required Candles: Sets the minimum percentage of the first N-1 candles that must be bullish (for a bearish reversal) or bearish (for a bullish reversal) to qualify as a valid reversal pattern.
Derived Support and Resistance: Toggles the visibility of the support and resistance levels/zones.
🔹 Trend Filtering
Filtering: Allows users to filter patterns based on the trend indicators: Moving Average Cloud, Supertrend, and Donchian Channels. The "Aligned" option only detects patterns that align with the trend and conversely, the "Opposite" option detects patterns that go against the trend.
🔹 Trend Indicator Settings
Moving Average Cloud: Allows traders to choose the type of moving averages (SMA, EMA, HMA, etc.) and set the lengths for fast and slow moving averages.
Supertrend: Options to set the ATR length and factor for Supertrend.
Donchian Channels: Option to set the length for the channel calculation.
🔶 RELATED SCRIPTS
Reversal-Candlestick-Structure.
Reversal-Signals.
Penunjuk Pine Script®

Diamonds Infiniti - Aynet FiboThe "Diamonds Infiniti - Aynet Fibo" Pine Script combines the geometric visualization of diamond patterns with Fibonacci retracement levels to create an innovative technical indicator for analyzing market trends and potential reversal points. Below is a detailed explanation of the code and its functionality:
Key Features
Dynamic Fibonacci Levels
High and Low Points: The script calculates the highest high and lowest low over a user-defined lookback period (lookback) to establish a price range.
Fibonacci Price Levels: Using the defined price range, the script calculates the Fibonacci retracement levels (0%, 23.6%, 38.2%, 50%, 61.8%, 100%) relative to the low point.
Trend Change Detection
Crossovers and Crossunders: The script monitors whether the closing price crosses over or under the calculated Fibonacci levels. This detection is encapsulated in the isTrendChange function.
Trend Signal: If a trend change occurs at any of the Fibonacci levels (23.6%, 38.2%, 50%, 61.8%), the script flags it as a trend change and stores the bar index of the last signal.
Diamond Pattern Visualization
Diamond Construction: The drawDiamond function draws a diamond shape at a given bar index using a central price, a top price, and a bottom price.
Trigger for Drawing Diamonds: When a trend change is detected, the script draws two diamonds—one on the left and one on the right—connected by a central line. The diamonds are based on the calculated price range (price_range) and a user-defined pattern height (patternHeight).
Fibonacci Level Visualization
Overlay of Fibonacci Levels: The script plots the calculated Fibonacci levels (23.6%, 38.2%, 50%, 61.8%) on the chart as dotted lines for easier visualization.
Scientific and Trading Use Cases
Trend Visualization:
The diamond pattern visually highlights trend changes around key Fibonacci retracement levels, providing traders with clear indicators of potential reversal zones.
Support and Resistance Zones:
Fibonacci retracement levels are widely recognized as key support and resistance zones. Overlaying these levels helps traders anticipate price behavior in these areas.
Adaptive Trading:
By dynamically recalculating Fibonacci levels and diamond patterns based on the most recent price range, the script adapts to changing market conditions.
Possible Enhancements
Multi-Timeframe Support:
Extend the script to calculate Fibonacci levels and diamond patterns across multiple timeframes for broader market analysis.
Alerts:
Add alerts for when the price crosses specific Fibonacci levels or when a new diamond pattern is drawn.
Additional Patterns:
Include other geometric patterns like triangles or rectangles for further trend analysis.
This script is a powerful visualization tool that combines Fibonacci retracement with unique diamond patterns. It simplifies complex price movements into easily interpretable signals, making it highly effective for both novice and experienced traders.
Penunjuk Pine Script®
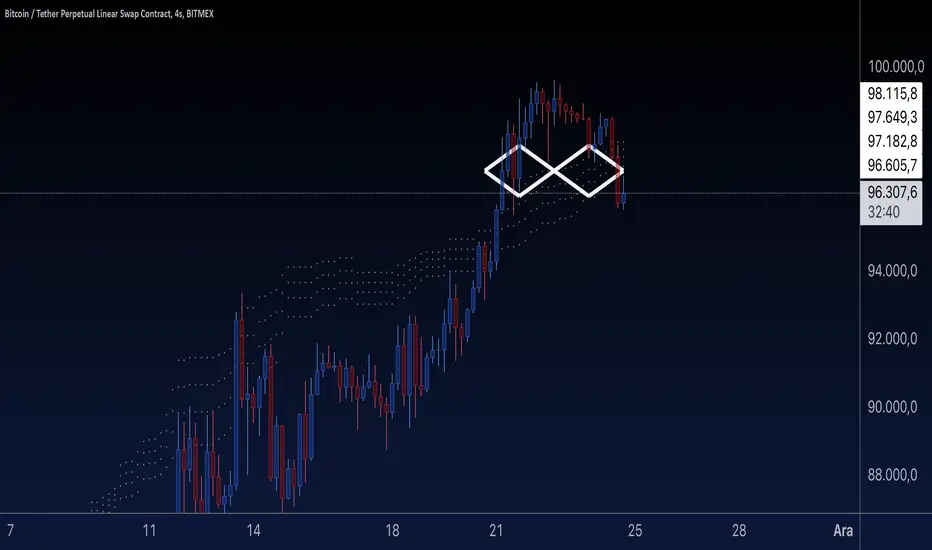
Engulfing BoxThe Engulfing Box indicator is a custom script designed to visually highlight and track bullish and bearish engulfing candlestick patterns on a price chart. These patterns are often used to identify potential reversal points, making them valuable for technical analysis. The script dynamically draws colored boxes around these patterns, helping users easily spot them in the price action.
Key Features:
Bullish Engulfing Pattern: When a candlestick fully engulfs the previous bearish candle (i.e., the close of the current candle is higher than the open of the previous candle, and the open is lower than the close of the previous candle), the script draws a green box around the bullish engulfing candle. This box is drawn from the open of the previous candle to the low of the previous candle.
Bearish Engulfing Pattern: When a candlestick fully engulfs the previous bullish candle (i.e., the close of the current candle is lower than the open of the previous candle, and the open is higher than the close of the previous candle), a red box is drawn around the bearish engulfing candle. This box is drawn from the open of the previous candle to the high of the previous candle.
Dynamic Box Management: Once an engulfing pattern is detected, a box is drawn with the following attributes:
Bullish Engulfing Box: Green, with a transparent background.
Bearish Engulfing Box: Red, with a transparent background.
The box will adjust its color to gray if the price moves past certain thresholds, indicating that the engulfing pattern may no longer be as relevant.
Max Pattern Tracking: The script limits the number of engulfing boxes tracked on the chart to prevent clutter. The maximum number of bullish and bearish engulfing patterns shown is customizable (set to 500 by default), and once this limit is exceeded, older boxes are deleted to maintain a clean chart.
Pattern Expiry: Boxes are deleted if price action moves beyond the pattern’s range, ensuring that outdated signals are removed. If the low price falls below the bottom of the bullish engulfing box, or the high price rises above the top of the bearish engulfing box, the respective box is removed. Additionally, if the low price moves below the top of the bullish box or the high price exceeds the bottom of the bearish box, the box's color is changed to a more neutral tone.
How it Works:
Pattern Detection: The script compares the current price data with the previous candlestick to detect the bullish or bearish engulfing patterns.
Box Creation: If a pattern is detected, a colored box is drawn around the candle to visually highlight the pattern.
Pattern Expiry and Cleanup: The script continuously monitors past boxes. If the price moves too far from the box’s range, the box is either deleted or altered to reflect the reduced significance of the pattern.
B ox Count Limit: To avoid clutter, the script ensures that no more than 500 bullish or bearish engulfing boxes are shown at any time.
Customization:
The number of previous bars to scan for engulfing patterns can be adjusted (maxBarsback).
The maximum number of patterns displayed at any time can be modified.
Penunjuk Pine Script®

Engulfings/DojiDescription of the Indicator:
The "Engulfings/Doji" indicator, is designed to assist traders in identifying significant candlestick patterns on price charts. This indicator focuses on two primary candlestick patterns: Bullish Engulfing and Bearish Engulfing, as well as the Doji pattern. It provides valuable insights into potential price reversals or continuations. Here's how it works and how to use it:
Concepts Underlying the Calculations:
Bullish Engulfing and Bearish Engulfing Patterns: Bullish Engulfing patterns occur when a candle's open and close prices are lower than the previous candle's open and close, and the current candle completely engulfs the previous one. Bearish Engulfing patterns are the opposite, with the current candle's open and close prices higher than the previous candle's open and close, completely engulfing it.
Doji Pattern: The indicator also detects Doji candles. A Doji is characterized by a small or nearly non-existent body, indicating uncertainty or market indecision.
Time Filtering (Sig_Time): The indicator applies time-based filters to consider these patterns only during specific trading sessions or hours. This helps traders focus on more relevant signals during active market times.
Higher Timeframe (HTF) Engulfing Patterns: Additionally, the indicator can display HTF (Higher Timeframe) Engulfing patterns on the current chart, allowing traders to identify stronger signals occurring on higher timeframes.
How to Use the Indicator:
The indicator identifies and visually represents Bullish Engulfing, Bearish Engulfing, and Doji patterns on the price chart.
The colors of these patterns can be customized based on their significance and the time of occurrence.
Traders can set a maximum allowable body size for Doji patterns using the "Doji's Max Body size" input.
The "Show HTF Engulfings" input allows traders to display HTF Engulfing patterns on the chart.
Traders can choose not to display Doji patterns on the 1-minute (M1) timeframe by enabling the "Don't display Doji on M1" option.
Candlestick patterns and Doji signals are displayed with appropriate symbols and colors to help traders identify potential trading opportunities.
The time-based filtering enhances the relevance of the signals presented by the indicator.
Penunjuk Pine Script®
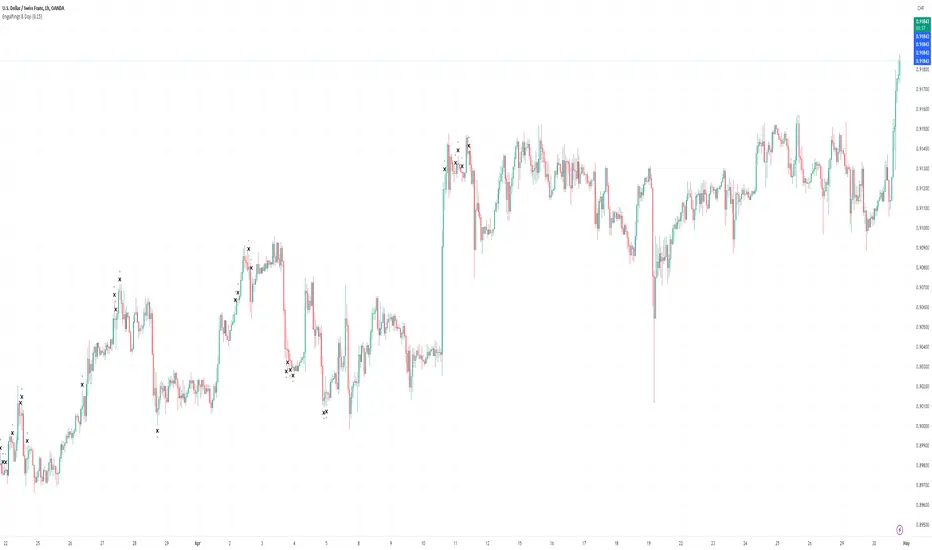
reversalchartpatternsLibrary "reversalchartpatterns"
User Defined Types and Methods for reversal chart patterns - Double Top, Double Bottom, Triple Top, Triple Bottom, Cup and Handle, Inverted Cup and Handle, Head and Shoulders, Inverse Head and Shoulders
method delete(this)
Deletes the drawing components of ReversalChartPatternDrawing object
Namespace types: ReversalChartPatternDrawing
Parameters:
this (ReversalChartPatternDrawing) : ReversalChartPatternDrawing object
Returns: current ReversalChartPatternDrawing object
method delete(this)
Deletes the drawing components of ReversalChartPattern object. In turn calls the delete of ReversalChartPatternDrawing
Namespace types: ReversalChartPattern
Parameters:
this (ReversalChartPattern) : ReversalChartPattern object
Returns: current ReversalChartPattern object
method lpush(this, obj, limit, deleteOld)
Array push with limited number of items in the array. Old items are deleted when new one comes and exceeds the limit
Namespace types: array
Parameters:
this (array) : array object
obj (ReversalChartPattern) : ReversalChartPattern object which need to be pushed to the array
limit (int) : max items on the array. Default is 10
deleteOld (bool) : If set to true, also deletes the drawing objects. If not, the drawing objects are kept but the pattern object is removed from array. Default is false.
Returns: current ReversalChartPattern object
method draw(this)
Draws the components of ReversalChartPatternDrawing
Namespace types: ReversalChartPatternDrawing
Parameters:
this (ReversalChartPatternDrawing) : ReversalChartPatternDrawing object
Returns: current ReversalChartPatternDrawing object
method draw(this)
Draws the components of ReversalChartPatternDrawing within the ReversalChartPattern object.
Namespace types: ReversalChartPattern
Parameters:
this (ReversalChartPattern) : ReversalChartPattern object
Returns: current ReversalChartPattern object
method scan(zigzag, patterns, errorPercent, shoulderStart, shoulderEnd, allowedPatterns, offset)
Scans zigzag for ReversalChartPattern occurences
Namespace types: zg.Zigzag
Parameters:
zigzag (Zigzag type from Trendoscope/Zigzag/11) : ZigzagTypes.Zigzag object having array of zigzag pivots and other information on each pivots
patterns (array) : Existing patterns array. Used for validating duplicates
errorPercent (float) : Error threshold for considering ratios. Default is 13
shoulderStart (float) : Starting range of shoulder ratio. Used for identifying shoulders, handles and necklines
shoulderEnd (float) : Ending range of shoulder ratio. Used for identifying shoulders, handles and necklines
allowedPatterns (array) : array of int containing allowed pattern types
offset (int) : Offset of zigzag to consider only confirmed pivots
Returns: int pattern type
method createPattern(zigzag, patternType, patternColor, properties, offset)
Create Pattern from ZigzagTypes.Zigzag object
Namespace types: zg.Zigzag
Parameters:
zigzag (Zigzag type from Trendoscope/Zigzag/11) : ZigzagTypes.Zigzag object having array of zigzag pivots and other information on each pivots
patternType (int) : Type of pattern being created. 1 - Double Tap, 2 - Triple Tap, 3 - Cup and Handle, 4 - Head and Shoulders
patternColor (color) : Color in which the patterns are drawn
properties (ReversalChartTradeProperties)
offset (int)
Returns: ReversalChartPattern object created
method getName(this)
get pattern name of ReversalChartPattern object
Namespace types: ReversalChartPattern
Parameters:
this (ReversalChartPattern) : ReversalChartPattern object
Returns: string name of the pattern
method getDescription(this)
get consolidated description of ReversalChartPattern object
Namespace types: ReversalChartPattern
Parameters:
this (ReversalChartPattern) : ReversalChartPattern object
Returns: string consolidated description
method init(this)
initializes the ReversalChartPattern object and creates sub object types
Namespace types: ReversalChartPattern
Parameters:
this (ReversalChartPattern) : ReversalChartPattern object
Returns: ReversalChartPattern current object
ReversalChartPatternDrawing
Type which holds the drawing objects for Reversal Chart Pattern Types
Fields:
patternLines (array type from Trendoscope/Drawing/2) : array of Line objects representing pattern
entry (Line type from Trendoscope/Drawing/2) : Entry price Line
targets (array type from Trendoscope/Drawing/2)
stop (Line type from Trendoscope/Drawing/2) : Stop price Line
patternLabel (Label type from Trendoscope/Drawing/2)
ReversalChartTradeProperties
Trade properties of ReversalChartPattern
Fields:
riskAdjustment (series float) : Risk Adjustment for calculation of stop
useFixedTarget (series bool) : Boolean flag saying use fixed target type wherever possible. If fixed target type is not possible, then risk reward/fib ratios are used for calculation of targets
variableTargetType (series int) : Integer value which defines whether to use fib based targets or risk reward based targets. 1 - Risk Reward, 2 - Fib Ratios
variableTargetRatios (array) : Risk reward or Fib Ratios to be used for calculation of targets when fixed target is not possible or not enabled
entryPivotForWm (series int) : which Pivot should be considered as entry point for WM patterns. 0 refers to the latest breakout pivot where as 5 refers to initial pivot of the pattern
ReversalChartPattern
Reversal Chart Pattern master type which holds the pattern components, drawings and trade details
Fields:
pivots (array type from Trendoscope/Zigzag/11) : Array of Zigzag Pivots forming the pattern
patternType (series int) : Defines the main type of pattern 1 - Double Tap, 1 - Triple Tap, 3 - Cup and Handle, 4 - Head and Shoulders, 5- W/M Patterns, 6 - Full Trend, 7 - Half Trend
patternColor (series color) : Color in which the pattern will be drawn on chart
properties (ReversalChartTradeProperties)
drawing (ReversalChartPatternDrawing) : ReversalChartPatternDrawing object which holds the drawing components
trade (Trade type from Trendoscope/TradeTracker/1) : TradeTracker.Trade object holding trade components
Perpustakaan Pine Script®

Price Action All In OneThis indicator represents the most advanced level of price action indicators, incorporating six useful features: traditional gaps, shadow gaps, bar counting, moving averages, previous values, and IO pattern matching .
When I refer to price action, I mean the teachings of Dr. Al Brooks.
While you can find these features in other indicators, mine is more advanced. The default settings are designed to work on a 5-minute timeframe, but you can also use this indicator on other time periods if you prefer.
Gaps
Traditional Gaps: Occurs when the lowest price of a bar is higher than the highest price of the previous bar, or the highest price of a bar is lower than the lowest price of the previous bar.
Shadow/Tail Gaps: Occurs when the lowest price of a bar is higher than the highest price of the second last bar, or the highest price of a bar is lower than the lowest price of the second last bar.
Gaps indicate strength, and consecutive gaps in one direction are characteristic of a strong trend. They offer a perspective on the strength of a trend, signifying that limit orders on one side are at a loss with no opportunity to exit at breakeven. Can bulls or bears create gaps? Are the gaps they create filled, or do they remain open?
Traditional Gaps & Shadow/Tail Gaps
Bar Counting
The ability to use different timeframes (e.g., to determine the minute within an hour or the hour within a week).
Consistent display of 1; in other indicators, if you set intervals to 2, you see 2, 4, 6, etc., or 1, 2, 4, 6. In my indicator, you will see 1, 3, 5, etc.
In intraday trading, certain specific times are more important than others. For example, a form of reversal is more likely to occur at the midpoint of the trading day (if there are 80 candles in a day, the midpoint is at the 40th candle).
This doesn't mean you should make reversal trades at the 40th candle. The bar count feature simply reminds you of the current time, helping you gauge how long until the trading day ends. For instance, if there are 80 candles in a day and you're an intraday trader, you probably shouldn't make a swing trade at the 70th candle because there are only 10 candles left until the close—likely not enough time for a swing to develop.
Additionally, if you trade on a 5-minute timeframe, seeing candles numbered 3, 6, 9, etc. indicates the close of a 15-minute candle. This means that in addition to 5-minute timeframe traders, 15-minute timeframe traders will also pay attention to these candles, making them more significant. For the same reason, the 12th candle is crucial, as its close also marks the close of an hourly candle.
Day Time Frame & Week Time Frame
Moving Averages
Provides three EMAs. You can set different timeframes and choose between continuous or discrete modes.
Moving averages are excellent tools for determining trends. The 20 EMA is particularly popular, which increases its significance. Traders using different timeframes, such as 5-minute, 15-minute, and 1-hour, all utilize the 20 EMA. This indicator allows you to see what traders on 15-minute and 1-hour timeframes are observing, even when you're on a 5-minute timeframe.
Once again, the default settings of this indicator assume that the user is trading intraday on a 5-minute timeframe. However, if that's not the case, you can easily adjust the moving average periods. For instance, if you trade on a 1-hour timeframe and want to display the 4-hour and daily moving averages on your chart, this can be done effortlessly.
5m 20, 15m 20 & 1h 20
Previous Values
Features three previous value displays. You can set their sources and timeframes independently and define the range for all previous values.
For intraday trading, marking the previous day's high, low, and close prices can be crucial. While some other indicators provide this feature, mine does it better. You can set different timeframes and choose various sources. For example, you might want to display the average of (O+H+L+C)/4 for the last week.
In addition to setting the timeframe and source, you can also configure the display range:
All: This will show the data in all positions. For example, you can see the high price from two days ago on yesterday's chart.
Today: This will only display the previous day's high price on the current day's chart.
Timeframe: This will display the data based on the specified timeframe you set.
Last Week High, Last Day Close & Low(Timeframe Display)
IO Pattern Matching
More advanced than other IO pattern matching indicators. For adjacent IIs, it merges to display as III, IIII, and so on. The same applies to OO patterns. Additionally, it automatically merges adjacent IOI and II into IOII, and adjacent OO and IOI into IIOI.
II Pattern: This refers to two consecutive inside bar candles. On a lower timeframe, the II pattern forms a converging triangle, which is a breakout pattern. The II pattern could also potentially become a final flag, which is the last flag in a trend.
OO Pattern: This refers to two consecutive outside bar candles. On a lower timeframe, the OO pattern forms an expanding triangle. You can use the OO pattern similarly to how you would use an expanding triangle.
IOI Pattern: This pattern occurs when the first candle is contained within the second candle, and the third candle is also contained within the second candle. This is a breakout pattern and could similarly represent a terminal flag in a trend.
The appearance of II, OO, or IOI patterns does not necessarily mean you should make a reversal trade. These patterns are meant to mark potential moves in a lower timeframe within the current cycle, providing a new perspective on the market and reminding you to stay vigilant.
You shouldn't look for IO patterns in a tight trading range. There are many IO patterns in a tight trading range, but they don't hold much significance.
II, OO & IOI
Penunjuk Pine Script®

Hammer and inverted Hammer
The "Hammer and Inverted Hammer" indicator is straightforward and effective. It automatically spots key candlestick patterns for you, making it easier to see potential market turns. You can also adjust a few settings to fit your trading style. Simple, yet quite handy for traders!
Alerts for Hammer Pattern: When the script identifies a Hammer pattern, it can trigger an alert. This is particularly useful if you're looking for potential bullish reversal signals and don't want to miss them.
Alerts for Inverted Hammer Pattern: Similarly, when an Inverted Hammer pattern is detected, the script can also trigger an alert. This is helpful for spotting potential bearish reversal signals.
SETTINGS EXPLAINED
Minimum Lower Tail Length (%): This setting allows you to define what percentage of the total candle size should be considered a significant lower tail. This is important for identifying the Hammer pattern.
Number of Consecutive Candles (for Lower Tails): This input lets you choose how many consecutive candles with significant lower tails must be present to identify a pattern.
Percentage of Candle Below Previous Low: This setting determines what percentage of the candle's range must extend below the lowest low of a specified number of previous candles. It's used to assess the significance of a Hammer pattern.
Number of Previous Candles for Lowest Low: This decides how many previous candles the script should look at to calculate the lowest low, which is then used in the Hammer pattern analysis.
Minimum Upper Tail Length (%): Similar to the lower tail setting, this defines the significant length of an upper tail, used for identifying the Inverted Hammer pattern.
Number of Consecutive Candles (for Upper Tails): This input is for setting how many consecutive candles with significant upper tails are required to confirm an Inverted Hammer pattern.
Percentage of Candle Above Previous High: This setting is used to determine how much of the candle's range must be above the highest high of a set number of previous candles, aiding in the identification of the Inverted Hammer pattern.
Number of Previous Candles for Highest High: It specifies the number of past candles to consider for calculating the highest high, which is important for the analysis of Inverted Hammer patterns.
These settings allow you to customize how the script identifies Hammer and Inverted Hammer patterns, making it adaptable to different trading strategies and market conditions.
Penunjuk Pine Script®
