Consolidation Box1. Overview & Purpose
The "Faithful Box" is a powerful TradingView indicator designed to automatically identify and visualize high-quality price consolidation zones, often known as 'trading ranges' or 'boxes'.
This tool is a direct Pine Script translation of a specific, robust Python-based analysis strategy. Its primary goal is not just to find any sideways movement, but to qualify it based on a strict set of rules, ensuring that only meaningful and tradable consolidation patterns are highlighted on the chart.
2. Core Logic: How It Works
The indicator's intelligence is based on several key rules translated from the original Python script:
Box Definition (Based on Closing Prices): The most crucial rule is how the box is defined. Unlike many tools that use candle wicks (highs and lows), this indicator establishes the Ceiling (Resistance) and the Floor (Support) of the box using the highest Close price and the lowest Close price over the specified analysis period. This provides a more stable and representative view of the true consolidation zone, ignoring outlier price spikes.
Quality Filters: A consolidation is only considered valid and drawn on the chart if it meets two strict criteria:
Minimum Touches: The price must "test" the ceiling and floor a minimum number of times. A "touch" is counted with a tolerance — the High of a candle only needs to get close to the ceiling, and the Low close to the floor. This simulates how price interacts with support and resistance zones in the real world.
Maximum Height: The consolidation range cannot be excessively wide or volatile. The box will only be drawn if its total height, as a percentage of its price, is below a user-defined limit.
3. Visual Features on the Chart
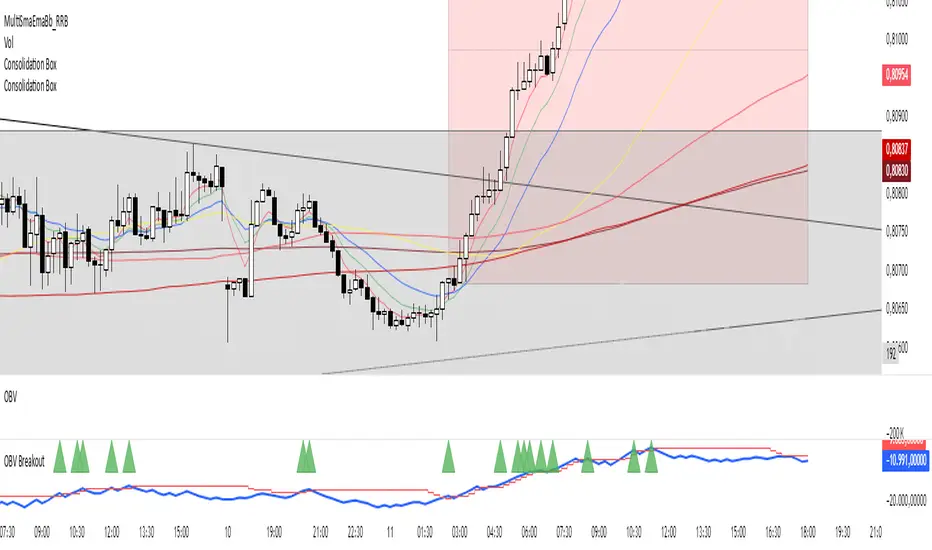
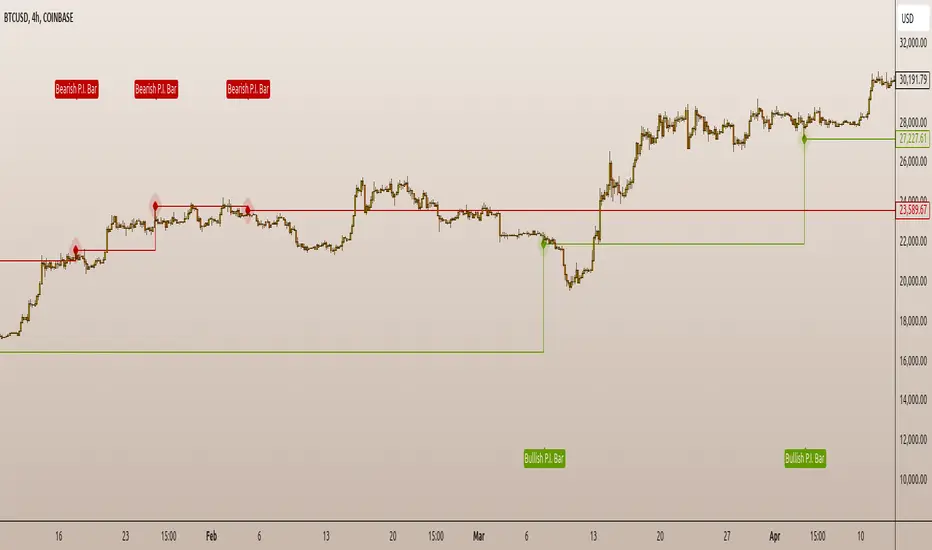
When a valid consolidation pattern is detected, the indicator draws a semi-transparent box over the analysis period. The most powerful visual feature is its dynamic coloring, which functions as a built-in alert system:
🟥 Red Box: The box turns red when the price enters the upper "Action Zone" (e.g., the top 30% of the range). This visually signals that the price is near a key resistance level, alerting the trader to a potential reversal or breakout opportunity.
🟩 Green Box: The box turns green when the price enters the lower "Action Zone" (e.g., the bottom 30% of the range). This highlights that the price is testing a key support level.
⬜ Gray Box: The box remains a neutral gray when the price is trading in the middle of the range, which can often be considered a "no-trade" or "wait-and-see" zone.
4. Configuration (Indicator Inputs)
You have full control over the indicator's sensitivity through its inputs:
Analysis Period (days): Defines the lookback window (in trading days) to search for a consolidation pattern. Common values are 42 (approx. 2 months) or 63 (approx. 3 months).
Maximum Box Height (%): Filters out consolidations that are too volatile or wide. A lower percentage will find tighter, more compressed consolidations.
Minimum Ceiling/Floor Touches: Defines the "strength" of the support and resistance levels. Requiring more touches will result in fewer detected patterns, but likely of higher quality.
Touch Tolerance (%): Defines how close the High/Low needs to get to the edge of the box to be counted as a touch. A value of 2% means a touch is registered if the price comes within 2% of the box's total height from the edge.
Action Zone (%): Customizes the size of the red (resistance) and green (support) zones. A value of 30% means the top 30% of the box will be the red zone, and the bottom 30% will be the green zone.
Penunjuk Pine Script®