SilverHawk Pattern + Trend ScannerSilverHawk Pattern + Trend Scanner
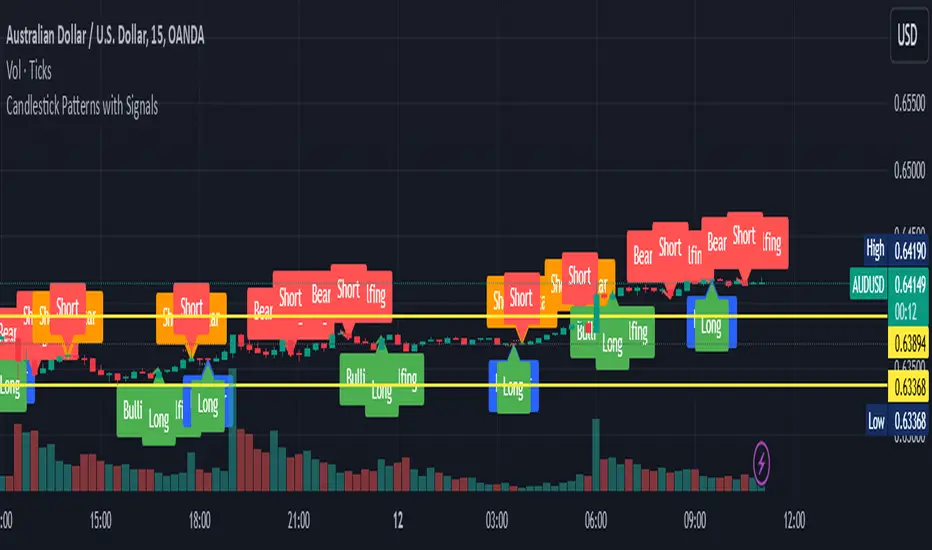
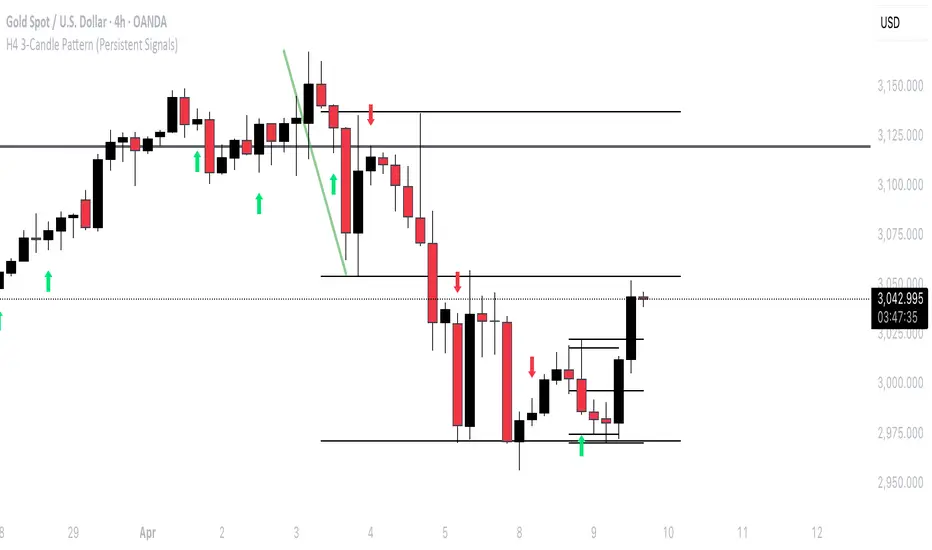
This indicator scans for common candle patterns (Evening/Morning Star, Engulfing, Kicker) and displays adaptive trend channels (short/long) with strength metrics.
Features:
- Candle patterns with reversal/continuation % heuristic
- Adaptive trend channels (best short/long length selected by Pearson R)
- ADX trend power and channel alignment note
Settings:
- Show specific patterns: toggle visibility
- Channel lengths: auto-selected based on best correlation
- Alerts on pattern detection
Best used on H1 to D1 timeframes in Forex or indices for pattern confirmation and trend analysis. Use with proper risk management and confirmation.
Educational tool only. Not financial advice. Trading involves risk.
Penunjuk Pine Script®