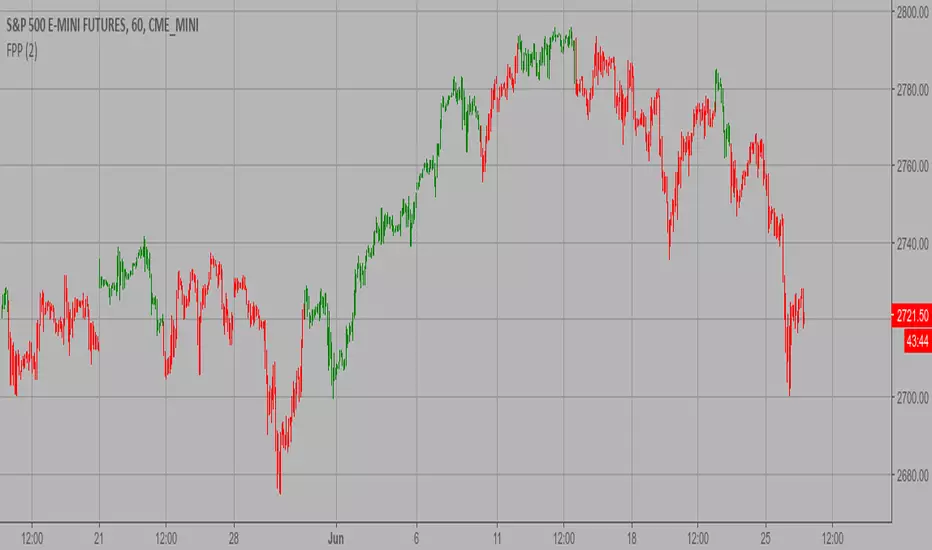
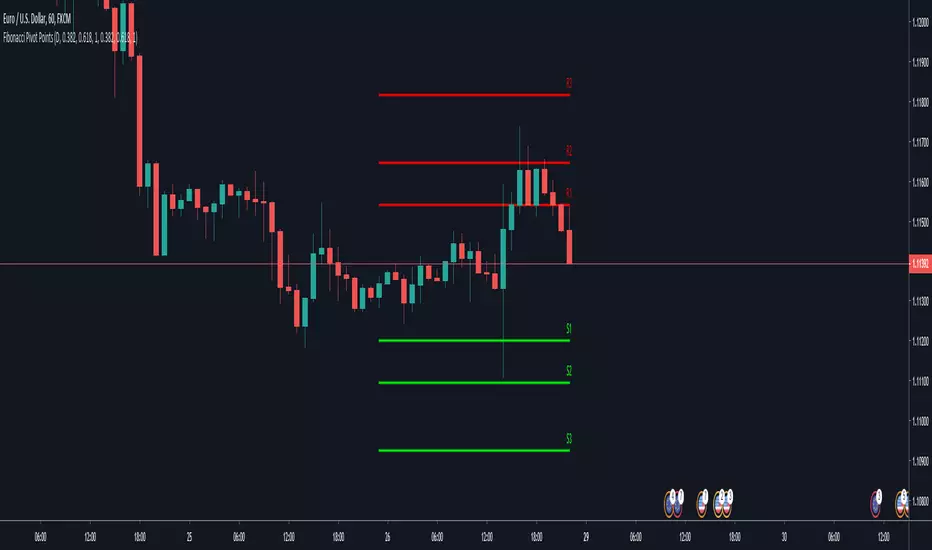
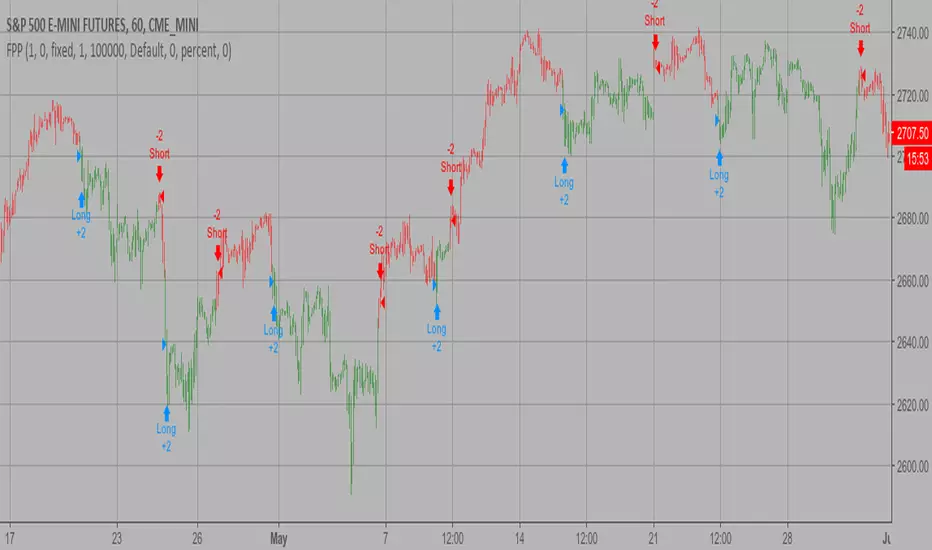
Fibonacci Pivot PointsThis is script draw Fibonacci Pivot Points.
Levels and Time Frame can be changed from the indicator settings.
Cari dalam skrip untuk "pivot points"
Simple Pivot Points with dots, not lines(manual setup)1. Why Pivot Point is popular?
Because unlike most indicators, it's not lagging! It is forward-looking, it's real-time, it's just right there.
2. Why this script is created?
I don't like many indicator lines crossing my screen everywhere, just as some Pivot Point indicators did. So I wrote this script to keep my screen as clean/neat as possible.
3. MUST READ before you add this “manual setup” version to your chart
I'm a E-mini S&P500 future trader, and I found the close prices on Daily chart is different from the ones on lower timeframe occasionally.
So I asked some TradingView staff and the reply was:
The closing price of a daily bar on TradingView is based on a Settle price from the exchange. The exchanges, at times, send this value before the close of the trading day, which leads to the situation when the price for daily-based resolutions does not change after receiving this Settle value, while the price changes still occur at smaller resolutions, since the construction of intraday bars is based on the actual trades produced.
So, in order to use the most accurate price,
I replace the D(representing the Daily timeframe) with 1440(representing 1440 minutes) in the script, making the daily Pivot Points more accurate.
The default Pivot Points are from daly timeframe.
You have to set the "last week/month close" in the "script settings" MANUALLY to ensure the weekly/monthly Pivot Point is the most accurate.
4. What if you don't want to go through the hassle of setting it up manually?
If the tickers you trade doesn't have the occasional problems as mentioned before, you can search the "Simple Pivot Points with dots, not lines(automatic setup)" version which uses the default close prices on each timeframe.
--------
If you want the dots stay a little further from your bars, you can adjust the "offset" parameter in the code. The larger the number is, the further the dot stays.
Pivot Order Blocks// How it Works \\
Order Blocks based on pivot reversal candle
When a pivot High or Pivot Low is found and confirmed, a box will be plotted on the open and close values of that pivot candle
// Settings \\
In the settings you have the ability to change the distances required to confirm an pivot High or Low
These are the lengths where the script checks to see if it is at its local high or low.
You also have the ability to change the amount of candles the box stretches over as well as the colors of the bullish and bearish boxes
// Use Case \\
Pivot points often provide Support and Resistance points on their own,
one way of marking up order blocks is by taking the pivot candle and marking that up as a resistance area where you could be looking for price to reverse
// Suggestions \\
Happy for anyone to make any suggestions on changes which could improve the script,
// Terms \\
Feel free to use the script, If you do use the script could you please just tag me as I am interested to see how people are using it. Good Luck!

Simple Pivot Points with dots, not lines(automatic setup)1. Why Pivot Point is popular
Because unlike most indicators, it's not lagging! It is forward-looking, it's real-time, it's just right there.
2. Why this script is created?
I don't like many indicator lines crossing my screen everywhere, just as some Pivot Point indicators did. So I wrote this script to keep my screen as clean/neat as possible.
3. About the other “manual setup” version.
I'm a E-mini S&P500 future trader, and I found the close prices on Daily chart is different from the ones on lower timeframe occasionally.
So I asked some TradingView staff and the reply was:
The closing price of a daily bar on TradingView is based on a Settle price from the exchange. The exchanges, at times, send this value before the close of the trading day, which leads to the situation when the price for daily-based resolutions does not change after receiving this Settle value, while the price changes still occur at smaller resolutions, since the construction of intraday bars is based on the actual trades produced.
So, if you found the same problem also occurs on your tickers, you can search the "Simple Pivot Points with dots, not lines(manually setup)" version, in which
I replace the D(representing the Daily timeframe ) with 1440(representing 1440 minutes) in the script, making the daily Pivot Points more accurate.
You can set the "last week/month close" in the "script settings" MANUALLY to ensure the weekly/monthly Pivot Point is the most accurate.
--------
If you want the dots stay a little further from your bars, you can adjust the "offset" parameter in the code. The larger the number is, the further the dot stays.

Rolling Volume Structure: HVN & SentimentTitle:
Rolling Volume Structure: HVN & Sentiment
Description:
This indicator visualizes the distribution of volume over price levels for a user-defined rolling period. It is designed to identify structural market nodes (HVN/LVN) and correlate them with Pivot Points to filter out market noise.
NOTE: This script utilizes a mathematical array binning algorithm to calculate the profile efficiently on the chart timeframe, avoiding the runtime timeouts often associated with standard iterative volume profiles.
How it works (Technical Methodology)
Binning Algorithm: The script calculates the price range (Highest High - Lowest Low) of the lookback period and divides it into a fixed number of vertical bins defined by the Resolution input.
Volume Allocation: It iterates through historical bars once. The volume of each bar is assigned to the corresponding price bin based on the bar's closing price.
Sentiment Approximation: Since tick-level Bid/Ask data is not available for historical bars in standard Pine Script strategies, this indicator estimates directional volume based on candle polarity:
If Close > Open: Volume is categorized as "Up Volume" (Buying Sentiment).
If Close < Open: Volume is categorized as "Down Volume" (Selling Sentiment).
Disclaimer: This is a standard approximation for structural analysis and does not represent true tick-data delta.
Why this Combination? (Originality & Synergy)
This script addresses the problem of validating structural levels. Traders often use Pivots and Volume Profiles separately. This script combines them programmatically to provide context:
Pivot Confluence: A Pivot Point is only plotted if it aligns with significant volume structure.
HVN Validation: A pivot occurring within a High Volume Node (HVN) suggests a high-liquidity reversal zone, whereas a pivot in a Low Volume Node (LVN) may indicate a liquidity void or a "weak" high/low.
The Dashboard summarizes these metrics (Position relative to Value Area, Net Sentiment, and Trend), removing the need for multiple separate indicators.
Educational Use for Beginners
If you are new to Volume Profile, think of the market structure in these simple terms:
Value Area (VA): This is the "Fair Price" zone where 70% of trading happened. If price is inside here, the market is balanced. If price breaks out, it may be starting a trend.
HVN (High Volume Nodes - Colored Boxes): Think of these as "Traffic Jams". Price often slows down, bounces, or gets stuck here because there are many orders. They act as Support or Resistance.
LVN (Low Volume Nodes - Gray Strips): Think of these as "Empty Highways". Because there is little volume here, price tends to move through these zones very quickly to get to the next HVN.
Features
HVN (High Volume Nodes): Colored boxes highlighting areas of high accumulation.
LVN (Low Volume Nodes): Gray strips highlighting gaps or acceleration zones.
Value Area (VA): Displays the VAH, VAL, and PoC (Point of Control).
Volume-Filtered Pivots: Plots pivots only when supported by the profile structure.
Sentiment Coloring: The profile bins are colored based on the net bullish/bearish candle volume.
Settings
Rolling Period: The lookback window size (default 150 bars).
Resolution: Precision of the profile bins (higher = more detail, lower = smoother).
HVN Thresholds: Percentage of PoC volume required to identify a node.
Global Text Size: Adjusts labels and dashboard for 4K or standard screens.
Credits: The core binning logic is adapted from generic open-source array management concepts for custom volume profiles.

HTF EMA Pivot PointsHTF EMA Pivot Points - TradingView Indicator
📌 Overview
The HTF EMA Pivot Points indicator displays Exponential Moving Averages (EMAs) from higher timeframes (HTF) on your current chart. These EMAs act as dynamic support and resistance levels, helping traders identify key areas where price is likely to react.
⚡ Key Features
✅ Plots EMAs from multiple timeframes (1H, 4H, Daily)
✅ Works on any chart (1M, 5M, 15M, etc.)
✅ Acts as pivot points for price action, helping with trade entries & exits
✅ Customizable EMA lengths for flexibility
✅ Ideal for scalping, 0DTE options trading, and swing trading
🛠 How It Works
The script calculates EMAs from 1H, 4H, and Daily charts and overlays them on your current timeframe. These levels often act as support and resistance zones, where price tends to bounce or reject.
🎯 How to Use It for Trading
📍 Bullish Setup (Buy Calls)
• Price bounces off a higher timeframe EMA (e.g., 4H or Daily EMA)
• Confirmation with RSI or Fair Value Gaps (FVGs)
📍 Bearish Setup (Buy Puts)
• Price rejects from a higher timeframe EMA
• Confirmation with other indicators (RSI, MACD, Order Flow)
🚀 Why Use This Indicator?
• Filters out noise from lower timeframe EMAs
• Confirms trend direction using key moving averages
• Helps avoid false breakouts by identifying strong institutional levels
This is a must-have tool for traders who rely on higher timeframe confluence for scalping, options trading, or swing trading. 📈🔥

Support & Resistance Trendlines with PP + Fib. Channel█ Support & Resistance Trendlines with Pivot Points + Fibonacci Channel
This script automatically draw support and resistance trend lines based on pivot points and add a fibonacci channel.
It will show potential patterns with the help of support and resistance lines as well as breakout target and pullback entry with the fibonacci extension and retracement levels.
It is based on atolelole's script, I only made it more configurable so please check out his script.
I added the possibility to change values and add additional retracement and extension levels.
I also made it customizable with the possibility to change lines color, width and style.

20 Camarilla Pivot PointsThis indicator plots 20 Camarilla pivot points above and below the pivot based on the selected time frame. This is useful when price goes between the standard 3 and 4 pivots and above 4. Note that the normal 4 pivot point is labeled as 6 in this indicator. You can change the color of each set of pivots so you can mark the standard Camarilla pivots if you wish. The image is using monthly Camarilla pivots on a 1 hour time frame.
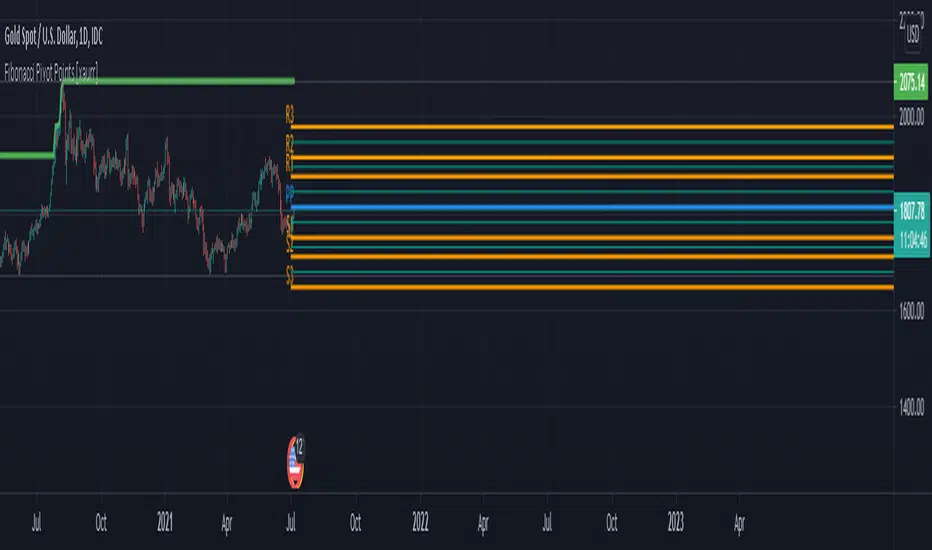
Fibonacci Pivot Points [xaurr]This script is the enhanced version of my previous script Ath Atl Fibonacci Pivot Points
It has standart fibonacci pivot points with auto time frame, you can also choose custom time frame too.
Good Luck!
Multi-Timeframe Pivot PointsThis is a MTF pivot point indicator. I was unhappy with the standard pivot point indicator in Trading View as I wanted to be aware of how price was interacting with pivot points on a higher timeframe. For example, if I'm on the 1H time frame looking at daily pivots, I want to be sure that my trading plan to move between these pivots does not contradict what price is trying to do in relation to the weekly pivots. In addition, sometimes daily and weekly pivots will align increasing probability of a bounce
Ultimately its about trying to automate as much as possible to quickly have an awareness of what might be happening on the timeframe above without having to manual enter levels.
I concluded I don't like the results of this script - whilst i clearly see price interacting with pivots on the current timeframe and higher timeframes there is too much screen clutter on the screen for me.
Rather than delete the script I thought I'd make it available for other people to use. I hope its useful to people. Good luck
(For the record it actually takes a little thinking outside the box to make so many pivots display - you can't just plot hlines. If your a pinescript geek you might like the code)
Murrey Math Lines with extreme compartor and pivot pointsI did combine 3 scripts into one that really shows a lot. This is to bring together other good ideas to show improve on others work. Special thanks to pipcharlie for the murrey math lines Mage3 for the pivot points and morpheous747 for the murrey extreme compartor.
// this script shows sveral things.
//1. Breakouts - multiple diamonds and price staying in the outer murrey bands is a strong trend. This will lead to a double top or bottom. You could also buy/sell
// the pullbacks and expext another diamond.
//2. Tops - 2 pivots in the top murrey bands first top must have a diamond second must be in the top murrey zone or a higher murrey outer band without a diamond.
// There also must have a dip between tops outside the top murrey zone.
//3. bottoms bounces - a quick pull back if there are 2 pivots close together and the second pivot is not a diamond.
//4. double bottoms - 2 pivots with the first pivot a diamond. The second is after a pullback out of the bottom murrey zone and a diamond.
//5. pullbacks - red and green lines. These are a little more benificial for tops/bottoms
//6. Overall trends - the triangles on top or bottoms show overall general trend. Also the murrey bands act like bollinger bands, once trend changes, expect targets
// to hit the opposite band.
//7. Pivots - adding pivots and extentions help determine trends, resistance levels and tops/bottoms\
//8. Volitility - the wider the murry bands the more movement is likely and ususally in trend with stronger pullbacks. The smaller the bands smaller moves and more
// up and down movement

Fibonacci Pivot Points UltimateA better version of the Fibonacci Pivot Points . I added 100, 138, 161 and 200 support/resistance pivots , lookback function and now you can use daily/weekly/monthly/yearly fibonacci pivot points .

Tomorrow's Pivot Points [SMH]這個TradingView指標不同於內置的Pivot Point指標,因為它能夠提前顯示明天的Pivot Point。透過預測下一交易日的支撐與阻力位置,交易員可以更早部署策略,為隔日的市場波動做好準備。
This TradingView indicator is different from the built-in Pivot Point tool because it can display tomorrow’s Pivot Points in advance. By forecasting support and resistance levels for the next trading day, traders can position their strategies earlier and be well-prepared for upcoming market movements.

Modified - Pivot Points Standard with Daily H/L/CThis indicator plots Pivot Points Standard with six calculation methods (Traditional, Fibonacci, Woodie, Classic, DM, Camarilla) and flexible anchors (Auto/D/W/M/Q/Y and multi-year). You can restrict pivots to the current day/week/month, choose daily-based data (uses higher-timeframe OHLC; futures use settlement close) or intraday aggregation, and independently style pivots versus previous-period lines with solid/dashed/dotted types and custom widths. Per-level colors are provided (PP/R/S), with R4/R5 and S4/S5 off by default, plus optional labels showing prices positioned left or right. It also draws the previous Day/Week/Month High, Low, and Close across the current period using completed higher-timeframe values (lookahead_off with ), ensuring they always reflect the prior session/period. Rendering is optimized by limiting historical pivot sets and auto-cleaning old lines for smooth performance on any timeframe.

Bitcoin as Heikin Ashi Candles with Pivot PointsI use this Indicator to show me where Bitcoin is heading.
Most pine programmers are not aware of the possibility to combine Heikin Ashi Candles with Pivot Points that easy.
You can switch between Traditional, Fibonacci, Woodie, Classic, DM, and Camarilla as usual.
When on a Intraday Chart it will automaticly calculate daily Pivots for Haikin Ashi candles.
On the daily Chart it will calculate weekly Pivots, and when switching to monthly candles it will calculate Pivots for one year.
There is also an option where you can deactivate all support and resistance lines, except for today. Meaning you will see the Central Pivot Point on all previous days only.
This is a lagging indicator!
When you can see Altcoin correlation with BTC then both might get pretty strong leading indicators.
I am pleased to hear some advice/wishes to improve this script.
It is still in the beginning and some updates will follow, I promise.
Happy Trading!

Camarilla Pivot Points L3/4 D/W with Labels AlertsThis version of the camarilla pivot points will provide daily or weekly S3, S4, R3 and R4 Levels.
This release is intended to help you declutter your charts by not having too many lines but still getting the benefit of clearly seeing where the key camarilla levels are, which can help with identifying market structure and potential market extremes.
It has the option to show or hide the lines to help unclutter your charts.
The lines can also be hidden by the user line transparency input, in which case the values will still appear on the scale.
It comes with a cross label for each pivot point that can be offset horizontally by user input. Per the screenshot, the intention is to have these labels adjacent to the right axis to clearly idenfity the pivot levels.
It also has alerts for each pivot point level
Rolling Pivot PointsThe "Rolling Pivot Points" indicator, built in Pine Script (version 6) for TradingView, overlays dynamic pivot levels on a price chart. It calculates a 24-hour lookback period (length = 1440 / (timeframe.in_seconds() / 60)) using the prior period’s high, low, and close to determine a Pivot Point (vPP) and three resistance (vR1, vR2, vR3) and support (vS1, vS2, vS3) levels. Plotted lines include vPP (yellow), vR1 (red), and vS1 (blue) in a cross style, with a customizable reset time (default: 8 AM) to refresh levels daily.
The indicator updates at the specified resetTime (minute = 0), otherwise retaining prior levels, making it ideal for intraday traders. The averageDays input (default: 5) is present but unclear in function. Suited for identifying key price zones, it adapts across timeframes, offering a concise, color-coded tool for technical analysis on TradingView.

Quarterly Pivot PointsQuarterly Pivot Points PP,R1,S1(Pivot levels calculated for Quarterly High/Low/close)
useful for mid term investors who is expecting a break out on quarterly pivot levels.

Combo Backtest 123 Reversal & Floor Pivot Points This is combo strategies for get a cumulative signal.
First strategy
This System was created from the Book "How I Tripled My Money In The
Futures Market" by Ulf Jensen, Page 183. This is reverse type of strategies.
The strategy buys at market, if close price is higher than the previous close
during 2 days and the meaning of 9-days Stochastic Slow Oscillator is lower than 50.
The strategy sells at market, if close price is lower than the previous close price
during 2 days and the meaning of 9-days Stochastic Fast Oscillator is higher than 50.
Second strategy
The name ‘Floor-Trader Pivot,’ came from the fact that Pivot points can
be calculated quickly, on the fly using price data from the previous day
as an input. Although time-frames of less than a day can be used, Pivots are
commonly plotted on the Daily Chart; using price data from the previous day’s
trading activity.
WARNING:
- For purpose educate only
- This script to change bars colors.

Combo Strategy 123 Reversal & Floor Pivot Points This is combo strategies for get a cumulative signal.
First strategy
This System was created from the Book "How I Tripled My Money In The
Futures Market" by Ulf Jensen, Page 183. This is reverse type of strategies.
The strategy buys at market, if close price is higher than the previous close
during 2 days and the meaning of 9-days Stochastic Slow Oscillator is lower than 50.
The strategy sells at market, if close price is lower than the previous close price
during 2 days and the meaning of 9-days Stochastic Fast Oscillator is higher than 50.
Second strategy
The name ‘Floor-Trader Pivot,’ came from the fact that Pivot points can
be calculated quickly, on the fly using price data from the previous day
as an input. Although time-frames of less than a day can be used, Pivots are
commonly plotted on the Daily Chart; using price data from the previous day’s
trading activity.
WARNING:
- For purpose educate only
- This script to change bars colors.

QuantNomad - Ultimate Pivot Points AlertsCreated a universal script for pivot points alerts.
In the script, you can choose one of 4 pivot point types: Traditional, Fibonacci, Woodie, and Camarilla.
You are able to create separate alerts for every level or create one for price crossing any level.
For separate levels, you can choose: "Cross", "Crossover" and "Crossunder".
You can also choose to show/hide:
Historical Levels
Levels Values
Current Levels - Levels calculated on the current period, on close of the period they will become valid levels for next periods. These levels do not participate in alerts calculations.
Because of some TradingView limitations, alerts won't be fired for the first bar of the session.
In the script used new v4 plotting features, so will be able to plot levels and labels nicely. Unfortunately, there is a limit on the number of consecutive lines you can plot on the plot (around 50), so historical lines in the past will disappear after 6-7 periods.
And remember:
Past performance does not guarantee future results.
Floor Pivot Points Backtest The name ‘Floor-Trader Pivot,’ came from the fact that Pivot points can
be calculated quickly, on the fly using price data from the previous day
as an input. Although time-frames of less than a day can be used, Pivots are
commonly plotted on the Daily Chart; using price data from the previous day’s
trading activity.
You can change long to short in the Input Settings
WARNING:
- For purpose educate only
- This script to change bars colors.
Floor Pivot Points Strategy The name ‘Floor-Trader Pivot,’ came from the fact that Pivot points can
be calculated quickly, on the fly using price data from the previous day
as an input. Although time-frames of less than a day can be used, Pivots are
commonly plotted on the Daily Chart; using price data from the previous day’s
trading activity.
WARNING:
- This script to change bars colors.