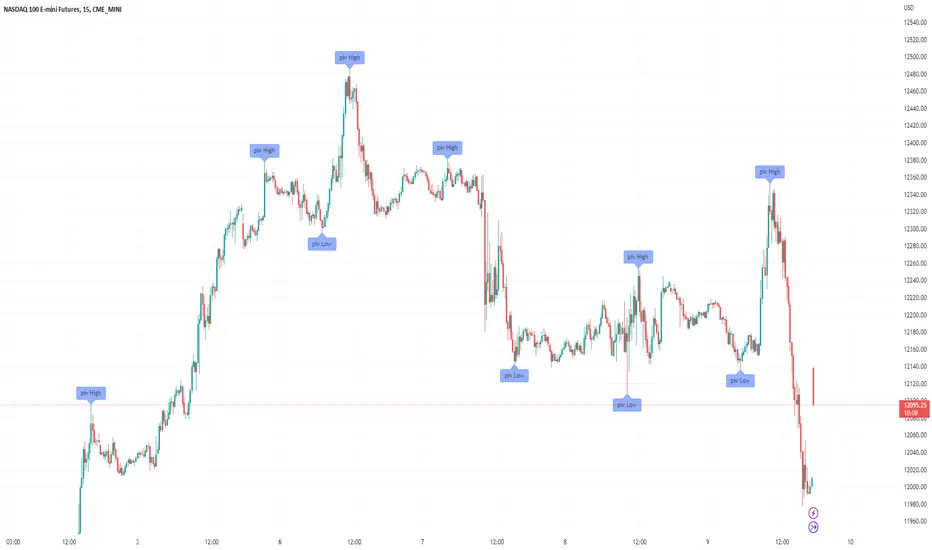
Polygonal Pivot Bands [FXSMARTLAB]The Polygonal Pivot Bands highlights key price pivots, dynamic support and resistance levels, and recent price action on a trading chart. This indicator connects pivot highs and lows with a zigzag line, extends a real-time dashed line to the latest price point, and plots diagonal support/resistance levels that adapt to price movement. These elements together provide traders with a view of significant price zones and potential trend shifts.
Key Components of the Indicator
Pivots are calculated based on user-defined lengths, specifying how many bars on either side of a high or low are required to validate it as a pivot.
Adjustable left and right pivot lengths allow traders to control the sensitivity of pivot detection, with higher values resulting in fewer, more prominent pivots, and lower values increasing sensitivity to price changes.
Zigzag Line
The zigzag line connects consecutive pivot points, filtering out smaller fluctuations and emphasizing the broader direction of price movement.
Users can customize the line's color and thickness to match their preferences, helping them focus on larger trends and potential reversal points.
By linking pivot highs and lows, the zigzag pattern highlights the overall trend and potential points of reversal.
Real-Time Connector Line
A dashed line extends from the last confirmed pivot to the latest price point, providing a real-time, bar-by-bar update of the current price relative to the previous pivot.
This line does not project future price direction but maintains an up-to-date connection with the current price, showing the distance from the last pivot.
Its color and thickness are customizable for improved visibility on the chart.
Dynamic Support and Resistance Levels
The indicator plots dynamic support and resistanc e levels by connecting recent pivot highs and lows, resulting in lines that may appear diagonal rather than strictly horizontal.
These levels move in line with price action, adapting to the natural direction of trends, and offer visual cues where price may encounter support or resistance.
Colors and thickness of these lines can be set individually, allowing traders to adjust visibility according to their preferences.
Enabling these lines gives traders an ongoing reference for critical price boundaries that align more closely with the overall trend.
Cari dalam skrip untuk "pivot"

Hurst Diamond Notation PivotsThis is a fairly simple indicator for diamond notation of past hi/lo pivot points, a common method in Hurst analysis. The diamonds mark the troughs/peaks of each cycle. They are offset by their lookback and thus will not 'paint' until after they happen so anticipate accordingly. Practically, traders can use the average length of past pivot periods to forecast future pivot periods in time🔮. For example, if the average/dominant number of bars in an 80-bar pivot point period/cycle is 76, then a trader might forecast that the next pivot could occur 76-ish bars after the last confirmed pivot. The numbers/labels on the y-axis display the cycle length used for pivot detection. This indicator doesn't repaint, but it has a lot of lag; Please use it for forecasting instead of entry signals. This indicator scans for new pivots in the form of a rainbow line and circle; once the hi/lo has happened and the lookback has passed then the pivot will be plotted. The rainbow color per wavelength theme seems to be authentic to Hurst (or modern Hurst software) and has been included as a default.

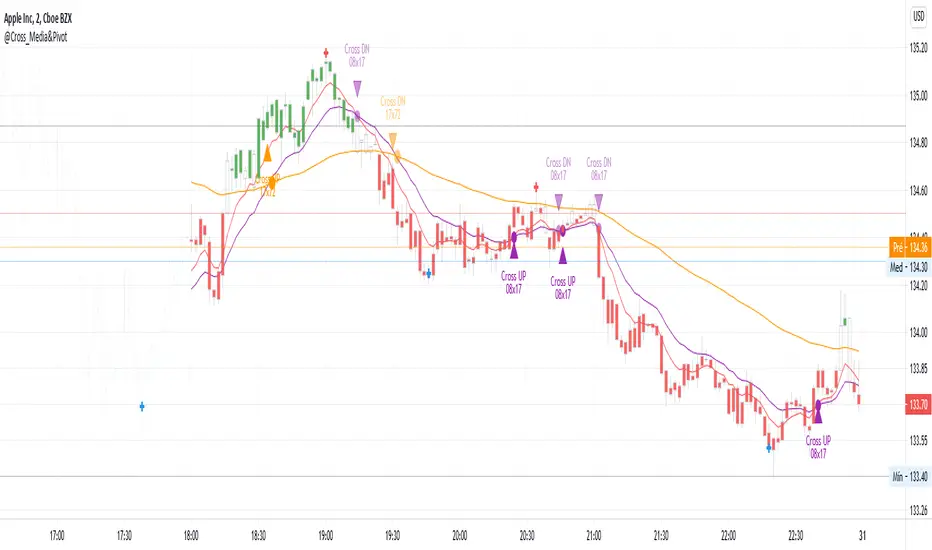
@Cross_Media&Pivot&TRADE_Entry_and_ExitThis script uses the functions plot(), cross(), plotcandle(), pivothigh() and pivotllow(). You can see the candles in the color green, above EMA 72 (Exponetional Move Average), and the color red, below EMA72. You can identify the position of the crossing UP and DOWN of the EMA 08 x EMA 17, EMA 17 x EMA72. You can identify the TRADE ENTRY points with the pivot high and TRADE EXIT with the pivot Low.
Momentum and Trend Strength Entry Exit Pivot StudyUpdated version of previous Momentum Strength Entry Exit Pivot Study:
//************************
// @TheGeeBee - Credit where used
//
//Notes:
//
// Use 1,2,3,5 minute timeframes
// EMA Cross line and offset allows user to alter the sell characteristics where the candle low is above the EMA line and indicates a possible pre-pivot reversal
// Adjust Min and Max pivots based on risk profile
// Single Candle drawdown value represents the maximum size of a single red candle before an Exit Pivot is generated
// ADX Threshold inhibits Pivots when trending signal is below the threshold value
// Percentage Max drawdown since Entry Pivot allows the system to generate an Exit Pivot if the security has dropped X percent from the most recent Entry Pivot point
// Use Bars, Candles (preferred) or Heikin-Ashi
// Multiple Green Bars = BTFD
// Multiple Red bars = If you didn't already get out, do it now!
//
//************************
Allows for Alerts to be set for Entry and Exit Pivots.
Volumetric Pivot Echo🔮 Volumetric Pivot Echo (VPE)
Future Price Projection Zones with Confidence Scoring
📘 Overview
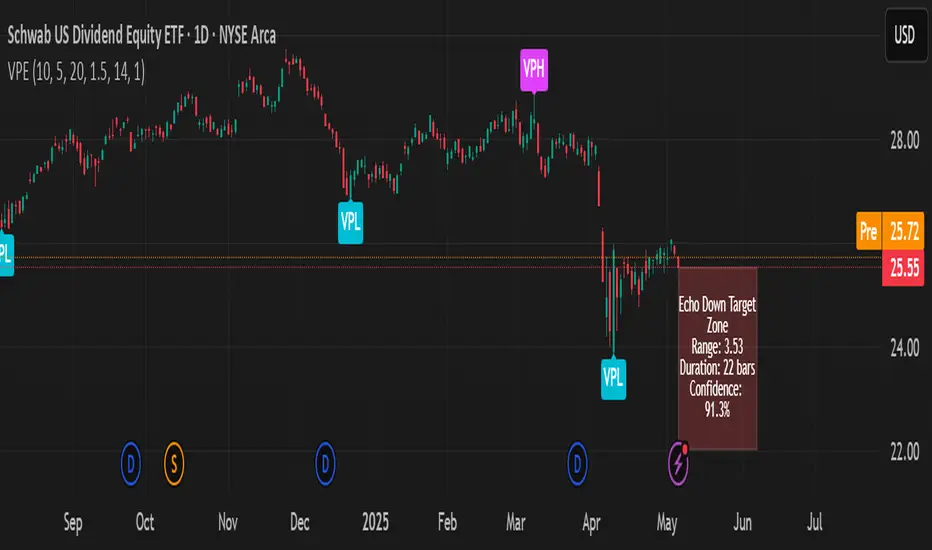
The Volumetric Pivot Echo (VPE) is a next-generation leading indicator that identifies high-volume reversal points and echoes their price + time behavior into the future — giving you a visual forecast box that includes a confidence score, price range, and duration estimate.
It’s designed for swing and options traders who want forward guidance based on real structure, not just reactive signals.
⚙️ How It Works
Pivot Detection – Finds pivot highs/lows based on configurable bar structure.
Volume Confirmation – Only confirms pivots backed by strong volume (e.g., 1.5× average).
Echo Logic – Measures the price move and time it took to reach the pivot.
ATR Scaling – Adjusts projections based on current market volatility.
Confidence Score – Rates each projection (0–100%) based on structure match, volatility, and direction alignment.
📦 What Appears on Chart
Projection Box:
A forward-drawn rectangle from the current bar to the estimated future zone. The box's size and duration mirror the last valid momentum leg.
Box Label Text:
🔹 Range (projected move size)
⏱️ Duration (bars expected)
✅ Confidence %
VPH/VPL Markers:
Pivot highs and lows confirmed by volume, marked with “VPH” or “VPL”.
🎯 How to Trade with It
Use the box as a target zone for directional trades.
If price enters a box with >85% confidence, consider it a high-quality path projection.
Use with support/resistance confluence or entry systems.
Works especially well for swing trading, breakout setups, or options targeting.
🛠️ Recommended Settings
Box Transparency: Set Projection Up/Down Color to 90 (10% visible).
Text Color: Set to white for readability.
Volume Multiplier: Default 1.5x, increase in choppy markets.
Projection Duration: Start with 1.0x echo multiplier and fine-tune.
⏳ Timeframes & Accuracy
Timeframe Confidence Zones Most Reliable
15m – 1h Use 70–85% confidence scores
1h – 4h Sweet spot for balanced signals
1D – 1W Strongest historical echo tracking (>85% ideal)
✅ Key Features
Forward-looking, non-repainting logic
Clear visual projections — no guesswork
Confidence scoring built-in
ATR-adjusted — adapts to volatility
Works on any asset (stocks, crypto, FX)
🧠 Why It’s Unique
This is not a lagging oscillator or classic trend-following tool.
It’s a leading structure projection model — combining pivot behavior, volume intensity, and market volatility to sketch forward “echo zones” based on the past.
Multi Range VWAP PivotsMulti Range VWAP Pivots turned out to be one of my most accurate pivot indicators to date!
Multi Range VWAP Pivots works by recognizing the high and low of the timeframe selected (D, W, M, 6M, and 12M) and plotting range high to VWAP averages and range low to VWAP averages.
After further examination of each completed range, I came to the conclusion that due to the nature of averages, high and low respectively would need to be completed within the current range, for the averages to actually display pivots correctly. This means that if all averages appear to be "pivoting" correctly after or during a break lower of higher, then we can only assume the most recent break higher or lower could be exhaustion and price will be reverted to the mean (VWAP). OR, this could be the most accurate hindsight indicator on the planet.
*DISCLAIMER*: This indicator repaints. DO NOT backtest or set alerts with this indicator.

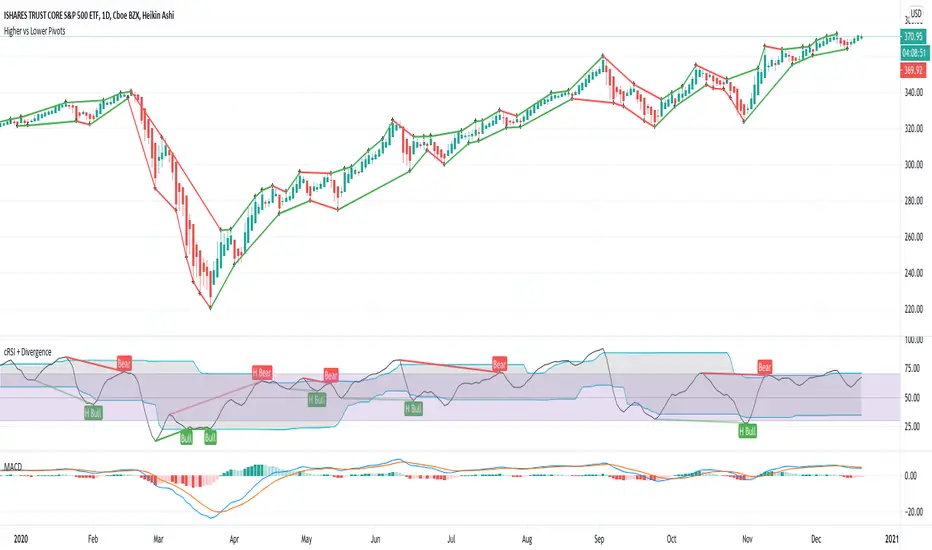
Higher vs Lower Pivots overlayA simple script that I made that draws lines between the high and low pivots. The color of the line define if the pivot is higher or lower than the previous pivot. The main thing to tune is the pivot look back vs look ahead, which are the same params used by the tradingview pivot indicator. There are several other params you can tweaks to get the look you want.
Filter-Out Weak Pivot highs/lows, Swing highs/lows: MethodJust a simple indicator for refining the standard method of finding Pivot highs & Lows; Allowing user to filter-out weak/flat/rounded Pivot highs/lows
-Aim of this is to get pivot highs & pivot lows coded to print more in line with what the eye would naturally be drawn to as an obvious pivot high/low.
-This uses local moving average around the pivot high/low together with user-input ATR multiple, to create a condition for filtering out lacklustre pivot highs/lows.
-Thought i'd publish this separately as a tool that other coders might find useful.
//inputs//
~adjust looback/lookforward for Pivot highs/lows
~adjust 'spikiness' index to filter out less impressive pivot highs/lows (higher number = more selective)
Fibonacci Pivots: last days trade or user defined by irenabyssThis takes the high, low and close from day prior OR Allows the user to set a high, low and close then plots the fibonacci pivot points for the current days trading.
Recommended to use intraday (I use 5 min chart).

Kozlod - Pivot Reversal Strategy Alerts V2Its' new version of previously published Kozlod - Pivot Reversal Strategy Alerts
Indicator now better correspond to original strategy. However, there can be some differences. Problem is that it's pretty tricky to implement in plain PineScript same "stop" logic used in strategy.entry of the original script

30 Min Pivot Enhanced# 30 Min Pivot Enhanced
The **30 Min Pivot Enhanced** indicator detects pivot reversals and potential buy/sell signals on the 30-minute timeframe. It combines streak-based trend exhaustion with pivot breakouts and optional flush (capitulation) candle detection.
## Core Logic
- Trend streaks: pivots form after consecutive same-color candles (`trendLength`)
- Flush detection: oversized red candles (ATR based) flagged as potential exhaustion
- Pivot candidates:
- Bullish → after a red streak (or flush) followed by a green candle
- Bearish → after a green streak followed by a red candle
- Confirmation: price must break pivot high/low within `maxBarsAfterPivot`
## Inputs
- Consecutive Trend Candles → streak length required for pivot
- Maximum Bars After Pivot → confirmation window
- Show Pivot Lines → toggle pivot levels on chart
- Flush Detection → ATR-based capitulation detection
- Flush Lookback → how many bars to keep flush valid
- Enable Buy/Sell Alerts → toggle trade alerts
## Visuals
- Buy pivots → green "P Buy" labels under price
- Sell pivots → red pivot lines at lows (if enabled)
- Flush markers → optional debug labels showing capitulation bars
## Alerts
- Buy Alert → price breaks above pivot high
- Sell Alert → price breaks below pivot low
---
Best for traders watching **30-minute reversal plays**, especially where exhaustion or flush candles precede a breakout.

Trendline Pivots [QuantVue]Trendline Pivots
The Trend Line Pivot Indicator works by automatically drawing and recognizing downward trendlines originating from and connecting pivot highs or upward trendlines originating from and connecting pivot lows.
These trendlines serve as reference points of potential resistance and support within the market.
Once identified, the trend line will continue to be drawn and progress with price until one of two conditions is met: either the price closes(default setting) above or below the trend line, or the line reaches a user-defined maximum length.
If the price closes(default setting) above a down trend line or below an up trend line, an "x" is displayed, indicating the resistance or support has been broken. At the same time, the trend line transforms into a dashed format, enabling clear differentiation from active non-breached trend lines.
This indicator is fully customizable from line colors, pivot length, the number lines you wish to see on your chart and works on any time frame and any market.
Don't hesitate to reach out with any questions or concerns.
We hope you enjoy!
Cheers.

Unraided Liquidity and S/R PivotsThis indicator is designed to show key pivot points, also known as levels, which could provide good trade entries.
Utilising liquidity concepts, untested pivot levels can be a good place to enter a trade after the pivot is tested, liquidity is taken and the direction reverses.
Alternatively, utilising the option of viewing already tested levels, you can easily see the key support and resistance areas that price is likely to have a strong reaction to, whether it wants to go toward or bounce away from these levels.
The indicator does not give buy and sell signals, it is up to you to use the levels to form your trading plan.
Oorah.

3EMA + Boullinger + PIVOTTRES EMAS + BANDAS DE BOLLINGER + PIVOTE
INDICADOR 1: TRES EMAS (MEDIA MOVIL EXPONENCIAL)
Con este indicador puede visualizar el promedio de precios con mayor peso a los datos mas recientes.
Se calculan y dibujan tres medias móviles exponenciales: 8, 20 y 200 últimas velas.
-Rápida EMA1 = 8
-Media EMA2 = 20
-Lenta EMA 3 = 200
INDICADOR 2: BANDAS DE BOLLINGER
Con este indicador podrá ver la fuerza y la tendencia del mercado, es decir la mide la volatilidad del precio del activo.
Si el precio sobrepasa la banda superior, el activo está sobrecomprado.
Si el precio sobrepasa la banda inferior, el activo está sobrevendido.
Longitud tendencia - BASE = 20, paso = 1
Desviación Estándar - Multiplicador = 2, paso = 0.2
INDICADOR 3: PIVOTE
Este indicador etiqueta los puntos donde el precio es mínimo y máximo, en un rango de velas determinado en el parámetro "Distancia para el Pivote".
Estos 3 indicadores sirven para todo tipo de activos: FOREX, CRIPTO, CFD´s, ETC.
------------------------------------------------------------------------------------------------------------------
THREE EMAS + BOLLINGER BANDS + PIVOT
INDICATOR 1: THREE EMAS ( EXPONENTIAL MOVING AVERAGE )
With this indicator you can visualize the average of prices with greater weight to the most recent data.
Three exponential moving averages are calculated and drawn: 4, 20 and 200 last candles.
-Fast EMA1 = 8
-Average EMA2 = 20
-Slow EMA 3 = 200
INDICATOR 2: BOLLINGER BANDS
With this indicator you can see the strength and trend of the market, that is, it is measured by the volatility of the asset price.
If the price goes above the upper band, the asset is overbought.
If the price goes above the lower band, the asset is oversold.
Trend length - BASE = 20, step = 1
Standard Deviation - Multiplier = 2, step = 0.2
INDICATOR 3: PIVOT
This indicator labels the points where the price is minimum and maximum, in a range of candles determined in the parameter "Distance to Pivot".
These 3 indicators are used for all types of assets: FOREX, CRYPT, CFD's, ETC.

RSI Centered PivotsJust a simple RSI central pivot strategy I made for a friend.
Backtested on BYBIT:BTCUSD, 155m.
DISCLAIMER : Please do your own research into anything you use before using it to trade.

Phoenix085-Studies-PerCentage Current Price ((fib-pivot-%))Misc Details :
Another Indicator and Totally my own concept...
If others have similar study already then Credit to them for coming up with this even before I did but this is just me fiddling with pinescript trying to paint my dream like a great man once said...
Background :
I am a strong believer of Market being Fractals and what best way to script it than Pivots.
So I just wanted to identify the Pivot High and Pivot Low of some period(in the script it is set to 500, please do play with it to get the best setting which captures atleast the major highs and lows of recent past)
I also think that Fibonacci levels are very crucial and so wanted to see how the market reacts at the Fibonacci ratios from Pivot High and Low.
Overview :
As said above the price at Pivot Low is considered as 0% on the graph and Value at Pivot High as the 100%.
Depending on the CMP, the thick white line is plotted...
The main thing of interest here is the Horizontal lines are Fib Levels and the market kinda reacts around those levels as the buyers and sellers have to come to equilibrium...
A price retracing from the 100% level just means Double Top = Sell(Probable) and a bounce from the 0% just means a double bottom = Buy(Probable)....
Also this indicator along with my other Public indicator() might give a better understanding of the price actions (I Hope)...
This is free to use and share with as many as you like...
Credits:
All the great people who have greatly influenced and still continue to do so...
@JustUncleL
@BigBitsIO
@TheArtofTrading
@QuantNomad
@SquigglesNiggles and many many many more

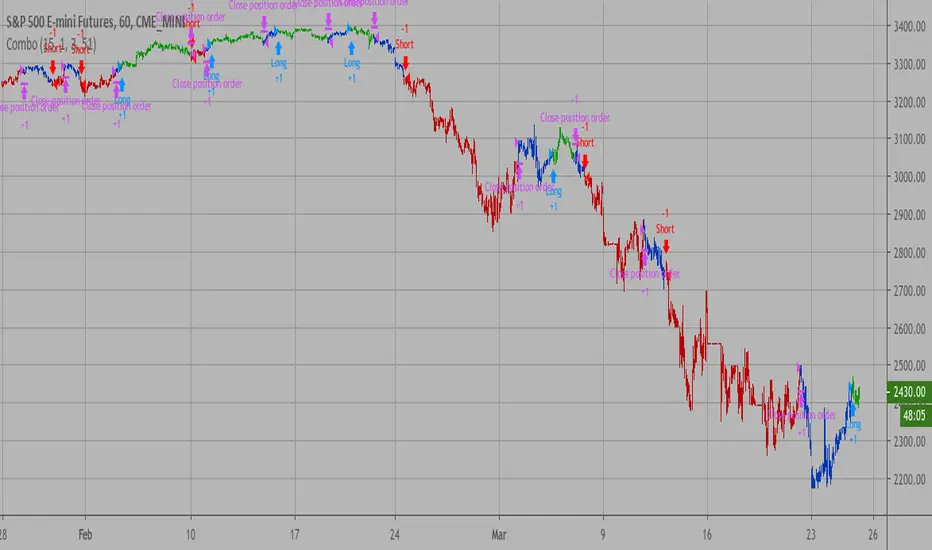
Combo Backtest 123 Reversal & Dynamic Pivot Point This is combo strategies for get a cumulative signal.
First strategy
This System was created from the Book "How I Tripled My Money In The
Futures Market" by Ulf Jensen, Page 183. This is reverse type of strategies.
The strategy buys at market, if close price is higher than the previous close
during 2 days and the meaning of 9-days Stochastic Slow Oscillator is lower than 50.
The strategy sells at market, if close price is lower than the previous close price
during 2 days and the meaning of 9-days Stochastic Fast Oscillator is higher than 50.
Second strategy
This Pivot points is calculated on the current day.
Pivot points simply took the high, low, and closing price from the previous period and
divided by 3 to find the pivot. From this pivot, traders would then base their
calculations for three support, and three resistance levels. The calculation for the most
basic flavor of pivot points, known as ‘floor-trader pivots’, along with their support and
resistance levels.
WARNING:
- For purpose educate only
- This script to change bars colors.
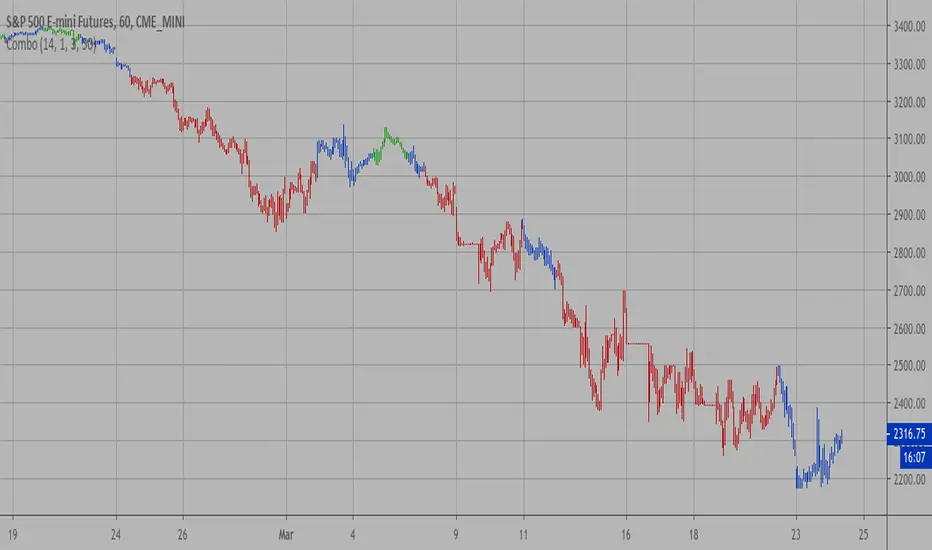
Combo Strategy 123 Reversal & Dynamic Pivot Point This is combo strategies for get a cumulative signal.
First strategy
This System was created from the Book "How I Tripled My Money In The
Futures Market" by Ulf Jensen, Page 183. This is reverse type of strategies.
The strategy buys at market, if close price is higher than the previous close
during 2 days and the meaning of 9-days Stochastic Slow Oscillator is lower than 50.
The strategy sells at market, if close price is lower than the previous close price
during 2 days and the meaning of 9-days Stochastic Fast Oscillator is higher than 50.
Second strategy
This Pivot points is calculated on the current day.
Pivot points simply took the high, low, and closing price from the previous period and
divided by 3 to find the pivot. From this pivot, traders would then base their
calculations for three support, and three resistance levels. The calculation for the most
basic flavor of pivot points, known as ‘floor-trader pivots’, along with their support and
resistance levels.
WARNING:
- For purpose educate only
- This script to change bars colors.
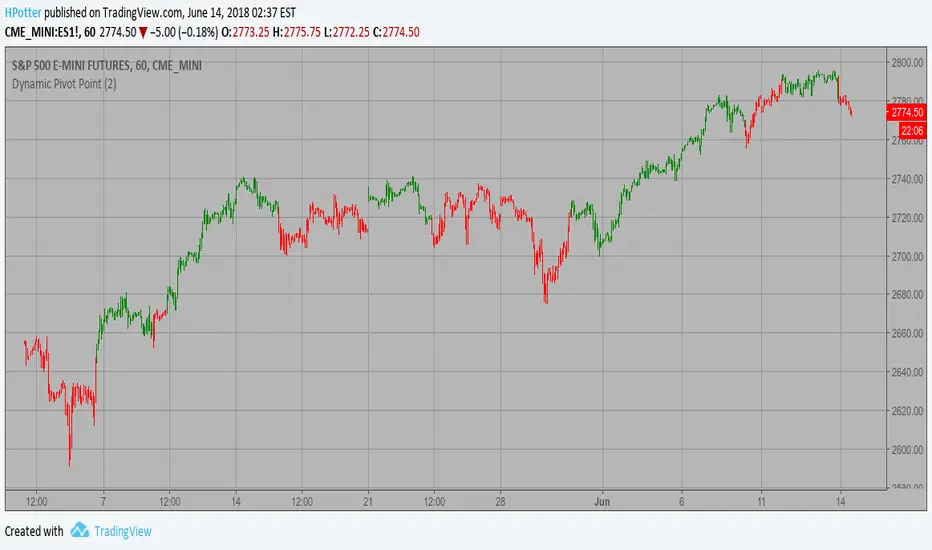
Dynamic Pivot Point Strategy This Pivot points is calculated on the current day.
Pivot points simply took the high, low, and closing price from the previous period and
divided by 3 to find the pivot. From this pivot, traders would then base their
calculations for three support, and three resistance levels. The calculation for the most
basic flavor of pivot points, known as ‘floor-trader pivots’, along with their support and
resistance levels.
WARNING:
- This script to change bars colors.
Hash Pivot DetectorHash Pivot Detector
Professional Support & Resistance Detection with Multi-Timeframe Zone Analysis
Developed by Hash Capital Research, the Hash Pivot Detector is a sophisticated indicator designed for identifying key support and resistance levels using pivot-based detection with institutional-grade zone analysis.
Key Features
Zone-Based Detection
Unlike traditional single-line S/R indicators, Hash Pivot Detector uses configurable zones around pivot levels to represent realistic institutional order areas. Adjustable zone width accommodates different asset volatilities.
Multi-Timeframe Analysis
Displays higher timeframe support/resistance levels alongside current timeframe pivots, providing crucial context for institutional positioning and stronger price barriers.
Clean Visual Design
Features Hash Capital's signature fluorescent color scheme (pink resistance, cyan support) optimized for dark charts with high contrast and instant visual recognition. Semi-transparent zones keep your chart clean and readable.
How It Works
The indicator uses pivot high/low detection with configurable left and right bar parameters. When a pivot is confirmed, it plots:
Primary support/resistance lines at pivot levels
Semi-transparent zones representing realistic order areas
Higher timeframe S/R levels as crosses for additional context
Recommended Settings
For Swing Trading:
Pivot Bars: 10-20 left/right
Zone Width: 0.5-1.0%
HTF: Daily (on 1H-4H charts)
For Intraday Trading:
Pivot Bars: 5-10 left/right
Zone Width: 0.3-0.5%
HTF: 1H or 4H (on 5min-15min charts)
Asset-Specific Zone Width:
Forex/Crypto: 0.3-0.5%
Stocks: 0.5-1.0%
Volatile Assets: 1.0-2.0%
What Makes It Different
✓ Zone-based approach (more realistic than lines)
✓ Multi-timeframe confluence detection
✓ Minimal visual clutter with maximum information
✓ Professional institutional aesthetic
✓ Comprehensive tooltips for easy optimization
✓ No repainting - all pivots are confirmed
Best Used For
Identifying high-probability entry/exit zones
Setting stop-loss and take-profit levels
Recognizing breakout/breakdown areas
Multi-timeframe confluence analysis
Swing trading and position trading
Intraday scalping with adjusted parameters
Notes
Works on all timeframes and markets
Fully customizable colors and parameters
All settings include detailed optimization guidance
Clean code, efficient performance
No alerts or notifications (visual analysis only)

PivotBoss Oscillator (PBOsc)PivotBoss Oscillator (PBOsc) – Description
The PivotBoss Oscillator (PBOsc) is a momentum-based indicator derived from the PivotBoss PEMA Method, designed to identify market bias, trend strength, and potential reversals across all timeframes and instruments.
Unlike traditional oscillators, PBOsc measures the differential among three pivot-based EMAs (fast, medium, and slow) relative to the pivot point (PP) of each bar, allowing it to self-adjust dynamically with current market volatility.
Calculation Logic
Pivot Point (PP):
𝑃
𝑃
=
(
𝐻
𝑖
𝑔
ℎ
+
𝐿
𝑜
𝑤
+
𝐶
𝑙
𝑜
𝑠
𝑒
)
/
3
PP=(High+Low+Close)/3
Pivot-Based EMAs:
Fast PEMA = EMA(PP, fast length)
Medium PEMA = EMA(PP, medium length)
Slow PEMA = EMA(PP, slow length)
Differentials:
Diff1 = Fast PEMA − Slow PEMA
Diff2 = Medium PEMA − Slow PEMA
Diff3 = Fast PEMA − Medium PEMA
Oscillator Value:
𝑃
𝐵
𝑂
𝑠
𝑐
=
(
𝐷
𝑖
𝑓
𝑓
1
+
𝐷
𝑖
𝑓
𝑓
2
+
𝐷
𝑖
𝑓
𝑓
3
)
/
𝑃
𝑃
PBOsc=(Diff1+Diff2+Diff3)/PP
Interpretation
Above Zero Line (0): Bullish bias; momentum favors the upside.
Below Zero Line (0): Bearish bias; momentum favors the downside.
Advancing Bars (Green): PBOsc rising → Strengthening trend or positive momentum.
Declining Bars (Red): PBOsc falling → Weakening trend or negative momentum.
Analytical Uses
Change of Bias: Detects short-term shifts in market sentiment.
Trending Markets: Measures pullbacks or continuations within ongoing trends.
Divergence: Divergence between price and PBOsc can signal potential reversals.
Default Settings
Default: (8, 13, 21)
Alternate Presets: (5, 8, 13), (13, 21, 34), (21, 34, 55)

MTF Pivot Fib Speed Resistance FansOverview
This Pine Script indicator, titled "MTF Pivot Fib Speed Resistance Fans", is a multi-timeframe tool that automatically plots Fib Speed Resistance Fan lines based on pivot structures derived from higher timeframes. It mirrors the functionality of TradingView’s built-in “Fib Speed Resistance Fan” drawing tool, but in a dynamic, programmatic way. It uses pivot highs and lows to anchor fan projections, drawing forward-facing trend lines that align with well-known Fibonacci ratios and their extensions.
Pivot Detection Logic
The script identifies pivots by comparing the current bar’s high and low against the highest and lowest prices over a user-defined pivot period. This pivot detection occurs on a higher timeframe of your choice, giving a broader and more strategic view of price structure. The script tracks direction changes in the pivot trend and stores only the most recent few pivots to maintain clean and meaningful fan drawings.
Fan Direction Control
The user can select whether to draw fans for "Buys", "Sells", or "Both". The script only draws fan lines when a new directional move is detected based on the pivot structure and the selected bias. For example, in “Buys” mode, a rising pivot followed by another higher low will trigger upward fan projections.
Fib Speed Resistance Levels
Once two pivots are identified, the script draws multiple fan lines from the first pivot outward, at angles defined by a preset list of Fibonacci levels. These fan lines help visualize speed and strength of a price move.
The script also draws a horizontal line from the pivot for additional confluence at the base level (1.0).
Price Level Plotting
In addition to drawing fan lines, the indicator also plots their price levels on the right-hand price scale. This makes it easier for users to visually reference the projected support and resistance levels without needing to trace the lines manually across the chart.
Mapping to TradingView’s "Fib Speed Resistance Fan"
The expanded set of values used in this script is not arbitrary—they closely align with the default and extended levels available in TradingView's built-in "Fib Speed Resistance Fan" tool.
TradingView’s Fib Fan tool offers several levels by default, including traditional Fibonacci ratios like 0.382, 0.5, 0.618, and 1. However, if you right-click the tool and open its settings, you’ll find additional toggles for levels like 1.618, 2.000, 2.618, and even 4.000. These deeper levels are used to project stronger trend continuations beyond the standard retracement zones.
The inclusion of levels such as 0.25, 0.75, and 1.34 reflects configurations that are available when you manually add or customize levels in TradingView’s fan tool. While 1.34 is not a canonical Fibonacci ratio, it is often found in hybrid Gann/Fib methods and is included in some preset templates in TradingView’s drawing tool for advanced users.
By incorporating these levels directly into the Pine Script, the indicator faithfully reproduces the fan structure users would manually draw using TradingView’s graphical Fib Fan tool—but does so programmatically, dynamically, and with multi-timeframe control. This eliminates manual errors, allows for responsive updating, and adds custom visual tracking via the price scale.
These values are standardized within the context of TradingView's Fib Fan tool and not made up. This script automates what the manual drawing tool achieves, with added precision and flexibility.

CDP - Counter-Directional-Pivot🎯 CDP - Counter-Directional-Pivot
📊 Overview
The Counter-Directional-Pivot (CDP) indicator calculates five critical price levels based on the previous day's OHLC data, specifically designed for multi-timeframe analysis. Unlike standard pivot points, CDP levels are calculated using a unique formula that identifies potential reversal zones where price action often changes direction.
⚡ What Makes This Script Original
This implementation solves several technical challenges that existing pivot indicators face:
🔄 Multi-Timeframe Consistency: Values remain identical across all timeframes (1m, 5m, 1h, daily) - a common problem with many pivot implementations
🔒 Intraday Stability: Uses advanced value-locking technology to prevent the "stepping" effect that occurs when pivot lines shift during the trading session
💪 Robust Data Handling: Optimized for both liquid and illiquid stocks with enhanced data synchronization
🧮 CDP Calculation Formula
The indicator calculates five key levels using the previous day's High (H), Low (L), and Close (C):
CDP = (H + L + C) ÷ 3 (Central Decision Point)
AH = 2×CDP + H – 2×L (Anchor High - Strong Resistance)
NH = 2×CDP – L (Near High - Moderate Resistance)
AL = 2×CDP – 2×H + L (Anchor Low - Strong Support)
NL = 2×CDP – H (Near Low - Moderate Support)
✨ Key Features
🎨 Visual Elements
📈 Five Distinct Price Levels: Each with customizable colors and line styles
🏷️ Smart Label System: Shows exact price values for each level
📋 Optional Value Table: Displays all levels in an organized table format
🎯 Clean Chart Display: Minimal visual clutter while maximizing information
⚙️ Technical Advantages
🔐 Session-Locked Values: Prices are locked at market open, preventing intraday shifts
🔄 Multi-Timeframe Sync: Perfect consistency between daily and intraday charts
✅ Data Validation: Built-in checks ensure reliable calculations
🚀 Performance Optimized: Efficient code structure for fast loading
💼 Trading Applications
🔄 Reversal Zones: AH and AL often act as strong turning points
💥 Breakout Confirmation: Price movement beyond these levels signals trend continuation
🛡️ Risk Management: Use levels for stop-loss and take-profit placement
🏗️ Market Structure: Understand daily ranges and potential price targets
📚 How to Use
🚀 Basic Setup
Add the indicator to your chart (works on any timeframe)
Customize colors for easy identification of support/resistance zones
Enable the value table for quick reference of exact price levels
📈 Trading Strategy Examples
🟢 Long Bias: Look for bounces at NL or AL levels
🔴 Short Bias: Watch for rejections at NH or AH levels
💥 Breakout Trading: Enter positions when price decisively breaks through anchor levels
↔️ Range Trading: Use CDP as the central reference point for range-bound markets
🎯 Advanced Strategy Combinations
RSI Integration for Enhanced Signals: 📊
📉 Oversold Bounces: Combine RSI below 30 with price touching AL/NL levels for high-probability long entries
📈 Overbought Rejections: Look for RSI above 70 with price rejecting AH/NH levels for short opportunities
🔍 Divergence Confirmation: When RSI shows bullish divergence at support levels (AL/NL) or bearish divergence at resistance levels (AH/NH), it often signals stronger reversal potential
⚡ Momentum Confluence: RSI crossing 50 while price breaks through CDP can confirm trend direction changes
⚙️ Configuration Options
🎨 Line Customization: Adjust width, style (solid/dashed/dotted), and colors
👁️ Display Preferences: Toggle individual levels, labels, and value table
📍 Table Position: Place the value table anywhere on your chart
🔔 Alert System: Get notifications when price crosses key levels
🔧 Technical Implementation Details
🎯 Data Reliability
The script uses request.security() with lookahead settings to ensure historical accuracy while maintaining real-time functionality. The value-locking mechanism prevents the common issue where pivot levels shift during the trading day.
🔄 Multi-Timeframe Logic
⏰ Intraday Charts: Display previous day's calculated levels as stable horizontal lines
📅 Daily Charts: Show current day's levels based on yesterday's OHLC
🔍 Consistency Check: All timeframes reference the same source data
🤔 Why CDP vs Standard Pivots?
Counter-Directional Pivots often provide more accurate reversal points than traditional pivot calculations because they incorporate the relationship between high/low ranges and closing prices more effectively. The formula creates levels that better reflect market psychology and institutional trading behaviors.
💡 Best Practices
💧 Use on liquid markets for most reliable results
📊 RSI Combination: Add RSI indicator for overbought/oversold confirmation and divergence analysis
📊 Combine with volume analysis for confirmation
🔍 Consider multiple timeframe analysis (daily levels on hourly charts)
📝 Test thoroughly in paper trading before live implementation
💪 Example Market Applications
NASDAQ:AAPL AAPL - Tech stock breakouts through AH levels
$NYSE:SPY SPY - Index trading with CDP range analysis
NASDAQ:TSLA TSLA - Volatile stock reversals at AL/NL levels
⚠️ This indicator is designed for educational and analytical purposes. Always combine with proper risk management and additional technical analysis tools.
