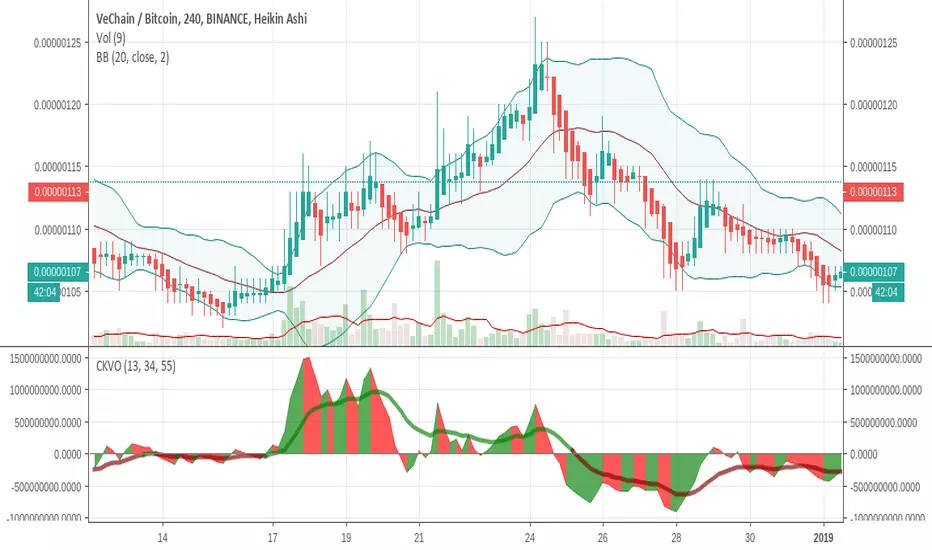
Crypto Long RSI Entry with AveragingIndicator Name:
04 - Crypto Long RSI Entry with Averaging + Info Table + Lines (03 style lines)
Description:
This indicator is designed for crypto trading on the long side only, using RSI-based entry signals combined with a multi-step averaging strategy and a visual information panel. It aims to capture price rebounds from oversold RSI levels and manage position entries with two staged averaging points, optimizing the average entry price and take-profit targets.
Key Features:
RSI-Based Entry: Enters a long position when the RSI crosses above a defined oversold level (default 25), with an optional faster entry if RSI crosses above 20 after being below it.
Two-Stage Averaging: Allows up to two averaging entries at user-defined price drop percentages (default 5% and 14%), increasing position size to improve average entry price.
Dynamic Take Profit: Adjusts take profit targets after each averaging stage, with customizable percentage levels.
Visual Signals: Marks entries, averaging points, and exits on the chart using colored labels and lines for easy tracking.
Info Table: Displays current trade status, averaging stages, total profit, number of wins, and maximum drawdown percentage in a table on the chart.
Graphical Lines: Shows horizontal lines for entry price, take profit, and averaging prices to visually track trade management.
Cari dalam skrip untuk "profit"
RSI SwingRadar🧠 Strategy Overview
This long-only strategy combines RSI/MA crossovers with ATR-based risk management, designed for cleaner entries during potential bounce phases — especially tuned for assets like XMR/USDT.
🔍 Core Logic:
- RSI Crossover: Entry occurs when the 14-period RSI crosses above its 14-period SMA, signaling a potential shift in momentum.
- Oversold Filter: The RSI must have been below a user-defined oversold threshold (default: 35) on the previous candle, filtering for bounce setups after a pullback.
- ATR-Based Stop/Target: Stop-loss is placed below the low by a user-adjustable ATR multiplier (default: 0.5×). Take-profit is calculated with a Risk:Reward multiplier (default: 4×).
These elements work in tandem — RSI crossovers give momentum confirmation, oversold filtering adds context, and ATR-based exits adapt to volatility, creating a compact yet responsive strategy.
📉 Visuals:
- Dynamic Bands: The chart displays the active stop-loss, entry price, and take-profit as colored bands for easy visual tracking.
- Clean Overlay: Designed with simplicity — only confirmed setups are shown, keeping noise low.
✅ Suggested Use:
- Works best on XMR/USDT or similarly trending assets.
- Best suited for pullback entries during broader uptrends.
- Adjustable for different volatility conditions and asset behaviors.
⚠️ Disclaimer
- This strategy is for educational and research purposes only.
- It does not guarantee profitability in any market.
- Always backtest, forward-test, and understand your own risk tolerance before using any
strategy in a live environment.
- Past performance is not indicative of future results.
- This script is not financial advice.
Trailing Stop Loss [TradingFinder] 4 Machine Learning Methods🔵 Introduction
The trailing stop indicator dynamically adjusts stop-loss (SL) levels to lock in profits as price moves favorably. It uses pivot levels and ATR to set optimal SL points, balancing risk and reward.
Trade confirmation filters, a key feature, ensure entries align with market conditions, reducing false signals. In 2023 a study showed filtered entries improve win rates by 15% in forex. This enhances trade precision.
SL settings, ranging from very tight to very wide, adapt to volatility via ATR calculations. These settings anchor SL to previous pivot levels, ensuring alignment with market structure. This caters to diverse trading styles, from scalping to swing trading.
The indicator colors the profit zone between the entry point (EP) and SL, using light green for buy trades and light red for sell trades. This visual cue highlights profit potential. It’s ideal for traders seeking dynamic risk management.
A table displays real-time trade details, including EP, SL, and profit/loss (PNL). Backtests show trailing stops cut losses by 20% in trending markets. This transparency aids decision-making.
🔵 How to Use
🟣 SL Levels
The trailing stop indicator sets SL based on pivot levels and ATR, offering four options: very tight, tight, wide, or very wide. Very tight SLs suit scalpers, while wide SLs fit swing traders. Select the base level to match your strategy.
If price hits the SL, the trade closes, and the indicator evaluates the next trade using the selected filter. This ensures disciplined trade management. The cycle restarts with a new confirmed entry.
Very tight SLs, set near recent pivots, trigger exits early to minimize risk but limit profits in volatile markets. Wide SLs, shown as farther lines, allow more price movement but increase exposure to losses. Adjust based on ATR and conditions, noting SL breaches open new positions.
🟣 Visualization
The indicator’s visual cues, like colored profit zones, simplify monitoring, with light green showing the profit area from EP to trailed SL. Dashed lines mark entry points, while solid lines track the trailed SL, triggering new positions when breached.
When price moves into profit, the area between EP and SL is colored—light green for longs, light red for shorts. This highlights the profit zone visually. The SL trails price, locking in gains as the trade progresses.
🟣 Filters
Upon trade entry, the indicator requires confirmation via filters like SMA 2x or ADX to validate momentum. Filters reduce false entries, though no guarantee exists for improved outcomes. Monitor price action post-entry for trade validity.
Filters like Momentum or ADX assess trend strength before entry. For example, ADX above 25 confirms strong trends. Choose “none” for unfiltered entries.
🟣 Bullish Alert
For a bullish trade, the indicator opens a long position with a green SL Line (after optional filters), trailing the SL below price. Set alerts to On in the settings for notifications, or Off to monitor manually.
🟣 Bearish Alert
In a bearish trade, the indicator opens a short position with a red SL Line post-confirmation, trailing the SL above price. With alerts On in the settings, it notifies the potential reversal.
🟣 Panel
A table displays all trades’ details, including Win Rates, PNL, and trade status. This real-time data aids in tracking performance. Check the table to assess trade outcomes instantly.
Review the table regularly to evaluate trade performance and adjust settings. Consistent monitoring ensures alignment with market dynamics. This maximizes the indicator’s effectiveness.
🔵 Settings
Length (Default: 10) : Sets the pivot period for calculating SL levels, balancing sensitivity and reliability.
Base Level : Options (“Very tight,” “Tight,” “Wide,” “Very wide”) adjust SL distance via ATR.
Show EP Checkbox : Toggles visibility of the entry point on the chart.
Show PNL : Displays profit/loss data for active and closed trades.
Filter : Options (“none,” “SMA 2x,” “Momentum,” “ADX”) validate trade entries.
🔵 Conclusion
The trailing stop indicator, a dynamic risk management tool, adjusts SLs using pivot levels and ATR. Its confirmation filters reduce false entries, boosting precision. Backtests show 20% loss reduction in trending markets.
Customizable SL settings and visual profit zones enhance usability across trading styles. The real-time table provides clear trade insights, streamlining analysis. It’s ideal for forex, stocks, or crypto.
While filters like ADX improve entry accuracy, no setup guarantees success in all conditions. Contextual analysis, like trend strength, is key. This indicator empowers disciplined, data-driven trading.
Bear Market Probability Model# Bear Market Probability Model: A Multi-Factor Risk Assessment Framework
The Bear Market Probability Model represents a comprehensive quantitative framework for assessing systemic market risk through the integration of 13 distinct risk factors across four analytical categories: macroeconomic indicators, technical analysis factors, market sentiment measures, and market breadth metrics. This indicator synthesizes established financial research methodologies to provide real-time probabilistic assessments of impending bear market conditions, offering institutional-grade risk management capabilities to retail and professional traders alike.
## Theoretical Foundation
### Historical Context of Bear Market Prediction
Bear market prediction has been a central focus of financial research since the seminal work of Dow (1901) and the subsequent development of technical analysis theory. The challenge of predicting market downturns gained renewed academic attention following the market crashes of 1929, 1987, 2000, and 2008, leading to the development of sophisticated multi-factor models.
Fama and French (1989) demonstrated that certain financial variables possess predictive power for stock returns, particularly during market stress periods. Their three-factor model laid the groundwork for multi-dimensional risk assessment, which this indicator extends through the incorporation of real-time market microstructure data.
### Methodological Framework
The model employs a weighted composite scoring methodology based on the theoretical framework established by Campbell and Shiller (1998) for market valuation assessment, extended through the incorporation of high-frequency sentiment and technical indicators as proposed by Baker and Wurgler (2006) in their seminal work on investor sentiment.
The mathematical foundation follows the general form:
Bear Market Probability = Σ(Wi × Ci) / ΣWi × 100
Where:
- Wi = Category weight (i = 1,2,3,4)
- Ci = Normalized category score
- Categories: Macroeconomic, Technical, Sentiment, Breadth
## Component Analysis
### 1. Macroeconomic Risk Factors
#### Yield Curve Analysis
The inclusion of yield curve inversion as a primary predictor follows extensive research by Estrella and Mishkin (1998), who demonstrated that the term spread between 3-month and 10-year Treasury securities has historically preceded all major recessions since 1969. The model incorporates both the 2Y-10Y and 3M-10Y spreads to capture different aspects of monetary policy expectations.
Implementation:
- 2Y-10Y Spread: Captures market expectations of monetary policy trajectory
- 3M-10Y Spread: Traditional recession predictor with 12-18 month lead time
Scientific Basis: Harvey (1988) and subsequent research by Ang, Piazzesi, and Wei (2006) established the theoretical foundation linking yield curve inversions to economic contractions through the expectations hypothesis of the term structure.
#### Credit Risk Premium Assessment
High-yield credit spreads serve as a real-time gauge of systemic risk, following the methodology established by Gilchrist and Zakrajšek (2012) in their excess bond premium research. The model incorporates the ICE BofA High Yield Master II Option-Adjusted Spread as a proxy for credit market stress.
Threshold Calibration:
- Normal conditions: < 350 basis points
- Elevated risk: 350-500 basis points
- Severe stress: > 500 basis points
#### Currency and Commodity Stress Indicators
The US Dollar Index (DXY) momentum serves as a risk-off indicator, while the Gold-to-Oil ratio captures commodity market stress dynamics. This approach follows the methodology of Akram (2009) and Beckmann, Berger, and Czudaj (2015) in analyzing commodity-currency relationships during market stress.
### 2. Technical Analysis Factors
#### Multi-Timeframe Moving Average Analysis
The technical component incorporates the well-established moving average convergence methodology, drawing from the work of Brock, Lakonishok, and LeBaron (1992), who provided empirical evidence for the profitability of technical trading rules.
Implementation:
- Price relative to 50-day and 200-day simple moving averages
- Moving average convergence/divergence analysis
- Multi-timeframe MACD assessment (daily and weekly)
#### Momentum and Volatility Analysis
The model integrates Relative Strength Index (RSI) analysis following Wilder's (1978) original methodology, combined with maximum drawdown analysis based on the work of Magdon-Ismail and Atiya (2004) on optimal drawdown measurement.
### 3. Market Sentiment Factors
#### Volatility Index Analysis
The VIX component follows the established research of Whaley (2009) and subsequent work by Bekaert and Hoerova (2014) on VIX as a predictor of market stress. The model incorporates both absolute VIX levels and relative VIX spikes compared to the 20-day moving average.
Calibration:
- Low volatility: VIX < 20
- Elevated concern: VIX 20-25
- High fear: VIX > 25
- Panic conditions: VIX > 30
#### Put-Call Ratio Analysis
Options flow analysis through put-call ratios provides insight into sophisticated investor positioning, following the methodology established by Pan and Poteshman (2006) in their analysis of informed trading in options markets.
### 4. Market Breadth Factors
#### Advance-Decline Analysis
Market breadth assessment follows the classic work of Fosback (1976) and subsequent research by Brown and Cliff (2004) on market breadth as a predictor of future returns.
Components:
- Daily advance-decline ratio
- Advance-decline line momentum
- McClellan Oscillator (Ema19 - Ema39 of A-D difference)
#### New Highs-New Lows Analysis
The new highs-new lows ratio serves as a market leadership indicator, based on the research of Zweig (1986) and validated in academic literature by Zarowin (1990).
## Dynamic Threshold Methodology
The model incorporates adaptive thresholds based on rolling volatility and trend analysis, following the methodology established by Pagan and Sossounov (2003) for business cycle dating. This approach allows the model to adjust sensitivity based on prevailing market conditions.
Dynamic Threshold Calculation:
- Warning Level: Base threshold ± (Volatility × 1.0)
- Danger Level: Base threshold ± (Volatility × 1.5)
- Bounds: ±10-20 points from base threshold
## Professional Implementation
### Institutional Usage Patterns
Professional risk managers typically employ multi-factor bear market models in several contexts:
#### 1. Portfolio Risk Management
- Tactical Asset Allocation: Reducing equity exposure when probability exceeds 60-70%
- Hedging Strategies: Implementing protective puts or VIX calls when warning thresholds are breached
- Sector Rotation: Shifting from growth to defensive sectors during elevated risk periods
#### 2. Risk Budgeting
- Value-at-Risk Adjustment: Incorporating bear market probability into VaR calculations
- Stress Testing: Using probability levels to calibrate stress test scenarios
- Capital Requirements: Adjusting regulatory capital based on systemic risk assessment
#### 3. Client Communication
- Risk Reporting: Quantifying market risk for client presentations
- Investment Committee Decisions: Providing objective risk metrics for strategic decisions
- Performance Attribution: Explaining defensive positioning during market stress
### Implementation Framework
Professional traders typically implement such models through:
#### Signal Hierarchy:
1. Probability < 30%: Normal risk positioning
2. Probability 30-50%: Increased hedging, reduced leverage
3. Probability 50-70%: Defensive positioning, cash building
4. Probability > 70%: Maximum defensive posture, short exposure consideration
#### Risk Management Integration:
- Position Sizing: Inverse relationship between probability and position size
- Stop-Loss Adjustment: Tighter stops during elevated risk periods
- Correlation Monitoring: Increased attention to cross-asset correlations
## Strengths and Advantages
### 1. Comprehensive Coverage
The model's primary strength lies in its multi-dimensional approach, avoiding the single-factor bias that has historically plagued market timing models. By incorporating macroeconomic, technical, sentiment, and breadth factors, the model provides robust risk assessment across different market regimes.
### 2. Dynamic Adaptability
The adaptive threshold mechanism allows the model to adjust sensitivity based on prevailing volatility conditions, reducing false signals during low-volatility periods and maintaining sensitivity during high-volatility regimes.
### 3. Real-Time Processing
Unlike traditional academic models that rely on monthly or quarterly data, this indicator processes daily market data, providing timely risk assessment for active portfolio management.
### 4. Transparency and Interpretability
The component-based structure allows users to understand which factors are driving risk assessment, enabling informed decision-making about model signals.
### 5. Historical Validation
Each component has been validated in academic literature, providing theoretical foundation for the model's predictive power.
## Limitations and Weaknesses
### 1. Data Dependencies
The model's effectiveness depends heavily on the availability and quality of real-time economic data. Federal Reserve Economic Data (FRED) updates may have lags that could impact model responsiveness during rapidly evolving market conditions.
### 2. Regime Change Sensitivity
Like most quantitative models, the indicator may struggle during unprecedented market conditions or structural regime changes where historical relationships break down (Taleb, 2007).
### 3. False Signal Risk
Multi-factor models inherently face the challenge of balancing sensitivity with specificity. The model may generate false positive signals during normal market volatility periods.
### 4. Currency and Geographic Bias
The model focuses primarily on US market indicators, potentially limiting its effectiveness for global portfolio management or non-USD denominated assets.
### 5. Correlation Breakdown
During extreme market stress, correlations between risk factors may increase dramatically, reducing the model's diversification benefits (Forbes and Rigobon, 2002).
## References
Akram, Q. F. (2009). Commodity prices, interest rates and the dollar. Energy Economics, 31(6), 838-851.
Ang, A., Piazzesi, M., & Wei, M. (2006). What does the yield curve tell us about GDP growth? Journal of Econometrics, 131(1-2), 359-403.
Baker, M., & Wurgler, J. (2006). Investor sentiment and the cross‐section of stock returns. The Journal of Finance, 61(4), 1645-1680.
Baker, S. R., Bloom, N., & Davis, S. J. (2016). Measuring economic policy uncertainty. The Quarterly Journal of Economics, 131(4), 1593-1636.
Barber, B. M., & Odean, T. (2001). Boys will be boys: Gender, overconfidence, and common stock investment. The Quarterly Journal of Economics, 116(1), 261-292.
Beckmann, J., Berger, T., & Czudaj, R. (2015). Does gold act as a hedge or a safe haven for stocks? A smooth transition approach. Economic Modelling, 48, 16-24.
Bekaert, G., & Hoerova, M. (2014). The VIX, the variance premium and stock market volatility. Journal of Econometrics, 183(2), 181-192.
Brock, W., Lakonishok, J., & LeBaron, B. (1992). Simple technical trading rules and the stochastic properties of stock returns. The Journal of Finance, 47(5), 1731-1764.
Brown, G. W., & Cliff, M. T. (2004). Investor sentiment and the near-term stock market. Journal of Empirical Finance, 11(1), 1-27.
Campbell, J. Y., & Shiller, R. J. (1998). Valuation ratios and the long-run stock market outlook. The Journal of Portfolio Management, 24(2), 11-26.
Dow, C. H. (1901). Scientific stock speculation. The Magazine of Wall Street.
Estrella, A., & Mishkin, F. S. (1998). Predicting US recessions: Financial variables as leading indicators. Review of Economics and Statistics, 80(1), 45-61.
Fama, E. F., & French, K. R. (1989). Business conditions and expected returns on stocks and bonds. Journal of Financial Economics, 25(1), 23-49.
Forbes, K. J., & Rigobon, R. (2002). No contagion, only interdependence: measuring stock market comovements. The Journal of Finance, 57(5), 2223-2261.
Fosback, N. G. (1976). Stock market logic: A sophisticated approach to profits on Wall Street. The Institute for Econometric Research.
Gilchrist, S., & Zakrajšek, E. (2012). Credit spreads and business cycle fluctuations. American Economic Review, 102(4), 1692-1720.
Harvey, C. R. (1988). The real term structure and consumption growth. Journal of Financial Economics, 22(2), 305-333.
Kahneman, D., & Tversky, A. (1979). Prospect theory: An analysis of decision under risk. Econometrica, 47(2), 263-291.
Magdon-Ismail, M., & Atiya, A. F. (2004). Maximum drawdown. Risk, 17(10), 99-102.
Nickerson, R. S. (1998). Confirmation bias: A ubiquitous phenomenon in many guises. Review of General Psychology, 2(2), 175-220.
Pagan, A. R., & Sossounov, K. A. (2003). A simple framework for analysing bull and bear markets. Journal of Applied Econometrics, 18(1), 23-46.
Pan, J., & Poteshman, A. M. (2006). The information in option volume for future stock prices. The Review of Financial Studies, 19(3), 871-908.
Taleb, N. N. (2007). The black swan: The impact of the highly improbable. Random House.
Whaley, R. E. (2009). Understanding the VIX. The Journal of Portfolio Management, 35(3), 98-105.
Wilder, J. W. (1978). New concepts in technical trading systems. Trend Research.
Zarowin, P. (1990). Size, seasonality, and stock market overreaction. Journal of Financial and Quantitative Analysis, 25(1), 113-125.
Zweig, M. E. (1986). Winning on Wall Street. Warner Books.
Big Mover Catcher BTC 4h🧠 Big Mover Catcher (BTC 4H Strategy) — Educational Tool
⚠️ Disclaimer: I am not a financial advisor. This script is for educational and testing purposes only. Cryptocurrency trading is highly volatile and involves significant risk. You can lose all of your invested capital.
📌 Overview
The Big Mover Catcher strategy is a work-in-progress trading system designed for Bitcoin (BTC) on the 4-hour chart. It aims to identify strong breakout moves by combining multiple technical indicators and conditions, allowing for high customization and filter-based confirmations.
This script is part of a personal project to learn Pine Script and backtesting on TradingView. It is currently in the testing and research phase.
🎯 Strategy Objective
Catch large, high-momentum breakout moves in the BTC market using:
Bollinger Band breakouts for entry signals
Momentum, volatility, and trend filters for trade confirmation
🧰 Features & Filters
The script provides a flexible set of filters that can be turned ON/OFF and adjusted directly from the settings panel:
✅ Entry Conditions
Price must break above or below Bollinger Bands
All selected filters must align before entry
🧪 Available Filters:
Relative Strength Index (RSI) with EMA/SMA smoothing
Average Directional Index (ADX) with EMA/SMA smoothing
Average True Range (ATR) with EMA/SMA smoothing
MACD Signal above or below zero
EMA 350 trend filter
ATR / ADX / RSI Threshold toggles for added control
🔥 Additional Feature:
Force Take Profit: Optionally closes the trade immediately if a candle closes with more than a defined % movement (default: 5%). This can help lock in quick profits during high volatility moves.
⚙️ Customizable Inputs
You can configure:
Stop loss percentage
All indicator lengths
Smoothing types (EMA/SMA)
Threshold activation toggles
Individual filter ON/OFF switches
This makes the strategy highly adaptable for educational exploration and optimization.
📊 Best Used For
Learning Pine Script and strategy structure
Testing filter combinations for BTC on the 4H timeframe
Understanding how different indicators interact in live markets
⚠️ Note: ❌ Short trades are currently disabled by default, as short-side logic is still under development.
❗ Final Reminder
This script is not financial advice. It is an educational tool. Use it to learn and explore trading logic. Trading cryptocurrencies carries high risk — only invest what you can afford to lose.
EMA Pullback Speed Strategy 📌 **Overview**
The **EMA Pullback Speed Strategy** is a trend-following approach that combines **price momentum** and **Exponential Moving Averages (EMA)**.
It aims to identify high-probability entry points during brief pullbacks within ongoing uptrends or downtrends.
The strategy evaluates **speed of price movement**, **relative position to dynamic EMA**, and **candlestick patterns** to determine ideal timing for entries.
One of the key concepts is checking whether the price has **“not pulled back too much”**, helping focus only on situations where the trend is likely to continue.
⚠️ This strategy is designed for educational and research purposes only. It does not guarantee future profits.
🧭 **Purpose**
This strategy addresses the common issue of **"jumping in too late during trends and taking unnecessary losses."**
By waiting for a healthy pullback and confirming signs of **trend resumption**, traders can enter with greater confidence and reduce false entries.
🎯 **Strategy Objectives**
* Enter in the direction of the prevailing trend to increase win rate
* Filter out false signals using pullback depth, speed, and candlestick confirmations
* Predefine Take-Profit (TP) and Stop-Loss (SL) levels for safer, rule-based trading
✨ **Key Features**
* **Dynamic EMA**: Reacts faster when price moves quickly, slower when market is calm – adapting to current momentum
* **Pullback Filter**: Avoids trades when price pulls back too far (e.g., more than 5%), indicating a trend may be weakening
* **Speed Check**: Measures how strongly the price returns to the trend using candlestick body speed (open-to-close range in ticks)
📊 **Trading Rules**
**■ Long Entry Conditions:**
* Current price is above the dynamic EMA (indicating uptrend)
* Price has pulled back toward the EMA (a "buy the dip" situation)
* Pullback depth is within the threshold (not excessive)
* Candlesticks show consecutive bullish closes and break the previous high
* Price speed is strong (positive movement with momentum)
**■ Short Entry Conditions:**
* Current price is below the dynamic EMA (indicating downtrend)
* Price has pulled back up toward the EMA (a "sell the rally" setup)
* Pullback is within range (not too deep)
* Candlesticks show consecutive bearish closes and break the previous low
* Price speed is negative (downward momentum confirmed)
**■ Exit Conditions (TP/SL):**
* **Take-Profit (TP):** Fixed 1.5% target above/below entry price
* **Stop-Loss (SL):** Based on recent price volatility, calculated using ATR × 4
💰 **Risk Management Parameters**
* Symbol & Timeframe: BTCUSD on 1-hour chart (H1)
* Test Capital: \$3000 (simulated account)
* Commission: 0.02%
* Slippage: 2 ticks (minimal execution lag)
* Max risk per trade: 5% of account balance
* Backtest Period: Aug 30, 2023 – May 9, 2025
* Profit Factor (PF): 1.965 (Net profit ÷ Net loss, including spreads & fees)
⚙️ **Trading Parameters & Indicator Settings**
* Maximum EMA Length: 50
* Accelerator Multiplier: 3.0
* Pullback Threshold: 5.0%
* ATR Period: 14
* ATR Multiplier (SL distance): 4.0
* Fixed TP: 1.5%
* Short-term EMA: 21
* Long-term EMA: 50
* Long Speed Threshold: ≥ 1000.0 (ticks)
* Short Speed Threshold: ≤ -1000.0 (ticks)
⚠️Adjustments are based on BTCUSD.
⚠️Forex and other currency pairs require separate adjustments.
🔧 **Strategy Improvements & Uniqueness**
Unlike basic moving average crossovers or RSI triggers, this strategy emphasizes **"momentum-supported pullbacks"**.
By combining dynamic EMA, speed checks, and candlestick signals, it captures trades **as if surfing the wave of a trend.**
Its built-in filters help **avoid overextended pullbacks**, which often signal the trend is ending – making it more robust than traditional trend-following systems.
✅ **Summary**
The **EMA Pullback Speed Strategy** is easy to understand, rule-based, and highly reproducible – ideal for both beginners and intermediate traders.
Because it shows **clear visual entry/exit points** on the chart, it’s also a great tool for practicing discretionary trading decisions.
⚠️ Past performance is not a guarantee of future results.
Always respect your Stop-Loss levels and manage your position size according to your risk tolerance.
TCP | Money Management indicator | Crypto Version📌 TCP | Money Management Indicator | Crypto Version
A robust, multi-target risk and capital management indicator tailored for crypto traders. Whether you're trading spot, perpetual futures, or leverage tokens, this tool empowers you with precise control over risk, reward, and position sizing—directly on your chart. Eliminate guesswork and trade with confidence.
🔰 Introduction: Master Your Capital, Master Your Trades
Poor money management is the number one reason traders lose their accounts, even with solid strategies. The TCP Money Management Indicator, built by Trade City Pro (TCP), solves this problem by providing a structured, rule-based approach to capital allocation.
Want to dive deeper into the concept of money management? Check out our comprehensive tutorial on TradingView, " TradeCityPro Academy: Money Management ", to understand the principles that power this indicator and transform your trading mindset.
This indicator equips you to:
• Calculate optimal position sizes based on your capital, risk percentage, and leverage
• Set up to 5 customizable take-profit targets with partial close percentages
• Access real-time metrics like Risk-to-Reward (R/R), USD profit, and margin usage
• Trade with discipline, avoiding emotional or inconsistent decisions
💸 Money Management Formula
The indicator uses a professional capital allocation model:
Position Size = (Capital × Risk %) ÷ (Stop Loss % × Leverage)
From this, it calculates:
• Total risk amount in USD
• Optimal position size for your trade
• Margin required for each take-profit target
• Adjusted R/R for each target, accounting for partial position closures
🛠 How to Use
Enter Trade Parameters: Input your capital, risk %, leverage, entry price, and stop-loss price.
Set Take-Profit Targets: Enable 1 to 5 take-profit levels and specify the percentage of the position to close at each.
Real-Time Calculations: The indicator automatically computes:
• R/R ratio for each target
• Profit in USD for each partial close
• Margin used per target (in % and USD)
Visualize Your Trade:
• Price levels for entry, stop-loss, and take-profits are plotted on the chart.
• A dynamic info panel on the left side displays all key metrics.
🔄 Dynamic Adjustments: As each take-profit target is hit and a portion of the position is closed, the indicator recalculates the remaining position size, expected profit, R/R, and margin for subsequent targets. This ensures accuracy and reflects real-world trade behavior.
📊 Table Overview
The left-side panel provides a clear snapshot:
• Trade Setup: Capital, entry price, stop-loss, risk amount, and position size
• Per Target: Percentage closed, R/R, profit in USD, and margin used
• Summary: Total expected profit across all targets
⚙️ Settings Panel
• Total Capital ($): Your account size for the trade
• Risk per Trade (%): The percentage of capital you’re willing to risk
• Leverage: The leverage applied to the trade
• Entry/Stop-Loss Prices: Define your trade’s risk zone
• Take-Profit Targets (1–5): Set price levels and percentage to close at each
🔍 Use Case Example
Imagine you have $1,000 capital, risking 1%, using 10x leverage:
• Entry: $100 | Stop-Loss: $95
• TP1: $110 (close 50%) | TP2: $115 (close 50%)
The indicator calculates the exact position size, profit at each target, and margin allocation in real time, with all metrics displayed on the chart.
✅ Why Traders Love It
• Precision: No more manual calculations or guesswork
• Versatility: Works on all crypto pairs (BTC, ETH, altcoins, etc.)
• Flexibility: Perfect for scalping, swing trading, or futures strategies
• Universal: Compatible with all timeframes
• Transparency: Fully manual, with clear and reliable outputs
🧩 Built by Trade City Pro (TCP)
Developed by TCP, a trusted name in trading tools, used by over 150,000 traders worldwide. This indicator is coded in Pine Script v5, ensuring compatibility with TradingView’s platform.
🧾 Final Notes
• No Auto-Trading: This is a manual tool for disciplined traders
• No Repainting: All calculations are accurate and non-repainting
• Tested: Rigorously validated across major crypto pairs
• Publish-Ready: Built for seamless use on TradingView
🔗 Resources
• Money Management Tutorial: Learn the fundamentals of capital management with our detailed guide: TradeCityPro Academy: Money Management
• TradingView Profile: Explore more tools by TCP on TradingView
Extended Altman Z-Score ModelThe Extended Altman Z-Score Model represents a significant advancement in financial analysis and risk assessment, building upon the foundational work of Altman (1968) while incorporating contemporary data analytics approaches as proposed by Fung (2023). This sophisticated model enhances the traditional bankruptcy prediction framework by integrating additional financial metrics and modern analytical techniques, offering a more comprehensive approach to identifying financially distressed companies.
The model's architecture is built upon two distinct yet complementary scoring systems. The traditional Altman Z-Score components form the foundation, including Working Capital to Total Assets (X1), which measures a company's short-term liquidity and operational efficiency. Retained Earnings to Total Assets (X2) provides insight into the company's historical profitability and reinvestment capacity. EBIT to Total Assets (X3) evaluates operational efficiency and earning power, while Market Value of Equity to Total Liabilities (X4) assesses market perception and leverage. Sales to Total Assets (X5) measures asset utilization efficiency.
These traditional components are enhanced by extended metrics introduced by Fung (2023), which provide additional layers of financial analysis. The Cash Ratio (X6) offers insights into immediate liquidity and financial flexibility. Asset Composition (X7) evaluates the quality and efficiency of asset utilization, particularly in working capital management. The Debt Ratio (X8) provides a comprehensive view of financial leverage and long-term solvency, while the Net Profit Margin (X9) measures overall profitability and operational efficiency.
The scoring system employs a sophisticated formula that combines the traditional Z-Score with weighted additional metrics. The traditional Z-Score is calculated as 1.2X1 + 1.4X2 + 3.3X3 + 0.6X4 + 1.0X5, while the extended components are weighted as follows: 0.5 * X6 + 0.3 * X7 - 0.4 * X8 + 0.6 * X9. This enhanced scoring mechanism provides a more nuanced assessment of a company's financial health, incorporating both traditional bankruptcy prediction metrics and modern financial analysis approaches.
The model categorizes companies into three distinct risk zones, each with specific implications for financial stability and required actions. The Safe Zone (Score > 3.0) indicates strong financial health, with low probability of financial distress and suitability for conservative investment strategies. The Grey Zone (Score between 1.8 and 3.0) suggests moderate risk, requiring careful monitoring and additional fundamental analysis. The Danger Zone (Score < 1.8) signals high risk of financial distress, necessitating immediate attention and potential risk mitigation strategies.
In practical application, the model requires systematic and regular monitoring. Users should track the Extended Score on a quarterly basis, monitoring changes in individual components and comparing results with industry benchmarks. Component analysis should be conducted separately, identifying specific areas of concern and tracking trends in individual metrics. The model's effectiveness is significantly enhanced when used in conjunction with other financial metrics and when considering industry-specific factors and macroeconomic conditions.
The technical implementation in Pine Script v6 provides real-time calculations of both traditional and extended scores, offering visual representation of risk zones, detailed component breakdowns, and warning signals for critical values. The indicator automatically updates with new financial data and provides clear visual cues for different risk levels, making it accessible to both technical and fundamental analysts.
However, as noted by Fung (2023), the model has certain limitations that users should consider. It may not fully account for industry-specific factors, requires regular updates of financial data, and should be used in conjunction with other analysis tools. The model's effectiveness can be enhanced by incorporating industry-specific benchmarks and considering macroeconomic factors that may affect financial performance.
References:
Altman, E.I. (1968) 'Financial ratios, discriminant analysis and the prediction of corporate bankruptcy', The Journal of Finance, 23(4), pp. 589-609.
Li, L., Wang, B., Wu, Y. and Yang, Q., 2020. Identifying poorly performing listed firms using data analytics. Journal of Business Research, 109, pp.1–12. doi.org
Liquid Pulse Liquid Pulse by Dskyz (DAFE) Trading Systems
Liquid Pulse is a trading algo built by Dskyz (DAFE) Trading Systems for futures markets like NQ1!, designed to snag high-probability trades with tight risk control. it fuses a confluence system—VWAP, MACD, ADX, volume, and liquidity sweeps—with a trade scoring setup, daily limits, and VIX pauses to dodge wild volatility. visuals include simple signals, VWAP bands, and a dashboard with stats.
Core Components for Liquid Pulse
Volume Sensitivity (volumeSensitivity) controls how much volume spikes matter for entries. options: 'Low', 'Medium', 'High' default: 'High' (catches small spikes, good for active markets) tweak it: 'Low' for calm markets, 'High' for chaos.
MACD Speed (macdSpeed) sets the MACD’s pace for momentum. options: 'Fast', 'Medium', 'Slow' default: 'Medium' (solid balance) tweak it: 'Fast' for scalping, 'Slow' for swings.
Daily Trade Limit (dailyTradeLimit) caps trades per day to keep risk in check. range: 1 to 30 default: 20 tweak it: 5-10 for safety, 20-30 for action.
Number of Contracts (numContracts) sets position size. range: 1 to 20 default: 4 tweak it: up for big accounts, down for small.
VIX Pause Level (vixPauseLevel) stops trading if VIX gets too hot. range: 10 to 80 default: 39.0 tweak it: 30 to avoid volatility, 50 to ride it.
Min Confluence Conditions (minConditions) sets how many signals must align. range: 1 to 5 default: 2 tweak it: 3-4 for strict, 1-2 for more trades.
Min Trade Score (Longs/Shorts) (minTradeScoreLongs/minTradeScoreShorts) filters trade quality. longs range: 0 to 100 default: 73 shorts range: 0 to 100 default: 75 tweak it: 80-90 for quality, 60-70 for volume.
Liquidity Sweep Strength (sweepStrength) gauges breakouts. range: 0.1 to 1.0 default: 0.5 tweak it: 0.7-1.0 for strong moves, 0.3-0.5 for small.
ADX Trend Threshold (adxTrendThreshold) confirms trends. range: 10 to 100 default: 41 tweak it: 40-50 for trends, 30-35 for weak ones.
ADX Chop Threshold (adxChopThreshold) avoids chop. range: 5 to 50 default: 20 tweak it: 15-20 to dodge chop, 25-30 to loosen.
VWAP Timeframe (vwapTimeframe) sets VWAP period. options: '15', '30', '60', '240', 'D' default: '60' (1-hour) tweak it: 60 for day, 240 for swing, D for long.
Take Profit Ticks (Longs/Shorts) (takeProfitTicksLongs/takeProfitTicksShorts) sets profit targets. longs range: 5 to 100 default: 25.0 shorts range: 5 to 100 default: 20.0 tweak it: 30-50 for trends, 10-20 for chop.
Max Profit Ticks (maxProfitTicks) caps max gain. range: 10 to 200 default: 60.0 tweak it: 80-100 for big moves, 40-60 for tight.
Min Profit Ticks to Trail (minProfitTicksTrail) triggers trailing. range: 1 to 50 default: 7.0 tweak it: 10-15 for big gains, 5-7 for quick locks.
Trailing Stop Ticks (trailTicks) sets trail distance. range: 1 to 50 default: 5.0 tweak it: 8-10 for room, 3-5 for fast locks.
Trailing Offset Ticks (trailOffsetTicks) sets trail offset. range: 1 to 20 default: 2.0 tweak it: 1-2 for tight, 5-10 for loose.
ATR Period (atrPeriod) measures volatility. range: 5 to 50 default: 9 tweak it: 14-20 for smooth, 5-9 for reactive.
Hardcoded Settings volLookback: 30 ('Low'), 20 ('Medium'), 11 ('High') volThreshold: 1.5 ('Low'), 1.8 ('Medium'), 2 ('High') swingLen: 5
Execution Logic Overview trades trigger when confluence conditions align, entering long or short with set position sizes. exits use dynamic take-profits, trailing stops after a profit threshold, hard stops via ATR, and a time stop after 100 bars.
Features Multi-Signal Confluence: needs VWAP, MACD, volume, sweeps, and ADX to line up.
Risk Control: ATR-based stops (capped 15 ticks), take-profits (scaled by volatility), and trails.
Market Filters: VIX pause, ADX trend/chop checks, volatility gates. Dashboard: shows scores, VIX, ADX, P/L, win %, streak.
Visuals Simple signals (green up triangles for longs, red down for shorts) and VWAP bands with glow. info table (bottom right) with MACD momentum. dashboard (top right) with stats.
Chart and Backtest:
NQ1! futures, 5-minute chart. works best in trending, volatile conditions. tweak inputs for other markets—test thoroughly.
Backtesting: NQ1! Frame: Jan 19, 2025, 09:00 — May 02, 2025, 16:00 Slippage: 3 Commission: $4.60
Fee Typical Range (per side, per contract)
CME Exchange $1.14 – $1.20
Clearing $0.10 – $0.30
NFA Regulatory $0.02
Firm/Broker Commis. $0.25 – $0.80 (retail prop)
TOTAL $1.60 – $2.30 per side
Round Turn: (enter+exit) = $3.20 – $4.60 per contract
Disclaimer this is for education only. past results don’t predict future wins. trading’s risky—only use money you can lose. backtest and validate before going live. (expect moderators to nitpick some random chart symbol rule—i’ll fix and repost if they pull it.)
About the Author Dskyz (DAFE) Trading Systems crafts killer trading algos. Liquid Pulse is pure research and grit, built for smart, bold trading. Use it with discipline. Use it with clarity. Trade smarter. I’ll keep dropping badass strategies ‘til i build a brand or someone signs me up.
2025 Created by Dskyz, powered by DAFE Trading Systems. Trade smart, trade bold.
Reverse Keltner Channel StrategyReverse Keltner Channel Strategy
Overview
The Reverse Keltner Channel Strategy is a mean-reversion trading system that capitalizes on price movements between Keltner Channels. Unlike traditional Keltner Channel strategies that trade breakouts, this system takes the contrarian approach by entering positions when price returns to the channel after overextending.
Strategy Logic
Long Entry Conditions:
Price crosses above the lower Keltner Channel from below
This signals a potential reversal after an oversold condition
Position is entered at market price upon signal confirmation
Long Exit Conditions:
Take Profit: Price reaches the upper Keltner Channel
Stop Loss: Placed at half the channel width below entry price
Short Entry Conditions:
Price crosses below the upper Keltner Channel from above
This signals a potential reversal after an overbought condition
Position is entered at market price upon signal confirmation
Short Exit Conditions:
Take Profit: Price reaches the lower Keltner Channel
Stop Loss: Placed at half the channel width above entry price
Key Features
Mean Reversion Approach: Takes advantage of price tendency to return to mean after extreme moves
Adaptive Stop Loss: Stop loss dynamically adjusts based on market volatility via ATR
Visual Signals: Entry points clearly marked with directional triangles
Fully Customizable: All parameters can be adjusted to fit various market conditions
Customizable Parameters
Keltner EMA Length: Controls the responsiveness of the channel (default: 20)
ATR Multiplier: Determines channel width/sensitivity (default: 2.0)
ATR Length: Affects volatility calculation period (default: 10)
Stop Loss Factor: Adjusts risk management aggressiveness (default: 0.5)
Best Used On
This strategy performs well on:
Currency pairs with defined ranging behavior
Commodities that show cyclical price movements
Higher timeframes (4H, Daily) for more reliable signals
Markets with moderate volatility
Risk Management
The built-in stop loss mechanism automatically adjusts to market conditions by calculating position risk relative to the current channel width. This approach ensures that risk remains proportional to potential reward across varying market conditions.
Notes for Optimization
Consider adjusting the EMA length and ATR multiplier based on the specific asset and timeframe:
Lower values increase sensitivity and generate more signals
Higher values produce fewer but potentially more reliable signals
As with any trading strategy, thorough backtesting is recommended before live implementation.
Past performance is not indicative of future results. Always practice sound risk management.
Fibonacci + TP/SL Strategy [Backtest]✅ Key Features Added and Adjusted:
Fibonacci Retracement Levels:
Automatically calculated based on the last 100 bars' high/low
Plotted levels: 0%, 23.6%, 38.2%, 50%, 61.8%, 78.6%, 100%
Extension targets: 161.8%, 261.8%, 423.6%
Buy/Sell Signal Logic:
Buy: Price is between 78.6% and 38.2% levels
Sell: Price is between 61.8% and 23.6% levels
Both depend on a can_trade time filter to avoid overtrading
ATR-based Stop-Loss:
Stop-loss dynamically adapts to market volatility:
SL = Entry - ATR * 1.5 (long)
SL = Entry + ATR * 1.5 (short)
Fixed Take-Profit:
Configurable via input: default is 4%
Can be changed in TradingView UI
Golden/Death Cross Indicator (Visual Only):
EMA 50 crossing EMA 200 plotted on chart:
Golden Cross = Buy signal (green triangle)
Death Cross = Sell signal (red triangle)
Weekly Profit Cap:
Prevents new trades if weekly profit exceeds 15%
Resets at the start of every week
Visual Elements:
All Fibonacci levels are plotted
Buy/Sell signals are labeled on the chart (BUY, SELL)
OTE & A-B-C Zone Indicator SwiftEdgeOTE & A-B-C Zone Indicator SwiftEdge
Overview
The OTE & A-B-C Zone Indicator SwiftEdge is a versatile tool designed to help traders identify high-probability trading setups using a combination of Optimal Trade Entry (OTE) zones, Fibonacci levels, and A-B-C price patterns. This indicator is particularly useful for traders who rely on price action and Fibonacci-based strategies to find entry points, set stop-losses, and target potential take-profit levels. By integrating swing point detection, trend analysis, and Fibonacci projections, SwiftEdge provides a clear visual framework for making informed trading decisions across various timeframes.
What It Does
SwiftEdge identifies key price levels and zones to guide your trading:
OTE Zone: Highlights the Optimal Trade Entry zone between swing points A (swing high) and B (swing low) using Fibonacci retracement levels (default: 0.618 to 0.786). This zone represents a high-probability area for price reversals, making it an ideal entry point for trades.
A-B-C Pattern: Marks the latest swing points as A (swing high), B (swing low), and C (projected take-profit level) with dashed lines and labels. A solid line connects A to B to C, visually illustrating the price movement from entry to target.
Take-Profit Zones: Projects three customizable take-profit levels (TP1, TP2, TP3) based on Fibonacci extensions (default: 1.272, 1.618, 2.0) from the A-B swing, helping traders plan exits with favorable risk-reward ratios.
How It Works
SwiftEdge combines several technical components to create a cohesive trading system:
Swing Point Detection: Identifies significant swing highs (A) and swing lows (B) using a dynamic lookback period that adjusts to the selected timeframe. On lower timeframes like 1-minute charts, an ATR-based filter reduces noise by requiring price movements to exceed a threshold (0.5 * ATR(14)).
Trend Analysis: Uses an Exponential Moving Average (EMA) to determine the trend direction (default: 50-period EMA on 1H). The indicator marks uptrends (price above EMA) in green and downtrends (price below EMA) in red, ensuring trades align with the market's direction.
Fibonacci Levels: Applies Fibonacci retracement to define the OTE zone between A and B, and Fibonacci extensions to project take-profit levels (C) beyond the initial swing. This approach leverages the natural tendency of markets to respect Fibonacci ratios for reversals and extensions.
Visual Clarity: Displays only the latest A-B-C pattern with three dashed lines (A, B, C) and a solid connecting line, ensuring the chart remains uncluttered and easy to interpret.
The combination of these elements creates a structured setup where the OTE zone (between A and B) serves as an entry point, while the projected C level offers a target, all within the context of the prevailing trend. This synergy makes SwiftEdge a powerful tool for traders seeking to combine price action, trend analysis, and Fibonacci strategies.
How to Use
Add the Indicator: Apply the indicator to your chart via TradingView's indicator menu.
Identify the Trend: The OTE zone and A-B-C pattern will be colored green in uptrends (price above EMA) or red in downtrends (price below EMA). Use this to determine the market direction.
Entry Point: Look for price reversals within the OTE zone (between A and B). This zone is typically between the 0.618 and 0.786 Fibonacci retracement levels of the A-B swing, making it a high-probability area for entries.
Stop-Loss: Place your stop-loss below the OTE zone in an uptrend (or above in a downtrend) to protect against false breakouts.
Take-Profit Targets: Use the projected take-profit zones (TP1, TP2, TP3) as potential exit levels. These are based on Fibonacci extensions and can be toggled on/off in the settings.
Customization:
Adjust the Fibonacci levels for the OTE zone (Fibonacci Level 1 and Fibonacci Level 2) to suit your strategy.
Modify the take-profit levels (Fibonacci Extension Level for TP1/TP2/TP3) to target different extension ratios.
Change the lookback period (Base Lookback Period) and EMA period (Base EMA Period) to fine-tune swing point detection and trend sensitivity.
Customize colors for uptrends, downtrends, and A-B-C lines to match your preferences.
What Makes It Unique
SwiftEdge stands out by integrating swing point detection, Fibonacci-based OTE zones, and A-B-C price patterns into a single, visually intuitive indicator. Unlike standalone Fibonacci tools or trend indicators, SwiftEdge combines these elements to provide a complete trading setup: it identifies entry zones (OTE), confirms trend direction (EMA), and projects take-profit targets (Fibonacci extensions). The dynamic timeframe adjustment ensures consistent performance across all chart intervals, while the clean A-B-C visualization (with only the latest pattern displayed) prevents chart clutter, making it easier to focus on the most relevant price levels.
Notes
This indicator is designed for traders familiar with price action and Fibonacci strategies. It does not guarantee profits and should be used in conjunction with other analysis tools and proper risk management.
Performance may vary depending on market conditions and timeframe. Test the indicator on a demo account before using it in live trading.
[blackcat] L2 EMA NexusOVERVIEW
The L2 EMA Nexus is a comprehensive trading indicator that utilizes a three-tiered Exponential Moving Average (EMA) system to identify potential trading opportunities. This script combines technical analysis with robust risk management features to help traders make informed decisions.
KEY FEATURES
• Triple EMA Analysis:
Customizable source inputs for each EMA
Adjustable length parameters (3, 8, 21 periods)
Dynamic color coding based on trend direction
Real-time price action monitoring
• Advanced Entry Signals:
High-low price action verification
EMA cross-overs and cross-unders
Multi-timeframe trend confirmation
Dynamic position sizing limits
• Risk Management:
Configurable Take Profit levels
Flexible Stop Loss settings
Optional TP/SL activation
Clear visual indicators for levels
HOW TO USE
Setup Initial Parameters:
Configure EMA lengths for your timeframe
Set Take Profit percentage (default 25%)
Define Stop Loss percentage (default 2.5%)
Adjust pyramiding limit as needed
Enable/Disable Features:
Toggle TP/SL settings based on strategy
Customize alert conditions
Modify visual labels for clarity
Monitor Trading Signals:
Watch for buy/sell labels
Track TP/SL levels
Monitor position status
TRADE MANAGEMENT
• Entry Conditions:
Long Entry: Higher high with rising EMA1 and stable EMA3
Short Entry: Lower low with falling EMA1 and stable EMA2
• Exit Conditions:
Take Profit: Price reaches defined percentage above/below entry
Stop Loss: Price reaches defined percentage below/above entry
• Position Control:
Limited to specified number of positions
Automatic position tracking
Clear visual indication of current trades
TECHNICAL DETAILS
• EMA Calculation:
Uses Exponential Moving Average for trend following
Color-coded based on 2-bar trend direction
Multiple timeframe compatibility
• Label System:
Clear buy/sell markers
Take Profit and Stop Loss indicators
Real-time position status updates
• Alert Configuration:
Customizable alert messages
Multiple alert conditions
Option to enable/disable specific alerts
LIMITATIONS
⚠️ Important Considerations:
Results may vary across different market conditions
Historical performance does not guarantee future results
Always backtest strategy before live trading
Consider complementing with additional analysis tools
BEST PRACTICES
• Recommended Timeframes:
Daily charts for long-term strategies
4-hour charts for swing trading
1-hour charts for short-term trading
• Risk Management Tips:
Start with small position sizes
Always use TP/SL in live trading
Monitor market volatility before entering trades
TROUBLESHOOTING
• Common Issues:
Ensure proper chart resolution
Verify alert conditions are enabled
Check for conflicting indicators
• Performance Optimization:
Use appropriate timeframe for your strategy
Adjust indicator parameters based on market conditions
Monitor for potential overfitting
[blackcat] L3 Hull SeekerOVERVIEW
The L3 Hull Seeker is a comprehensive trading indicator that combines Hull Moving Average (HMA) analysis with robust position management and risk control features. This script is designed to help traders identify potential entry and exit points while maintaining strict risk management protocols.
KEY FEATURES
• Hull MA Analysis:
Advanced Hull Moving Average calculations
Separate Hull MA lines for Close and Open prices
Visual color coding for trend direction
Customizable length parameter for flexibility
• Position Tracking:
Real-time monitoring of long and short positions
Maximum position limit control
Clear position status indicators on chart
• Risk Management System:
User-defined Take Profit percentage
User-defined Stop Loss percentage
Optional activation of TP/SL features
Dynamic label markers for important levels
• Alert System:
Buy/Sell entry alerts
Take Profit/Stop Loss exit alerts
Position status changes
HOW TO USE
Setup Initial Parameters:
Hull MA Length: Adjust based on your trading timeframe
Take Profit Percentage: Set according to your risk tolerance
Stop Loss Percentage: Define your maximum acceptable loss
Enable/Disable Features:
Toggle Take Profit/Stop Loss options as needed
Adjust alert conditions for your trading style
Monitor Trading Signals:
Watch for crossover/crossunder signals
Track position status through labels
Monitor entry and exit alerts
Manage Risk:
Use TP/SL features to control position size
Monitor pyramiding limits
Review position status regularly
TRADE MANAGEMENT
• Entry Conditions:
Long Entry: HullMA_close crosses above HullMA_open
Short Entry: HullMA_close crosses below HullMA_open
• Exit Conditions:
Take Profit: Price reaches defined percentage above/below entry
Stop Loss: Price reaches defined percentage below/above entry
• Position Control:
Limited to one position at a time
Automatic position tracking
Clear visual indication of current trades
TECHNICAL DETAILS
• Hull MA Calculation:
Uses WMA (Weighted Moving Average) for precise calculations
Optimized for trend-following strategies
Smoothed Hull MA lines for better readability
• Label System:
Clear buy/sell markers
Take Profit and Stop Loss indicators
Real-time position status updates
• Alert Configuration:
Customizable alert messages
Multiple alert conditions
Option to enable/disable specific alerts
LIMITATIONS
⚠️ Important Considerations:
Results may vary across different market conditions
Historical performance does not guarantee future results
Always backtest strategy before live trading
Consider complementing with additional analysis tools
BEST PRACTICES
• Recommended Timeframes:
Daily charts for long-term strategies
4-hour charts for swing trading
1-hour charts for short-term trading
• Risk Management Tips:
Start with small position sizes
Always use TP/SL in live trading
Monitor market volatility before entering trades
TROUBLESHOOTING
• Common Issues:
Ensure proper chart resolution
Verify alert conditions are enabled
Check for conflicting indicators
• Performance Optimization:
Use appropriate timeframe for your strategy
Adjust indicator parameters based on market conditions
Monitor for potential overfitting
RSI Divergence Strategy - AliferCryptoStrategy Overview
The RSI Divergence Strategy is designed to identify potential reversals by detecting regular bullish and bearish divergences between price action and the Relative Strength Index (RSI). It automatically enters positions when a divergence is confirmed and manages risk with configurable stop-loss and take-profit levels.
Key Features
Automatic Divergence Detection: Scans for RSI pivot lows/highs vs. price pivots using user-defined lookback windows and bar ranges.
Dual SL/TP Methods:
- Swing-based: Stops placed a configurable percentage beyond the most recent swing high/low.
- ATR-based: Stops placed at a multiple of Average True Range, with a separate risk/reward multiplier.
Long and Short Entries: Buys on bullish divergences; sells short on bearish divergences.
Fully Customizable: Input groups for RSI, divergence, swing, ATR, and general SL/TP settings.
Visual Plotting: Marks divergences on chart and plots stop-loss (red) and take-profit (green) lines for active trades.
Alerts: Built-in alert conditions for both bullish and bearish RSI divergences.
Detailed Logic
RSI Calculation: Computes RSI of chosen source over a specified period.
Pivot Detection:
- Identifies RSI pivot lows/highs by scanning a lookback window to the left and right.
- Uses ta.barssince to ensure pivots are separated by a minimum/maximum number of bars.
Divergence Confirmation:
- Bullish: Price makes a lower low while RSI makes a higher low.
- Bearish: Price makes a higher high while RSI makes a lower high.
Entry:
- Opens a Long position when bullish divergence is true.
- Opens a Short position when bearish divergence is true.
Stop-Loss & Take-Profit:
- Swing Method: Computes the recent swing high/low then adjusts by a percentage margin.
- ATR Method: Uses the current ATR × multiplier applied to the entry price.
- Take-Profit: Calculated as entry price ± (risk × R/R ratio).
Exit Orders: Uses strategy.exit to place bracket orders (stop + limit) for both long and short positions.
Inputs and Configuration
RSI Settings: Length & price source for the RSI.
Divergence Settings: Pivot lookback parameters and valid bar ranges.
SL/TP Settings: Choice between Swing or ATR method.
Swing Settings: Swing lookback length, margin (%), and risk/reward ratio.
ATR Settings: ATR length, stop multiplier, and risk/reward ratio.
Usage Notes
Adjust the Pivot Lookback and Range values to suit the volatility and timeframe of your market.
Use higher ATR multipliers for wider stops in choppy conditions, or tighten swing margins in trending markets.
Backtest different R/R ratios to find the balance between win rate and reward.
Disclaimer
This script is for educational purposes only and does not constitute financial advice. Trading carries significant risk and you may lose more than your initial investment. Always conduct your own research and consider consulting a professional before making any trading decisions.
Bullish and Bearish Breakout Alert for Gold Futures PullbackBelow is a Pine Script (version 6) for TradingView that includes both bullish and bearish breakout conditions for my intraday trading strategy on micro gold futures (MGC). The strategy focuses on scalping two-legged pullbacks to the 20 EMA or key levels with breakout confirmation, tailored for the Apex Trader Funding $300K challenge. The script accounts for the Daily Sentiment Index (DSI) at 87 (overbought, favoring pullbacks). It generates alerts for placing stop-limit orders for 175 MGC contracts, ensuring compliance with Apex’s rules ($7,500 trailing threshold, $20,000 profit target, 4:59 PM ET close).
Script Requirements
Version: Pine Script v6 (latest for TradingView, April 2025).
Purpose:
Bullish: Alert when price breaks above a rejection candle’s high after a two-legged pullback to the 20 EMA in a bullish trend (price above 20 EMA, VWAP, higher highs/lows).
Bearish: Alert when price breaks below a rejection candle’s low after a two-legged pullback to the 20 EMA in a bearish trend (price below 20 EMA, VWAP, lower highs/lows).
Context: 5-minute MGC chart, U.S. session (8:30 AM–12:00 PM ET), avoiding overbought breakouts above $3,450 (DSI 87).
Output: Alerts for stop-limit orders (e.g., “Buy: Stop=$3,377, Limit=$3,377.10” or “Sell: Stop=$3,447, Limit=$3,446.90”), quantity 175 MGC.
Apex Compliance: 175-contract limit, stop-losses, one-directional news trading, close by 4:59 PM ET.
How to Use the Script in TradingView
1. Add Script:
Open TradingView (tradingview.com).
Go to “Pine Editor” (bottom panel).
Copy the script from the content.
Click “Add to Chart” to apply to your MGC 5-minute chart .
2. Configure Chart:
Symbol: MGC (Micro Gold Futures, CME, via Tradovate/Apex data feed).
Timeframe: 5-minute (entries), 15-minute (trend confirmation, manually check).
Indicators: Script plots 20 EMA and VWAP; add RSI (14) and volume manually if needed .
3. Set Alerts:
Click the “Alert” icon (bell).
Add two alerts:
Bullish Breakout: Condition = “Bullish Breakout Alert for Gold Futures Pullback,” trigger = “Once Per Bar Close.”
Bearish Breakout: Condition = “Bearish Breakout Alert for Gold Futures Pullback,” trigger = “Once Per Bar Close.”
Customize messages (default provided) and set notifications (e.g., TradingView app, SMS).
Example: Bullish alert at $3,377 prompts “Stop=$3,377, Limit=$3,377.10, Quantity=175 MGC” .
4. Execute Orders:
Bullish:
Alert triggers (e.g., stop $3,377, limit $3,377.10).
In TradingView’s “Order Panel,” select “Stop-Limit,” set:
Stop Price: $3,377.
Limit Price: $3,377.10.
Quantity: 175 MGC.
Direction: Buy.
Confirm via Tradovate.
Add bracket order (OCO):
Stop-loss: Sell 175 at $3,376.20 (8 ticks, $1,400 risk).
Take-profit: Sell 87 at $3,378 (1:1), 88 at $3,379 (2:1) .
Bearish:
Alert triggers (e.g., stop $3,447, limit $3,446.90).
Select “Stop-Limit,” set:
Stop Price: $3,447.
Limit Price: $3,446.90.
Quantity: 175 MGC.
Direction: Sell.
Confirm via Tradovate.
Add bracket order:
Stop-loss: Buy 175 at $3,447.80 (8 ticks, $1,400 risk).
Take-profit: Buy 87 at $3,446 (1:1), 88 at $3,445 (2:1) .
5. Monitor:
Green triangles (bullish) or red triangles (bearish) confirm signals.
Avoid bullish entries above $3,450 (DSI 87, overbought) or bearish entries below $3,296 (support) .
Close trades by 4:59 PM ET (set 4:50 PM alert) .
Supertrend Hombrok BotSupertrend Hombrok Bot – Automated Trading Strategy for Dynamic Market Conditions
This trading strategy script has been developed to operate automatically based on detailed market conditions. It combines the popular Supertrend indicator, RSI (Relative Strength Index), Volume, and ATR (Average True Range) to determine the best entry and exit points while maintaining proper risk management.
Key Features:
Supertrend as the Base: Uses the Supertrend indicator to identify the market's trend direction, generating buy signals when the market is in an uptrend and sell signals when in a downtrend.
RSI Filter: The RSI is used to determine overbought and oversold conditions, helping to avoid entries in extreme market conditions. Entries are avoided when RSI > 70 (overbought) and RSI < 30 (oversold), reducing the risk of false movements.
Volume Filter: The strategy checks if the trading volume is above the average multiplied by a user-defined factor. This ensures that only significant movements, with higher liquidity, are considered.
Candle Body Size: The strategy filters only candles with a body large enough relative to the ATR (Average True Range), ensuring that the price movements on the chart have sufficient strength.
Risk Management: The bot is configured to operate with an adjustable Risk/Reward Ratio (R:R). This means that for each trade, both Take Profit (TP) and Stop Loss (SL) are adjusted based on the market's volatility as measured by the ATR.
Automatic Entries and Exits: The script automatically executes entries based on the specified conditions and exits with predefined Stop Loss and Take Profit levels, ensuring risk is controlled for each trade.
How It Works:
Buy Condition: Triggered when the market is in an uptrend (Supertrend), the volume is above the adjusted average, the candle body is strong enough, and the RSI is below the overbought level.
Sell Condition: Triggered when the market is in a downtrend (Supertrend), the volume is above the adjusted average, the candle body is strong enough, and the RSI is above the oversold level.
Alerts:
Buy and Sell Alerts are configured with detailed information, including Stop Loss and Take Profit values, allowing the user to receive notifications when trading conditions are met.
Capital Management:
The capital per trade can be adjusted based on account size and risk profile.
Important Note:
Always test before trading with real capital: While the strategy has been designed based on solid technical analysis methods, always perform tests in real-time market conditions with demo accounts before applying the bot in live trading.
Disclaimer: This script is a tool to assist in the trading process and does not guarantee profit. Past performance is not indicative of future results, and the trader is always responsible for their investment decisions.
Vinicius Setup ATR
Description:
This script is a strategy based on the Supertrend indicator combined with volume analysis, candle strength, and RSI. Its goal is to identify potential entry points for buy and sell trades based on technical criteria, without promising profitability or guaranteed results.
Script Components:
Supertrend: Used as the main trend compass. When the trend is positive (direction = 1), buy signals are considered; when negative (direction = -1), sell signals are considered.
Volume: Entries are only validated if the volume is above the average of the last 20 candles, adjusted with a 1.2 multiplier.
Candle Body: The candle body must be larger than a certain percentage of the ATR, ensuring sufficient strength and volatility.
RSI: Used as a filter to avoid trades in extreme overbought or oversold zones.
Support and Resistance: Identified based on simple pivots (5 periods before and after).
Customizable Parameters:
ATR Length and Multiplier: Controls the sensitivity of the Supertrend.
RSI Period: Adjusts the relative strength filter.
Minimum Volume and Candle Body: Settings to validate entry signals.
Entry Conditions:
Buy: Positive trend + strong candle + high volume + RSI below 70.
Sell: Negative trend + strong candle + high volume + RSI above 30.
Exit Conditions:
The trade is closed upon the appearance of an opposite signal.
Notes:
This is a technical system with no profit guarantees.
It is recommended to test with realistic capital values and parameters suited to your risk management.
The script is not optimized for specific profitability, but rather to support study and the construction of setups with objective criteria.
Dskyz (DAFE) AI Adaptive Regime - Beginners VersionDskyz (DAFE) AI Adaptive Regime - Pro: Revolutionizing Trading for All
Introduction
In the fast-paced world of financial markets, traders need tools that can keep up with ever-changing conditions while remaining accessible. The Dskyz (DAFE) AI Adaptive Regime - Pro is a groundbreaking TradingView strategy that delivers advanced, AI-driven trading capabilities to everyday traders. Available on TradingView (TradingView Scripts), this Pine Script strategy combines sophisticated market analysis with user-friendly features, making it a standout choice for both novice and experienced traders.
Core Functionality
The strategy is built to adapt to different market regimes—trending, ranging, volatile, or quiet—using a robust set of technical indicators, including:
Moving Averages (MA): Fast and slow EMAs to detect trend direction.
Average True Range (ATR): For dynamic stop-loss and volatility assessment.
Relative Strength Index (RSI) and MACD: Multi-timeframe confirmation of momentum and trend.
Average Directional Index (ADX): To identify trending markets.
Bollinger Bands: For assessing volatility and range conditions.
Candlestick Patterns: Recognizes patterns like bullish engulfing, hammer, and double bottoms, confirmed by volume spikes.
It generates buy and sell signals based on a scoring system that weighs these indicators, ensuring trades align with the current market environment. The strategy also includes dynamic risk management with ATR-based stops and trailing stops, as well as performance tracking to optimize future trades.
What Sets It Apart
The Dskyz (DAFE) AI Adaptive Regime - Pro distinguishes itself from other TradingView strategies through several unique features, which we compare to common alternatives below:
| Feature | Dskyz (DAFE) | Typical TradingView Strategies|
|---------|-------------|------------------------------------------------------------|
| Regime Detection | Automatically identifies and adapts to **four** market regimes | Often static or limited to trend/range detection |
| Multi‑Timeframe Analysis | Uses higher‑timeframe RSI/MACD for confirmation | Rarely incorporates multi‑timeframe data |
| Pattern Recognition | Detects candlestick patterns **with volume confirmation** | Limited or no pattern recognition |
| Dynamic Risk Management | ATR‑based stops and trailing stops | Often uses fixed stops or basic risk rules |
| Performance Tracking | Adjusts thresholds based on past performance | Typically static parameters |
| Beginner‑Friendly Presets | Aggressive, Conservative, Optimized profiles | Requires manual parameter tuning |
| Visual Cues | Color‑coded backgrounds for regimes | Basic or no visual aids |
The Dskyz strategy’s ability to integrate regime detection, multi-timeframe analysis, and user-friendly presets makes it uniquely versatile and accessible, addressing the needs of everyday traders who want professional-grade tools without the complexity.
-Key Features and Benefits
[Why It’s Ideal for Everyday Traders
⚡The Dskyz (DAFE) AI Adaptive Regime - Pro democratizes advanced trading by offering professional-grade tools in an accessible package. Unlike many TradingView strategies that require deep technical knowledge or fail in changing market conditions, this strategy simplifies complex analysis while maintaining robustness. Its presets and visual aids make it easy for beginners to start, while its adaptive features and performance tracking appeal to advanced traders seeking an edge.
🔄Limitations and Considerations
Market Dependency: Performance varies by market and timeframe. Backtesting is essential to ensure compatibility with your trading style.
Learning Curve: While presets simplify use, understanding regimes and indicators enhances effectiveness.
No Guaranteed Profits: Like all strategies, success depends on market conditions and proper execution. The Reddit discussion highlights skepticism about TradingView strategies’ universal success (Reddit Discussion).
Instrument Specificity: Optimized for futures (e.g., ES, NQ) due to fixed tick values. Test on other instruments like stocks or forex to verify compatibility.
📌Conclusion
The Dskyz (DAFE) AI Adaptive Regime - Pro is a revolutionary TradingView strategy that empowers everyday traders with advanced, AI-driven tools. Its ability to adapt to market regimes, confirm signals across timeframes, and manage risk dynamically. sets it apart from typical strategies. By offering beginner-friendly presets and visual cues, it makes sophisticated trading accessible without sacrificing power. Whether you’re a novice looking to trade smarter or a pro seeking a competitive edge, this strategy is your ticket to mastering the markets. Add it to your chart, backtest it, and join the elite traders leveraging AI to dominate. Trade like a boss today! 🚀
Use it with discipline. Use it with clarity. Trade smarter.
**I will continue to release incredible strategies and indicators until I turn this into a brand or until someone offers me a contract.
-Dskyz
Moving Average Shift WaveTrend StrategyMoving Average Shift WaveTrend Strategy
🧭 Overview
The Moving Average Shift WaveTrend Strategy is a trend-following and momentum-based trading system designed to be overlayed on TradingView charts. It executes trades based on the confluence of multiple technical conditions—volatility, session timing, trend direction, and oscillator momentum—to deliver logical and systematic trade entries and exits.
🎯 Strategy Objectives
Enter trades aligned with the prevailing long-term trend
Exit trades on confirmed momentum reversals
Avoid false signals using session timing and volatility filters
Apply structured risk management with automatic TP, SL, and trailing stops
⚙️ Key Features
Selectable MA types: SMA, EMA, SMMA (RMA), WMA, VWMA
Dual-filter logic using a custom oscillator and moving averages
Session and volatility filters to eliminate low-quality setups
Trailing stop, configurable Take Profit / Stop Loss logic
“In-wave flag” prevents overtrading within the same trend wave
Visual clarity with color-shifting candles and entry/exit markers
📈 Trading Rules
✅ Long Entry Conditions:
Price is above the selected MA
Oscillator is positive and rising
200-period EMA indicates an uptrend
ATR exceeds its median value (sufficient volatility)
Entry occurs between 09:00–17:00 (exchange time)
Not currently in an active wave
🔻 Short Entry Conditions:
Price is below the selected MA
Oscillator is negative and falling
200-period EMA indicates a downtrend
All other long-entry conditions are inverted
❌ Exit Conditions:
Take Profit or Stop Loss is hit
Opposing signals from oscillator and MA
Trailing stop is triggered
🛡️ Risk Management Parameters
Pair: ETH/USD
Timeframe: 4H
Starting Capital: $3,000
Commission: 0.02%
Slippage: 2 pips
Risk per Trade: 2% of account equity (adjustable)
Total Trades: 224
Backtest Period: May 24, 2016 — April 7, 2025
Note: Risk parameters are fully customizable to suit your trading style and broker conditions.
🔧 Trading Parameters & Filters
Time Filter: Trades allowed only between 09:00–17:00 (exchange time)
Volatility Filter: ATR must be above its median value
Trend Filter: Long-term 200-period EMA
📊 Technical Settings
Moving Average
Type: SMA
Length: 40
Source: hl2
Oscillator
Length: 15
Threshold: 0.5
Risk Management
Take Profit: 1.5%
Stop Loss: 1.0%
Trailing Stop: 1.0%
👁️ Visual Support
MA and oscillator color changes indicate directional bias
Clear chart markers show entry and exit points
Trailing stops and risk controls are transparently managed
🚀 Strategy Improvements & Uniqueness
In-wave flag avoids repeated entries within the same trend phase
Filtering based on time, volatility, and trend ensures higher-quality trades
Dynamic high/low tracking allows precise trailing stop placement
Fully rule-based execution reduces emotional decision-making
💡 Inspirations & Attribution
This strategy is inspired by the excellent concept from:
ChartPrime – “Moving Average Shift”
It expands on the original idea with advanced trade filters and trailing logic.
Source reference:
📌 Summary
The Moving Average Shift WaveTrend Strategy offers a rule-based, reliable approach to trend trading. By combining trend and momentum filters with robust risk controls, it provides a consistent framework suitable for various market conditions and trading styles.
⚠️ Disclaimer
This script is for educational purposes only. Trading involves risk. Always use proper backtesting and risk evaluation before applying in live markets.
Trailing Monster StrategyTrailing Monster Strategy
This is an experimental trend-following strategy that incorporates a custom adaptive moving average (PKAMA), RSI-based momentum filtering, and dynamic trailing stop-loss logic. It is designed for educational and research purposes only, and may require further optimization or risk management considerations prior to live deployment.
Strategy Logic
The strategy attempts to participate in sustained price trends by combining:
- A Power Kaufman Adaptive Moving Average (PKAMA) for dynamic trend detection,
- RSI and Simple Moving Average (SMA) filters for market condition confirmation,
- A delayed trailing stop-loss to manage exits once a trade is in profit.
Entry Conditions
Long Entry:
- RSI exceeds the overbought threshold (default: 70),
- Price is trading above the 200-period SMA,
- PKAMA slope is positive (indicating upward momentum),
- A minimum number of bars have passed since the last entry.
Short Entry:
- RSI falls below the oversold threshold (default: 30),
- Price is trading below the 200-period SMA,
- PKAMA slope is negative (indicating downward momentum),
-A minimum number of bars have passed since the last entry.
Exit Conditions
- A trailing stop-loss is applied once the position has been open for a user-defined number of bars.
- The trailing distance is calculated as a fixed percentage of the average entry price.
Technical Notes
This script implements a custom version of the Power Kaufman Adaptive Moving Average (PKAMA), conceptually inspired by alexgrover’s public implementation on TradingView .
Unlike traditional moving averages, PKAMA dynamically adjusts its responsiveness based on recent market volatility, allowing it to better capture trend changes in fast-moving assets like altcoins.
Disclaimer
This strategy is provided for educational purposes only.
It is not financial advice, and no guarantee of profitability is implied.
Always conduct thorough backtesting and forward testing before using any strategy in a live environment.
Adjust inputs based on your individual risk tolerance, asset class, and trading style.
Feedback is encouraged. You are welcome to fork and modify this script to suit your own preferences and market approach.
Adaptive Fibonacci Pullback System -FibonacciFluxAdaptive Fibonacci Pullback System (AFPS) - FibonacciFlux
This work is licensed under a Attribution-NonCommercial-ShareAlike 4.0 International (CC BY-NC-SA 4.0). Original concepts by FibonacciFlux.
Abstract
The Adaptive Fibonacci Pullback System (AFPS) presents a sophisticated, institutional-grade algorithmic strategy engineered for high-probability trend pullback entries. Developed by FibonacciFlux, AFPS uniquely integrates a proprietary Multi-Fibonacci Supertrend engine (0.618, 1.618, 2.618 ratios) for harmonic volatility assessment, an Adaptive Moving Average (AMA) Channel providing dynamic market context, and a synergistic Multi-Timeframe (MTF) filter suite (RSI, MACD, Volume). This strategy transcends simple indicator combinations through its strict, multi-stage confluence validation logic. Historical simulations suggest that specific MTF filter configurations can yield exceptional performance metrics, potentially achieving Profit Factors exceeding 2.6 , indicative of institutional-level potential, while maintaining controlled risk under realistic trading parameters (managed equity risk, commission, slippage).
4 hourly MTF filtering
1. Introduction: Elevating Pullback Trading with Adaptive Confluence
Traditional pullback strategies often struggle with noise, false signals, and adapting to changing market dynamics. AFPS addresses these challenges by introducing a novel framework grounded in Fibonacci principles and adaptive logic. Instead of relying on static levels or single confirmations, AFPS seeks high-probability pullback entries within established trends by validating signals through a rigorous confluence of:
Harmonic Volatility Context: Understanding the trend's stability and potential turning points using the unique Multi-Fibonacci Supertrend.
Adaptive Market Structure: Assessing the prevailing trend regime via the AMA Channel.
Multi-Dimensional Confirmation: Filtering signals with lower-timeframe Momentum (RSI), Trend Alignment (MACD), and Market Conviction (Volume) using the MTF suite.
The objective is to achieve superior signal quality and adaptability, moving beyond conventional pullback methodologies.
2. Core Methodology: Synergistic Integration
AFPS's effectiveness stems from the engineered synergy between its core components:
2.1. Multi-Fibonacci Supertrend Engine: Utilizes specific Fibonacci ratios (0.618, 1.618, 2.618) applied to ATR, creating a multi-layered volatility envelope potentially resonant with market harmonics. The averaged and EMA-smoothed result (`smoothed_supertrend`) provides a robust, dynamic trend baseline and context filter.
// Key Components: Multi-Fibonacci Supertrend & Smoothing
average_supertrend = (supertrend1 + supertrend2 + supertrend3) / 3
smoothed_supertrend = ta.ema(average_supertrend, st_smooth_length)
2.2. Adaptive Moving Average (AMA) Channel: Provides dynamic market context. The `ama_midline` serves as a key filter in the entry logic, confirming the broader trend bias relative to adaptive price action. Extended Fibonacci levels derived from the channel width offer potential dynamic S/R zones.
// Key Component: AMA Midline
ama_midline = (ama_high_band + ama_low_band) / 2
2.3. Multi-Timeframe (MTF) Filter Suite: An optional but powerful validation layer (RSI, MACD, Volume) assessed on a lower timeframe. Acts as a **validation cascade** – signals must pass all enabled filters simultaneously.
2.4. High-Confluence Entry Logic: The core innovation. A pullback entry requires a specific sequence and validation:
Price interaction with `average_supertrend` and recovery above/below `smoothed_supertrend`.
Price confirmation relative to the `ama_midline`.
Simultaneous validation by all enabled MTF filters.
// Simplified Long Entry Logic Example (incorporates key elements)
long_entry_condition = enable_long_positions and
(low < average_supertrend and close > smoothed_supertrend) and // Pullback & Recovery
(close > ama_midline and close > ama_midline) and // AMA Confirmation
(rsi_filter_long_ok and macd_filter_long_ok and volume_filter_ok) // MTF Validation
This strict, multi-stage confluence significantly elevates signal quality compared to simpler pullback approaches.
1hourly filtering
3. Realistic Implementation and Performance Potential
AFPS is designed for practical application, incorporating realistic defaults and highlighting performance potential with crucial context:
3.1. Realistic Default Strategy Settings:
The script includes responsible default parameters:
strategy('Adaptive Fibonacci Pullback System - FibonacciFlux', shorttitle = "AFPS", ...,
initial_capital = 10000, // Accessible capital
default_qty_type = strategy.percent_of_equity, // Equity-based risk
default_qty_value = 4, // Default 4% equity risk per initial trade
commission_type = strategy.commission.percent,
commission_value = 0.03, // Realistic commission
slippage = 2, // Realistic slippage
pyramiding = 2 // Limited pyramiding allowed
)
Note: The default 4% risk (`default_qty_value = 4`) requires careful user assessment and adjustment based on individual risk tolerance.
3.2. Historical Performance Insights & Institutional Potential:
Backtesting provides insights into historical behavior under specific conditions (always specify Asset/Timeframe/Dates when sharing results):
Default Performance Example: With defaults, historical tests might show characteristics like Overall PF ~1.38, Max DD ~1.16%, with potential Long/Short performance variance (e.g., Long PF 1.6+, Short PF < 1).
Optimized MTF Filter Performance: Crucially, historical simulations demonstrate that meticulous configuration of the MTF filters (particularly RSI and potentially others depending on market) can significantly enhance performance. Under specific, optimized MTF filter settings combined with appropriate risk management (e.g., 7.5% risk), historical tests have indicated the potential to achieve **Profit Factors exceeding 2.6**, alongside controlled drawdowns (e.g., ~1.32%). This level of performance, if consistently achievable (which requires ongoing adaptation), aligns with metrics often sought in institutional trading environments.
Disclaimer Reminder: These results are strictly historical simulations. Past performance does not guarantee future results. Achieving high performance requires careful parameter tuning, adaptation to changing markets, and robust risk management.
3.3. Emphasizing Risk Management:
Effective use of AFPS mandates active risk management. Utilize the built-in Stop Loss, Take Profit, and Trailing Stop features. The `pyramiding = 2` setting requires particularly diligent oversight. Do not rely solely on default settings.
4. Conclusion: Advancing Trend Pullback Strategies
The Adaptive Fibonacci Pullback System (AFPS) offers a sophisticated, theoretically grounded, and highly adaptable framework for identifying and executing high-probability trend pullback trades. Its unique blend of Fibonacci resonance, adaptive context, and multi-dimensional MTF filtering represents a significant advancement over conventional methods. While requiring thoughtful implementation and risk management, AFPS provides discerning traders with a powerful tool potentially capable of achieving institutional-level performance characteristics under optimized conditions.
Acknowledgments
Developed by FibonacciFlux. Inspired by principles of Fibonacci analysis, adaptive averaging, and multi-timeframe confirmation techniques explored within the trading community.
Disclaimer
Trading involves substantial risk. AFPS is an analytical tool, not a guarantee of profit. Past performance is not indicative of future results. Market conditions change. Users are solely responsible for their decisions and risk management. Thorough testing is essential. Deploy at your own considered risk.
Regime Filter IndicatorRegime Filter – Crypto Market Trend Indicator
📊 Overview
The Regime Filter is a powerful market analysis indicator designed specifically for crypto trading. It helps traders identify whether the market is in a bullish or bearish phase by analyzing key assets in the cryptocurrency market, including Bitcoin (BTC), Bitcoin Dominance (BTC.D), and the Altcoin Market (TOTAL3). The indicator compares these assets against their respective Simple Moving Averages (SMA) to determine the overall market regime, allowing traders to make more informed decisions.
🔍 How It Works
The Regime Filter evaluates three main components to determine the market's sentiment:
1. BTC Dominance (BTC.D) vs. 40 SMA (Medium Timeframe)
The Bitcoin Dominance (BTC.D) is compared to its 40-period SMA on a mid-timeframe (e.g.,
1-hour). If BTC.D is below the 40 SMA, it indicates that altcoins are performing well relative
to Bitcoin, suggesting a bullish altcoin market. If BTC.D is above the 40 SMA, Bitcoin is
gaining dominance, indicating a potential bearish phase for altcoins.
2. TOTAL3 Market Cap vs. 100 SMA (Medium Timeframe)
The TOTAL3 index, which tracks the total market capitalization of all cryptocurrencies except
Bitcoin and Ethereum, is compared to its 100-period SMA. A bullish signal occurs when TOTAL3
is above the 100 SMA, indicating strength in altcoins, while a bearish signal occurs when
TOTAL3 is below the 100 SMA, signaling a potential weakness in the altcoin market.
3. BTC Price vs. 200 SMA (Higher Timeframe)
The current Bitcoin price is compared to its 200-period Simple Moving Average (SMA) on a
higher timeframe (e.g., 4-hour). A bullish signal is given when the BTC price is above the 200
SMA, and a bearish signal when it's below.
🟢 Bullish Market Conditions
The market is considered bullish when:
- BTC Dominance (BTC.D) is below the 40 SMA, suggesting altcoins are gaining momentum.
- TOTAL3 Market Cap is above the 100 SMA, signaling strength in the altcoin market.
- BTC price is above the 200 SMA, indicating an uptrend in Bitcoin.
In these conditions, the background turns green 🟢, and a "Bullish" label is displayed on the chart.
🔴 Bearish Market Conditions
The market is considered bearish when:
- BTC Dominance (BTC.D) is above the 40 SMA, indicating Bitcoin is outperforming altcoins.
- TOTAL3 Market Cap is below the 100 SMA, signaling weakness in altcoins.
- BTC price is below the 200 SMA, indicating a downtrend in Bitcoin.
In these conditions, the background turns red 🔴, and a "Bearish" label appears on the chart.
⚙ Customization Options
- The Regime Filter offers flexibility for traders:
- Enable or Disable Specific SMAs: Customize the indicator by enabling or disabling the 200 SMA for Bitcoin, the 40 SMA for BTC Dominance, and the 100 SMA for TOTAL3.
- Adjust Timeframes: Choose the timeframes for each of the moving averages to suit your preferred trading strategy.
- Real-Time Data Adjustments: The indicator updates in real-time to reflect current market conditions, ensuring timely analysis.
📈 Best Use Cases
- Trend Confirmation: The Regime Filter is ideal for confirming the market's overall trend,
helping traders to align their positions with the dominant market sentiment.
- Trade Entry/Exit Signals: Use the indicator to identify favorable entry or exit points based on
whether the market is in a bullish or bearish phase.
- Market Overview: Gain a quick understanding of the broader crypto market, with a focus on
Bitcoin and altcoins, to make more strategic decisions.
⚠️ Important Notes
Trend-Following Indicator: The Regime Filter is a trend-following tool, meaning it works best in strong trending markets. It may not perform well in choppy, sideways markets.
Risk Management: This indicator is designed to assist in identifying market trends, but it does not guarantee profits. Always apply sound risk management strategies and use additional indicators when making trading decisions.
Not a Profit Guarantee: While this indicator can help identify potential market trends, no trading tool or strategy guarantees profits. Please trade responsibly and ensure that your decisions are based on comprehensive analysis and risk tolerance.


