PA Builder [PrimeAutomation]1. PA Builder – Overview
PA Builder is not a fixed strategy; it’s a framework for building strategies. Instead of giving traders one rigid system, it provides a toolbox where entries, exits, filters, risk parameters, and automation rules can all be defined and combined. The core philosophy is confluence: the idea that a trade should only be taken when multiple independent signals agree. The Builder is built around this principle. Every module; trend, reactors, bands, reversals, volume, structure, divergences, externals can be treated as one layer of confidence. The stronger the alignment across layers, the higher the quality of the setup in theory.
In practice, this means PA Builder encourages traders to think in terms of “confluence,” not single indicators. Trend and positioning define whether you should even be looking for longs or shorts. Timing tools such as bands, reversals and candlestick structures determine when inside that broader bias you want to engage. Confirmation tools like volume and flow tell you whether capital is actually supporting the move. Filter systems then ensure that even if everything looks good locally, you still respect higher-timeframe or opposing warnings. The Builder’s philosophy is simple: enter less often, but only when conditions are genuinely in your favour.
2. Core Entry Signal Components
The entry logic in PA Builder is built on a set of signal engines that can be combined in many ways. Trend Signals form a natural foundation. They use low-lag low-pass filters, borrowed from audio signal processing, to extract directional bias from price without the classic delay of classical moving averages. The sensitivity parameter controls how reactive this engine is: lower values favour cleaner trends and fewer whipsaws, while higher values are better suited to short-term intraday trading where speed matters more than smoothness. Many traders start by requiring that Trend Signals show “all bullish” or “all bearish” before allowing any entries in that direction.
Trend signals firing short positions
On top of this directional backbone, the Dynamic Reactor behaves as an adaptive baseline. It accelerates in volatile phases and slows down during consolidation, effectively acting as a moving reference point for both trend and price position. A typical use of this module is to insist that, for long trades, the price sits above a bullish reactor; for shorts, below a bearish one. At the higher-timeframe level, the Quantum Reactor provides a VWAP-style reference that can be anchored to larger candles than the chart you are trading. A common configuration is to trade on a 15-minute chart while requiring that price is above the 4-hour Quantum Reactor for longs or below it for shorts. The “fast” and “slow” options determine how quickly this reference adapts to new information.
Timing is then refined with tools like Quantum Bands, reversals and candle structure analysis. Quantum Bands identify extremes within the current environment. In an uptrend, a tag of the lower band can be treated as a pullback rather than a breakdown; in a downtrend, the upper band acts like a shorting zone. Many traders combine “trend up and above higher-timeframe reactor” with “price temporarily below lower band” to construct a mean-reversion entry inside a larger uptrend. Reversal detection modules examine recent bars to find turning points, with shorter lookbacks capturing fast flips and longer lookbacks tracking deeper structural changes. Candle structure logic goes beyond classical candlestick names and instead focuses on whether price action confirms follow-through or reversion behaviour, with options like “2X” modes that wait for two successive confirmations before acting.
Before and after filtering using reactor applied.
Additional confirmation layers come from Volume Matrix, Money Flow, OSC True7 and divergence detection. Volume and flow tools answer whether actual capital is participating in the move or whether price is drifting on thin activity. OSC True7 categorises the state of the trend into intuitive buckets, strong, healthy, neutral, or exhausted, making it easier to avoid chasing extremes. Divergences between price and momentum can be used either as entry triggers in contrarian systems or as hard filters that block trades when warning signs are present. Finally, two external indicator inputs make it possible to integrate RSI, MACD, custom indicators or even other strategies into the Builder, either as simple thresholds or as comparative logic between two external sources (for example, requiring a fast EMA to be above a slow EMA before allowing longs).
3. Exit System & Trade Management
The exit systems in PA Builder are designed to be as vital as the entry logic. It assumes exits are not an afterthought, but half of the edge. Instead of forcing a single take profit point, the system uses a three-tier structure where you can assign different portions of the position to different targets. A common pattern is to scale out a small portion early (for example at one ATR), another portion at an intermediate level, and keep the largest slice for a deeper move. This creates a natural balance: you book something early to reduce emotional stress, while leaving room to participate in the full potential of a trend.
Targets can be defined using ATR multiples or risk-to-reward ratios that are directly tied to the initial stop distance. Using ATR keeps exits proportional to current volatility. A two ATR target in a quiet environment is very different in absolute price distance from the same multiple in a high-volatility environment, yet conceptually it represents the same “size” move. Risk-to-reward exits build on this by ensuring that if you risk one unit (1R), the reward targets are set at predefined multiples of that risk. This enforces positive expectancy at the structural level: the strategy cannot generate entries with inherently negative payoffs.
Once price begins to move in your favour, trailing logic takes over if you choose to enable it. Trailing can begin immediately from entry or only after a target has been hit. Many users prefer to let TP1 and TP2 behave as fixed profit points and then apply a trailing stop or trailing take profit to the final remainder. That way, routine winners are banked mechanically, while occasional explosive moves can be ridden for as long as the market allows. The breakeven module supports this behaviour by automatically moving stops to entry (or slightly through entry into profit) after a specified condition such as TP1 being hit. This transforms the risk profile mid trade: once breakeven has been secured, remaining size can be managed with much less psychological pressure.
The system also recognises the cost of time. Kill Switch functionality exits trades that have been open too long under mediocre conditions, typically when they are in modest profit but not progressing. This protects you from capital being tied up while better opportunities appear elsewhere. Underlying all of this are several trailing stop mechanisms: percentage-based, tick-based for very short-term strategies, TP linked trailing that activates only once a certain profit threshold has been achieved, and ATR based trailing that automatically scales the trail distance with volatility. Each method serves a slightly different profile of strategy, but all share the same aim: preserve gains and limit downside in a structured way rather than rely on discretionary judgement after the fact.
4. Filters and Risk Management
The filter systems in PA Builder formalise the idea that good trading is often about knowing when not to act. “Do Not Trade” conditions can be configured so that even a perfectly aligned bullish entry stack is overridden if certain bearish evidence is present. These can include higher timeframe reversal structures, powerful opposing divergences, or conflicting signals in key modules. By assigning conditions specifically to “Do Not Long” and “Do Not Short” rather than only to entries, you create asymmetry: buying requires bullish evidence and an absence of strong bearish warnings; selling requires the mirror.
Volatility filters extend this logic to the regime level. Some strategies are inherently suited to low volatility, range bound environments where fading extremes is profitable; others require expansion and energy to function properly. By binding trading permission to volatility ranges, you ensure that a mean-reversion system does not blindly attempt to fade a breakout, and that a momentum system does not spin its wheels in a dead, sideways market. You can even reference volatility from a higher timeframe than the one you trade, so that a five-minute strategy is still aware of the broader one-hour volatility regime it sits inside.
Applied DO NOT TRADE - removes poor signal
Risk management and position sizing are configured so each trade is expressed in units of risk rather than arbitrary size. Leverage, in this framework, is simply a scaling factor for capital efficiency; the actual risk per trade is still controlled by the distance between entry and stop and the percentage of equity you choose to expose. Reinvestment options then decide what proportion of accumulated profit is fed back into position sizing. A more aggressive reinvestment setting accelerates compounding but increases the amplitude of drawdowns; a more conservative one smooths the equity curve at the cost of slower growth. The Base Trade Value parameter ties all of this together by deciding how much nominal capital or how many contracts are committed per trade in light of your maximum allowed simultaneous positions and your intended use of leverage.
External exit conditions provide further flexibility. For example, you might design a system whose entries rely purely on PA Builder’s internal modules, but whose exits use RSI readings, moving average crosses, or a proprietary external indicator. The separation of entry and exit logic allows you to bolt on different behaviours at the tail end of trades while keeping your core signal engine intact. In all cases, the objective is the same: express risk in a controlled, repeatable way that can survive long stretches of unfavourable market conditions.
5. PDT, Cooldowns and Visual Modes
For traders subject to Pattern Day Trading rules, PA Builder includes a day-trade tracking system that counts business days correctly and respects the three-trades-in-five-days limit. This goes beyond simple compliance; it forces discipline. When intraday trading is heavily constrained, you are naturally pushed toward swing-oriented strategies with fewer, more selective entries. The tool visually marks your PDT status so you never inadvertently cross the line and trigger a lockout.
Cooldown systems address another reality: psychological vulnerability after streaks. Following several consecutive wins, many traders unconsciously loosen their standards, take marginal signals, oversize positions, or overtrade. A win-streak cooldown deliberately pauses trading after a configured number of wins, giving you time to reset. The same applies to losing streaks. After a run of losses, the strongest temptation is often to “make it back now,” which is exactly when discipline is weakest. A loss-streak cooldown enforces a break in activity during this high-risk emotional state, helping to prevent cascading damage driven by revenge trading.
Visualisation comes in two main modes. Classic mode emphasises precision: it draws explicit entry lines, stop levels, target levels and fill zones, making it easy to audit risk/reward on each trade, verify that the exit logic behaves as intended, and review historical trades in detail. Modern mode emphasises market feel: instead of focusing on exact levels, it colours candles and backgrounds to reflect momentum, profit state and dynamics.
This helps you see at a glance whether a strategy is operating in a smooth trending environment or a choppy, fragmented one, and whether current trades are broadly working or struggling. Many users develop and debug in Classic mode and then monitor live performance in Modern mode, so both representations become part of the workflow.
6. Strategy Design Workflow, Examples and Cautions
Designing with PA Builder is inherently iterative. You begin with a simple theory and a minimal configuration, perhaps just a trend filter and a basic stop/target structure, and run a backtest. You then examine where the system fails. If you see many losses occurring in counter-trend conditions, you add an additional directional filter or restrict entries with a higher-timeframe reactor condition. If you observe many small whipsaw losses, you might require candle structure confirmation or volume confirmation before allowing an entry. Each change is made one at a time and evaluated. This process gradually builds a layered system where every component has a clear purpose: some reduce drawdown, some increase win rate, some cut out only the worst trades, and others help capture more of the best ones.
A conservative swing strategy might need an agreement between short-term trend signals, a higher-timeframe Quantum position, and a bullish Dynamic Reactor state, while checking that volume supports the move and that no significant bearish reversals or divergences are present on higher timeframes. It might accept relatively few trades, but each trade would be tightly controlled, scaled out over several ATR-based targets and protected with breakeven and trailing logic. On the opposite end, an aggressive scalping configuration would relax some filters, favour faster sensitivities, use short lookback reversals, and tighten stops and targets dramatically, relying on high frequency and careful volatility filtering to maintain edge.
Throughout all of this, overfitting remains the main danger. The more parameters you tune and the more coincidental rules you add to make the backtest equity curve smoother, the more likely it is that you are capturing noise rather than a real, repeatable edge. Signs of overfitting include heavily optimised numeric values with no intuitive justification, large differences between in-sample and out-of-sample results, or strategies that work spectacularly in very specific regimes and collapse elsewhere. To mitigate this, keep strategies as simple as possible, test across different market regimes (bull, bear, range), and accept that robust systems usually look less “perfect” on the historical chart.
Bridging the gap from backtest to live trading is another critical step. Before risking capital, it is wise to paper trade the configuration for a number of trades to confirm that signal frequency, behaviour and execution align with expectations. When going live, starting with minimal size and gradually scaling up based on real-world performance helps manage both financial and psychological risk. If live results diverge significantly from backtest expectations due to slippage, fees, or changing market conditions, you can adjust, reduce size, or temporarily pause rather than commit fully to a failing configuration.
Ultimately, PA Builder is designed to be a tool for building structured, rules-driven trading systems. It gives you the tools to express your ideas, test them, refine them, and run them under controlled risk. It does not remove uncertainty or guarantee results, but it does provide a clear, transparent way to translate trading concepts into executable, testable logic, and to evolve those systems as markets change and your understanding deepens.
Cari dalam skrip untuk "profit"

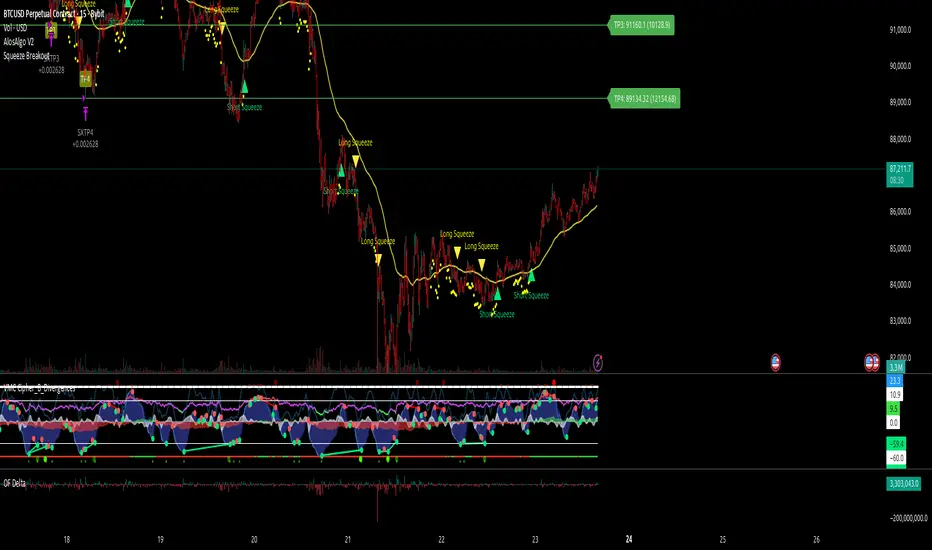
AlosAlgo V2 (BETA)— V2 BETA —
V2 – 2025-11-21 (Update)
• Rebuilt the core signal engine to remove repainting – higher-timeframe Heikin Ashi / Renko now use confirmed bars only for more stable signals & alerts.
• Added Trend Filter MA so longs are only taken above the MA and shorts only below (optional).
• Added MACD momentum filter and Price Action filter (Higher Low for longs, Lower High for shorts) to cut a lot of chop.
• Introduced a loss-streak “circuit breaker” – after X consecutive losing trades the strategy pauses for a set number of bars.
• New TP/SL engine with 2 modes: ATR-based or Fixed % moves, with 4 staged TPs plus an optional runner and break-even SL after TP2.
• Cleaned up TP/SL lines & labels so levels are fixed per trade and easier to read.
• General refactor for more realistic backtests, better live behaviour and easier parameter tuning compared to V1.
ABOUT
AlosAlgo V2 is a multi-timeframe trend + momentum strategy designed for BTC and other high-liquidity markets. It takes directional bias from a higher timeframe, then filters that bias with volatility, momentum and simple price-action structure before it ever opens a trade.
Purely rule-based, no AI / Bayesian / ML.
Core idea
– Use higher-timeframe structure for direction.
– Only trade when trend, momentum and basic price action agree.
– Manage exits with multiple TPs, an optional runner and a hard SL so risk is defined from the start.
Setups
Two main engines:
• Open/Close – Higher-timeframe Heikin Ashi body direction (close vs open) as the core trend signal.
• Renko – ATR-based Renko feed with EMA cross (fast vs slow) as the core trend signal.
Classic sideways filters (ATR + RSI) can be layered on top if you want to only trade in trending or ranging conditions.
Filters added in V2
• Trend Filter MA – Longs only above the MA, shorts only below (length configurable).
• Momentum Filter – Optional MACD filter; only takes longs when MACD is bullish and shorts when MACD is bearish.
• Price Action Filter – Optional HL/LH logic using pivots: longs after a Higher Low, shorts after a Lower High.
• Loss-Streak Circuit Breaker – After N losing trades in a row, the strategy pauses entries for a set number of bars to avoid bad regimes / tilt.
Risk & exits
Two TP/SL modes:
• ATR mode – SL and TP1–TP4 based on ATR at entry (stopFactor / profitFactor).
• Fixed % mode – SL and TP1–TP4 defined as % moves from entry.
On entry the strategy:
• Opens a single position.
• Places 4 staged TPs (TP1–TP4) with user-defined % sizing.
• Optionally leaves a “runner” managed only by SL and trend changes.
• Can move SL to break-even automatically after TP2 (toggle).
All TP/SL levels are locked at entry and drawn on the chart with labels so you can see exactly what the trade is trying to do.
Non-repainting behaviour
V2 is refactored to avoid the repainting behaviour that V1 used. Higher-timeframe and Renko data are taken from confirmed bars only, and entries are based on state (e.g. > / <) instead of repaint-prone crosses. Backtests are much closer to what you’ll see live, and alerts line up with executed trades more reliably.
How to use (suggested defaults)
• Setup: Open/Close
• TPSType: Fixed %
• Trend Filter: ON
• Momentum Filter: ON
• Price Action Filter: ON
• Sideways Filter: No Filtering
Then tweak TP/SL distances and filters per asset + timeframe, and forward-test before sizing up.
Disclaimer
This is not financial advice, not a guarantee of profit and not a “set and forget” money printer. Always forward-test, paper trade and tune risk before using real capital or automation. Markets change – this is a tool, not a promise.
Vital Wave 20-50Simplicity is almost always the most effective approach, and here I’m giving you a trend-following system that exploits the bullish bias of traditional markets and their trending nature, with very basic rules.
Rules (long entries only)
• Market entry: When the EMA 20 crosses above the EMA 50 (from below)
• Main market exit: When the EMA 20 crosses below the EMA 50 (from above)
• Fixed Stop Loss: Placed at the price level of the Lower Bollinger Band at the moment the trade is entered.
In my strategy, the primary exit is when the EMA 20 crosses below the EMA 50. However, this crossover can sometimes take a while to occur, and in the meantime the price may have already dropped significantly. The Stop Loss based on the Lower Bollinger Band is designed to limit losses in case the market moves sharply against the position without giving the bearish crossover signal in time. Having two exit conditions makes the strategy much more robust in terms of risk management.
Risk Management:
• Initial capital: $10,000
• Position size: 10% of available capital per trade
• Commissions: 0.1% on traded volume
• Stop Loss: Based on the Lower Bollinger Band
• Take Profit / Exit: When EMA 20 crosses below EMA 50
Recommended Markets:
XAUUSD (OANDA) (Daily)
Period: January 3, 1833 – November 23, 2025
Total Profit & Loss: +$6,030.62 USD (+57.57%)
Maximum Drawdown: $541.53 USD (3.83%)
Total Trades: 136
Winning Trades (Win Rate): 36.03% (49/136)
Profit Factor: 2.483
XAUUSD (OANDA) (12-hour)
Period: March 19, 2006 – November 23, 2025
Total Profit & Loss: +$1,209.56 USD (+11.89%)
Maximum Drawdown: $384.58 USD (3.61%)
Total Trades: 97
Winning Trades (Win Rate): 35.05% (34/97)
Profit Factor: 1.676
XAUUSD (OANDA) (8-hour)
Period: March 19, 2006 – November 23, 2025
Total Profit & Loss: +$1,179.36 USD (+11.81%)
Maximum Drawdown: $246.88 USD (2.32%)
Total Trades: 147
Winning Trades (Win Rate): 31.97% (47/147)
Profit Factor: 1.626
Tesla (NASDAQ) (4-hour)
Period: June 29, 2010 – November 23, 2025
Total Profit & Loss (Absolute): +$11,687.90 USD (+116.88%)
Maximum Drawdown: $922.05 USD (6.50%)
Total Trades: 68
Winning Trades (Win Rate): 39.71% (27/68)
Profit Factor: 4.156
Tesla (NASDAQ) (3-hour)
Total Profit & Loss: +$11,522.33 USD (+115.22%)
Maximum Drawdown: $1,247.60 USD (8.80%)
Total Trades: 114
Winning Trades: 33.33% (38/114)
Profit Factor: 2.811
Additional Recommendations
(These assets have shown good trending behavior with the same strategy across multiple timeframes):
• NVDA (15 min, 30 min, 1h, 2h, 3h, 4h, 6h, 8h, 12h, Daily)
• NFLX (1h, 2h, 3h, 4h, 6h, 8h, 12h, Daily)
• MA (1h, 2h, 3h, 4h, 6h, 8h, 12h, Daily)
• META (1h, 2h, 3h, 4h, 6h, 8h, 12h, Daily)
• AAPL (1h, 2h, 3h, 4h, 6h, 8h, 12h, Daily)
• SPY (12h, Daily)
About the Code
The user can modify:
• EMA periods (20 and 50 by default)
• Bollinger Bands length (20 periods)
• Standard deviation (2.0)
Visualization
• EMA 20: Blue line
• EMA 50: Red line
• Green background when EMA20 > EMA50 (bullish trend)
• Red background when EMA20 < EMA50 (bearish trend)
Important Note:
We can significantly increase the profit factor and overall profitability by risking a fixed percentage per trade instead of a fixed amount. This would prevent losses from fluctuating with changes in volatility.
This could be implemented by reducing position size or adjusting leverage based on the volatility percentage required for each trade, but I’m not sure if this is fully possible in Pine Script. In my other script, “ Golden Cross 50/200 EMA ,” I go deeper into this topic and provide examples.
I hope you enjoy this contribution. Best regards!

Mirror Blocks: StrategyMirror Blocks is an educational structural-wave model built around a unique concept:
the interaction of mirrored weighted moving averages (“blocks”) that reflect shifts in market structure as price transitions between layered symmetry zones.
Rather than attempting to “predict” markets, the Mirror Blocks framework visualizes how price behaves when it expands away from, contracts toward, or flips across stacked WMA structures. These mirrored layers form a wave-like block system that highlights transitional zones in a clean, mechanical way.
This strategy version allows you to study how these structural transitions behave in different environments and on different timeframes.
The goal is understanding wave structure, not generating signals.
How It Works
Mirror Blocks builds three mirrored layers:
Top Block (Structural High Symmetry)
Base Block (Neutral Wave)
Bottom Block (Structural Low Symmetry)
The relative position of these blocks — and how price interacts with them — helps visualize:
Compression and expansion
Reversal zones
Wave stability
Momentum transitions
Structure flips
A structure is considered bullish-stack aligned when:
Top > Base > Bottom
and bearish-stack aligned when:
Bottom > Base > Top
These formations create the core of the Mirror Blocks wave engine.
What the Strategy Version Adds
This version includes:
Long Only, Short Only, or Long & Short modes
Adjustable symmetry distance (Mirror Distance)
Configurable WMA smoothing length
Optional trend filter using fast/slow MA comparison
ENTER / EXIT / LONG / SHORT labels for structural transitions
Fixed stop-loss controls for research
A clean, transparent structure with no hidden components
It is optimized for educational chart study, not automated signals.
Intended Purpose
Mirror Blocks is meant to help traders:
Study structural transitions
Understand symmetry-based wave models
Explore how price interacts with mirrored layers
Examine reversals and expansions from a mechanical perspective
Conduct long and short backtesting for research
Develop a deeper sense of market rhythm
This is not a prediction model.
It is a visual and structural framework for understanding movement.
Backtesting Disclaimer
Backtest results can vary depending on:
Slippage settings
Commission settings
Timeframe
Asset volatility
Structural sensitivity parameters
Past performance does not guarantee future results.
Use this as a research tool only.
Warnings & Compliance
This script is educational.
It is not financial advice.
It does not provide signals.
It does not promise profitability.
The purpose is to help visualize structure, not predict price.
The strategy features are simply here to help users study how structural transitions behave under various conditions.
License
Released under the Michael Culpepper Gratitude License (2025).
Use and modify freely for education and research with attribution.
No resale.
No promises of profitability.
Purpose is understanding, not signals.

Hash Momentum Strategy# Hash Momentum Strategy
## 📊 Overview
The **Hash Momentum Strategy** is a professional-grade momentum trading system designed to capture strong directional price movements with precision timing and intelligent risk management. Unlike traditional EMA crossover strategies, this system uses momentum acceleration as its primary signal, resulting in earlier entries and better risk-to-reward ratios.
---
## ⚡ What Makes This Strategy Unique
### 1. Momentum-Based Entry System
Most strategies rely on lagging indicators like moving average crossovers. This strategy captures momentum *acceleration* - entering when price movement is gaining strength, not after the move has already happened.
### 2. Programmable Risk-to-Reward
Set your exact R:R ratio (1:2, 1:2.5, 1:3, etc.) and the strategy automatically calculates stop loss and take profit levels. No more guessing or manual calculations.
### 3. Smart Partial Profit Taking
Lock in profits at multiple stages:
- **First TP**: Take 50% off at 2R
- **Second TP**: Take 40% off at 2.5R
- **Final TP**: Let 10% ride to maximum target
This approach locks in gains while letting winners run.
### 4. Dynamic Momentum Threshold
Uses ATR (Average True Range) multiplied by your threshold setting to adapt to market volatility. Volatile markets = higher threshold. Quiet markets = lower threshold.
### 5. Trade Cooldown System
Prevents overtrading and revenge trading by enforcing a cooldown period between trades. Configurable from 1-24 bars.
### 6. Optional Session & Weekend Filters
Filter trades by Tokyo, London, and New York sessions. Optional weekend-off toggle to avoid low-liquidity periods.
---
## 🎯 How It Works
### Signal Generation
**STEP 1: Calculate Momentum**
- Momentum = Current Price - Price
- Check if Momentum > ATR × Threshold Multiplier
- Momentum must be accelerating (positive change in momentum)
**STEP 2: Confirm with EMA Trend Filter**
- Long: Price must be above EMA
- Short: Price must be below EMA
**STEP 3: Check Filters**
- Not in cooldown period
- Valid session (if enabled)
- Not weekend (if enabled)
**STEP 4: ENTRY SIGNAL TRIGGERED**
### Risk Management Example
**Example Long Trade:**
- Entry: $100
- Stop Loss: $97.80 (2.2% risk)
- Risk Amount: $2.20
**Take Profit Levels:**
- TP1: $104.40 (2R = $4.40) → Close 50%
- TP2: $105.50 (2.5R = $5.50) → Close 40%
- Final: $105.50 (2.5R) → Close remaining 10%
---
## ⚙️ Settings Guide
### Core Strategy
**Momentum Length** (Default: 13)
Number of bars for momentum calculation. Higher = stronger but fewer signals.
**Momentum Threshold** (Default: 2.25)
ATR multiplier. Higher = only trade biggest moves.
**Use EMA Trend Filter** (Default: ON)
Only long above EMA, short below EMA.
**EMA Length** (Default: 28)
Period for trend-confirming EMA.
### Filters
**Use Trading Session Filter** (Default: OFF)
Restrict trading to specific sessions.
**Tokyo Session** (Default: OFF)
Trade during Asian hours (00:00-09:00 JST).
**London Session** (Default: OFF)
Trade during European hours (08:00-17:00 GMT).
**New York Session** (Default: OFF)
Trade during US hours (08:00-17:00 EST).
**Weekend Off** (Default: OFF)
Disable trading on Saturdays and Sundays.
### Risk Management
**Stop Loss %** (Default: 2.2)
Fixed percentage stop loss from entry.
**Risk:Reward Ratio** (Default: 2.5)
Your target reward as multiple of risk.
**Use Partial Profit Taking** (Default: ON)
Take profits in stages.
**First TP R:R** (Default: 2.0)
First target as multiple of risk.
**First TP Size %** (Default: 50)
Percentage of position to close at TP1.
**Second TP R:R** (Default: 2.5)
Second target as multiple of risk.
**Second TP Size %** (Default: 40)
Percentage of position to close at TP2.
### Trade Management
**Use Trade Cooldown** (Default: ON)
Prevent overtrading.
**Cooldown Bars** (Default: 6)
Bars to wait after closing a trade.
---
## 🎨 Visual Elements
### Chart Indicators
🟢 **Green Dot** (below bar) = Long entry signal
🔴 **Red Dot** (above bar) = Short entry signal
🔵 **Blue X** (above bar) = Long position closed
🟠 **Orange X** (below bar) = Short position closed
**EMA Line** = Trend direction (green when bullish, red when bearish)
**White Line** = Entry price
**Red Line** = Stop loss level
**Green Lines** = Take profit levels (TP1, TP2, Final)
### Dashboard
When not in real-time mode, a dashboard displays:
- Current position (LONG/SHORT/FLAT)
- Entry price
- Stop loss price
- Take profit price
- R:R ratio
- Current momentum strength
- Total trades
- Win rate
- Net profit %
---
## 📈 Recommended Settings by Timeframe
### 1-Hour Timeframe (Default)
- Momentum Length: 13
- Momentum Threshold: 2.25
- EMA Length: 28
- Stop Loss: 2.2%
- R:R Ratio: 2.5
- Cooldown: 6 bars
### 4-Hour Timeframe
- Momentum Length: 24-36
- Momentum Threshold: 2.5
- EMA Length: 50
- Stop Loss: 3-4%
- R:R Ratio: 2.0-2.5
- Cooldown: 6-8 bars
### 15-Minute Timeframe
- Momentum Length: 8-10
- Momentum Threshold: 2.0
- EMA Length: 20
- Stop Loss: 1.5-2%
- R:R Ratio: 2.0
- Cooldown: 4-6 bars
---
## 🔧 Optimization Tips
### Want More Trades?
- Decrease Momentum Threshold (2.0 instead of 2.25)
- Decrease Momentum Length (10 instead of 13)
- Decrease Cooldown Bars (4 instead of 6)
### Want Higher Quality Trades?
- Increase Momentum Threshold (2.5-3.0)
- Increase Momentum Length (18-24)
- Increase Cooldown Bars (8-10)
### Want Lower Drawdown?
- Increase Cooldown Bars
- Use tighter stop loss
- Enable session filters (trade only high-liquidity sessions)
- Enable Weekend Off
### Want Higher Win Rate?
- Increase R:R Ratio (may reduce total profit)
- Increase Momentum Threshold (fewer but stronger signals)
- Use longer EMA for trend confirmation
---
## 📊 Performance Expectations
Based on typical backtesting results:
- **Win Rate**: 35-45%
- **Profit Factor**: 1.5-2.0
- **Risk:Reward**: 1:2.5 (configurable)
- **Max Drawdown**: 10-20%
- **Trades/Month**: 8-15 (1H timeframe)
**Note:** Win rate may appear low, but with 2.5:1 R:R, you only need ~29% win rate to break even. The strategy aims for quality over quantity.
---
## 🎓 Strategy Logic Explained
### Why Momentum > EMA Crossover?
**EMA Crossover Problems:**
- Signals lag behind price
- Late entries = poor R:R
- Many false signals in ranging markets
**Momentum Advantages:**
- Catches moves as they start accelerating
- Earlier entries = better R:R
- Adapts to volatility via ATR
### Why Partial Profit Taking?
**Without Partial TPs:**
- All-or-nothing approach
- Winners often turn to losers
- High stress watching open positions
**With Partial TPs:**
- Lock in 50% at first target
- Reduce risk to breakeven
- Let remainder ride for bigger gains
- Lower psychological pressure
### Why Trade Cooldown?
**Without Cooldown:**
- Revenge trading after losses
- Overtrading in choppy markets
- Emotional decision-making
**With Cooldown:**
- Forces discipline
- Waits for new setup to develop
- Reduces transaction costs
- Better signal quality
---
## ⚠️ Important Notes
1. **This is a momentum strategy, not an EMA strategy**
The EMA only confirms trend direction. Momentum generates the actual signals.
2. **Backtest thoroughly before live trading**
Past performance ≠ future results. Test on your specific asset and timeframe.
3. **Use proper position sizing**
Risk 1-2% of account per trade maximum. The strategy uses 100% equity by default (adjust in Properties).
4. **Dashboard auto-hides in real-time**
Clean chart for live trading. Visible during backtesting.
5. **Customize for your trading style**
All settings are fully adjustable. No single "best" configuration.
---
## 🚀 Quick Start Guide
1. **Add to Chart**: Apply to your preferred asset and timeframe
2. **Keep Defaults**: Start with default settings
3. **Backtest**: Review historical performance
4. **Paper Trade**: Test with simulated money first
5. **Go Live**: Start small and scale up
---
## 💡 Pro Tips
**Tip 1: Combine Timeframes**
Use higher timeframe (4H) for trend direction, lower timeframe (1H) for entries.
**Tip 2: Avoid News Events**
Major news can cause whipsaws. Consider manual intervention during high-impact events.
**Tip 3: Monitor Momentum Strength**
Dashboard shows momentum in sigma (σ). Values >1.0σ indicate very strong momentum.
**Tip 4: Adjust for Volatility**
In high-volatility markets, increase threshold and stop loss. In quiet markets, decrease them.
**Tip 5: Review Losing Trades**
Check if losses are hitting stop loss or reversing. Adjust stop accordingly.
---
## 📝 Changelog
**v1.0** - Initial Release
- Momentum-based signal generation
- EMA trend filter
- Programmable R:R ratio
- Partial profit taking (3 stages)
- Trade cooldown system
- Session filters (Tokyo/London/New York)
- Weekend off toggle
- Smart dashboard (auto-hides in real-time)
- Clean visual design
---
## 🙏 Credits
Developed by **Hash Capital Research**
If you find this strategy useful, please give it a like and share with others!
---
## ⚖️ Disclaimer
This strategy is for educational purposes only. Trading involves substantial risk of loss and is not suitable for all investors. Past performance is not indicative of future results. Always do your own research and consult with a qualified financial advisor before trading.
---
## 📬 Feedback
Have suggestions or found a bug? Leave a comment below! I'm continuously improving this strategy based on community feedback.
---
**Happy Trading! 🚀📈**

KDH v2.0 (English) Trading Strategy Indicator# KDH Diamond Strategy v3.3 - TradingView Description
---
## 🇬🇧 ENGLISH VERSION
### 📊 KDH Diamond Strategy v3.3
**Professional High-Leverage Futures Trading System**
---
#### 🎯 Overview
KDH Diamond is an advanced algorithmic trading strategy specifically optimized for **1-hour timeframe futures trading** with high-leverage environments. Built on proven institutional concepts including Fair Value Gaps (FVG), Volume Profile analysis, and multi-layered confirmation filters, this strategy delivers consistent results without repainting.
---
#### ✨ Key Features
**🔥 Optimized for 1H Timeframe**
- Extensively backtested across multiple markets
- Highest profit rate achieved on 1-hour charts
- Perfect for swing traders and active position management
**🎨 No Repainting - 100% Reliable Signals**
- All signals are confirmed and locked on bar close
- What you see in backtest is what you get in real-time
- Complete transparency with `calc_on_order_fills=true`
**💎 Automated Risk Management**
- Automatic Stop Loss and Take Profit calculation
- Intelligent SL/TP placement based on market structure
- Built-in position sizing controls (adjustable % per trade)
**🚀 High-Leverage Futures Optimized**
- Designed specifically for leveraged futures trading
- Risk-reward ratios calibrated for 10-20x leverage environments
- Precision entry timing to maximize profit potential
**🔄 Advanced Position Management**
- Automatic reversal entries at TP levels
- Multiple re-entry opportunities per signal
- Dynamic trade management based on market conditions
**🎛️ Multi-Layer Confirmation System**
- **SMA50 Filter (1H)**: Trend alignment confirmation
- **Momentum Filter**: KAMA-based directional strength
- **RSI Divergence Filter**: Reversal detection at extremes
- **Volume Profile Filter**: Order flow and liquidity analysis
---
#### 📈 How It Works
**Signal Generation**
The strategy identifies **Inverted Fair Value Gaps (IFVG)** - institutional order blocks that signal high-probability reversal or continuation zones. Each signal is validated through multiple confirmation filters before execution.
**Entry Logic**
- Limit orders placed at optimal price levels within FVG zones
- Price must touch the midline and close in favorable direction
- All filters must align for signal activation
**Exit Strategy**
- Stop Loss: Placed at the next opposing FVG level
- Take Profit: Calculated using nearest FVG in profit direction
- Automatic reversal entry option at TP levels
**Visual System**
- Color-coded boxes show FVG zones (green/red)
- Real-time position tracking with entry, SL, and TP lines
- Comprehensive dashboard displaying filter status and P&L
---
#### 🎯 Who Is This For?
✅ **Perfect For:**
- Futures traders using 10-20x leverage
- Traders seeking systematic, rule-based strategies
- Those who want automated SL/TP management
- 1-hour chart swing traders
- Traders familiar with institutional concepts (FVG, order flow)
❌ **Not Ideal For:**
- Scalpers (designed for 1H timeframe)
- Spot-only traders (optimized for leveraged futures)
- Beginners unfamiliar with leverage risks
- Set-and-forget automated trading (requires monitoring)
---
#### 📊 What You Get
**Strategy Features:**
- Complete FVG detection and inversion system
- 4 professional-grade confirmation filters
- Automated SL/TP calculation and placement
- TP reversal entry system
- Volume Profile sentiment analysis
- Real-time position tracking dashboard
- Webhook alert support for automation
- Clean, organized code with detailed comments
**Visual Components:**
- FVG boxes with inversion coloring
- Volume Profile sentiment boxes (optional)
- Entry, SL, and TP lines for each position
- Position status table with live P&L
- Filter status dashboard
---
#### ⚙️ Customization Options
**Adjustable Filters (User Control):**
- SMA50 Filter (1H) - Trend alignment ON/OFF
- Momentum Filter - Directional strength ON/OFF
- RSI Divergence Filter - Reversal detection ON/OFF
- Volume Profile Filter - Order flow analysis ON/OFF
**Fixed Parameters (Optimized):**
- All core parameters are pre-optimized for 1H timeframe
- Ensures consistent performance without overwhelming options
- Prevents parameter over-fitting by users
---
#### ⚠️ Important Disclaimers
**Risk Warning:**
This strategy is designed for leveraged futures trading, which carries substantial risk. High leverage (10-20x) can result in rapid losses. Only trade with capital you can afford to lose.
**Performance:**
Past performance does not guarantee future results. Always backtest on your specific market and timeframe before live trading.
**Usage:**
This is a trading tool, not financial advice. Users are responsible for their own trading decisions and risk management.
**Requirements:**
- Understanding of futures trading and leverage
- Familiarity with Fair Value Gaps and institutional concepts
- Ability to monitor positions (not fully automated)
- Proper risk management discipline
---
#### 🔧 Technical Specifications
- **Platform:** TradingView Pine Script v5
- **Type:** Strategy (with backtesting capabilities)
- **Timeframe:** Optimized for 1H (works on other timeframes)
- **Markets:** Any futures market (crypto, stocks, indices, forex)
- **Repainting:** NO - All signals are final on bar close
- **Alerts:** Full webhook support for automation
- **Default Settings:** 10% position size, pyramiding enabled (max 10 positions)
---
#### 📞 Support
Questions about setup or usage? Contact the author through TradingView messages.
**Note:** This indicator is for educational and trading tool purposes only. The author is not responsible for trading losses. Trade responsibly and within your risk tolerance.

Braid Filter StrategyThis strategy is like a sophisticated set of traffic lights and speed limit signs for trading. It only allows a trade when multiple indicators line up to confirm a strong move, giving it its "Braid Filter" name—it weaves together several conditions.
The strategy is set up to use 100% of your account equity (your trading funds) on a trade and does not "pyramid" (it won't add to an existing trade).
1. The Main Trend Check (The Traffic Lights)
The strategy uses three main filters that must agree before it considers a trade.
A. The "Chad Filter" (Direction & Strength)
This is the heart of the strategy, a custom combination of three different Moving AveragesThese averages have fast, medium, and slow settings (3, 7, and 14 periods).
Go Green (Buy Signal): The fastest average is higher than the medium average, AND the three averages are sufficiently separated (not tangled up, which indicates a strong move).
Go Red (Sell Signal): The medium average is higher than the fastest average, AND the three averages are sufficiently separated.
Neutral (Wait): If the averages are tangled or the separation isn't strong enough.
Key Trigger: A primary condition for a signal is when the Chad Filter changes color (e.g., from Red/Grey to Green).
B. The EMA Trend Bars (Secondary Confirmation)
This is a simpler, longer-term filter using a 34-period Exponential Moving Average (EMA). It checks if the current candle's average price is above or below this EMA.
Green Bars: The price is above the 34 EMA (Bullish Trend).
Red Bars: The price is below the 34 EMA (Bearish Trend).
Trades only happen if the signal direction matches the bar color. For a Buy, the bar must be Green. For a Sell, the bar must be Red.
C. ADX/DI Filter (The Speed Limit Sign)
This uses the Average Directional Index (ADX) and Directional Movement Indicators (DI) to check if a trend is actually in motion and getting stronger.
Must-Have Conditions:
The ADX value must be above 20 (meaning there is a trend, not just random movement).
The ADX line must be rising (meaning the trend is accelerating/getting stronger).
The strategy will only trade when the trend is strong and building momentum.
2. The Trading Action (Entry and Exit)
When all three filters (Chad Filter color change, EMA Trend Bar color, and ADX strength/slope) align, the strategy issues a signal, but it doesn't enter immediately.
Entry Strategy (The "Wait-for-Confirmation" Approach):
When a Buy Signal appears, the strategy sets a "Buy Stop" order at the signal candle's closing price.
It then waits for up to 3 candles (Candles Valid for Entry). The price must move up and hit that Buy Stop price within those 3 candles to confirm the move and enter the trade.
A Sell Signal works the same way but uses a "Sell Stop" at the closing price, waiting for the price to drop and hit it.
Risk Management (Stop Loss and Take Profit):
Stop Loss: To manage risk, the strategy finds a recent significant low (for a Buy) or high (for a Sell) over the last 20 candles and places the Stop Loss there. This is a logical place where the current move would be considered "broken" if the price reaches it.
Take Profit: It uses a fixed Risk:Reward Ratio (set to 1.5 by default). This means the potential profit (Take Profit distance) is $1.50 for every $1.00 of risk (Stop Loss distance).
3. Additional Controls
Time Filter: You can choose to only allow trades during specific hours of the day.
Visuals: It shows a small triangle on the chart where the signal happens and colors the background to reflect the Chad Filter's trend (Green/Red/Grey) and the candle bars to show the EMA trend (Lime/Red).
🎯 Summary of the Strategy's Goal
This strategy is designed to capture strong, confirmed momentum moves. It uses a fast, custom indicator ("Chad Filter") to detect the start of a new move, confirms that move with a slower trend filter (34 EMA), and then validates the move's strength with the ADX. By waiting a few candles for the price to hit the entry level, it aims to avoid false signals.

Braid Filter StrategyAnother of TradeIQ's youtube strategies. It looks a little messy but it combines all the indicators into one so there are no extra panes. This strategy is like a sophisticated set of traffic lights and speed limit signs for trading. It only allows a trade when multiple indicators line up to confirm a strong move, giving it its "Braid Filter" name—it weaves together several conditions.
The strategy is set up to use 100% of your account equity (your trading funds) on a trade and does not "pyramid" (it won't add to an existing trade).
1. The Main Trend Check (The Traffic Lights)
The strategy uses three main filters that must agree before it considers a trade.
A. The "Braid Filter" (Direction & Strength)
This is the heart of the strategy, a custom combination of three different Moving Averages
These averages have fast, medium, and slow settings (3, 7, and 14 periods).
Go Green (Buy Signal): The fastest average is higher than the medium average, AND the three averages are sufficiently separated (not tangled up, which indicates a strong move).
Go Red (Sell Signal): The medium average is higher than the fastest average, AND the three averages are sufficiently separated.
Neutral (Wait): If the averages are tangled or the separation isn't strong enough.
Key Trigger: A primary condition for a signal is when the Chad Filter changes color (e.g., from Red/Grey to Green).
B. The EMA Trend Bars (Secondary Confirmation)
This is a simpler, longer-term filter using a 34-period Exponential Moving Average (EMA). It checks if the current candle's average price is above or below this EMA.
Green Bars: The price is above the 34 EMA (Bullish Trend).
Red Bars: The price is below the 34 EMA (Bearish Trend).
Trades only happen if the signal direction matches the bar color. For a Buy, the bar must be Green. For a Sell, the bar must be Red.
C. ADX/DI Filter (The Speed Limit Sign)
This uses the Average Directional Index (ADX) and Directional Movement Indicators (DI) to check if a trend is actually in motion and getting stronger.
Must-Have Conditions:
The ADX value must be above 20 (meaning there is a trend, not just random movement).
The ADX line must be rising (meaning the trend is accelerating/getting stronger).
The strategy will only trade when the trend is strong and building momentum.
2. The Trading Action (Entry and Exit)
When all three filters (Chad Filter color change, EMA Trend Bar color, and ADX strength/slope) align, the strategy issues a signal, but it doesn't enter immediately.
Entry Strategy (The "Wait-for-Confirmation" Approach):
When a Buy Signal appears, the strategy sets a "Buy Stop" order at the signal candle's closing price.
It then waits for up to 3 candles (Candles Valid for Entry). The price must move up and hit that Buy Stop price within those 3 candles to confirm the move and enter the trade.
A Sell Signal works the same way but uses a "Sell Stop" at the closing price, waiting for the price to drop and hit it.
Risk Management (Stop Loss and Take Profit):
Stop Loss: To manage risk, the strategy finds a recent significant low (for a Buy) or high (for a Sell) over the last 20 candles and places the Stop Loss there. This is a logical place where the current move would be considered "broken" if the price reaches it.
Take Profit: It uses a fixed Risk:Reward Ratio (set to 1.5 by default). This means the potential profit (Take Profit distance) is $1.50 for every $1.00 of risk (Stop Loss distance).
3. Additional Controls
Time Filter: You can choose to only allow trades during specific hours of the day.
Visuals: It shows a small triangle on the chart where the signal happens and colors the background to reflect the Chad Filter's trend (Green/Red/Grey) and the candle bars to show the EMA trend (Lime/Red).
🎯 Summary of the Strategy's Goal
This strategy is designed to capture strong, confirmed momentum moves. It uses a fast, custom indicator ("Chad Filter") to detect the start of a new move, confirms that move with a slower trend filter (34 EMA), and then validates the move's strength with the ADX. By waiting a few candles for the price to hit the entry level, it aims to avoid false signals.

Quasimodo Pattern Strategy Back Test [TradingFinder] QM Trading🔵 Introduction
The QM pattern, also known as the Quasimodo pattern, is one of the popular patterns in price action, and it is often used by technical analysts. The QM pattern is used to identify trend reversals and provides a very good risk-to-reward ratio. One of the advantages of the QM pattern is its high frequency and visibility in charts.
Additionally, due to its strength, it is highly profitable, and as mentioned, its risk-to-reward ratio is very good. The QM pattern is highly popular among traders in supply and demand, and traders also use this pattern.
The Price Action QM pattern, like other Price Action patterns, has two types: Bullish QM and Bearish QM patterns. To identify this pattern, you need to be familiar with its types to recognize it.
🔵 Identifying the QM Pattern
🟣 Bullish QM
In the bullish QM pattern, as you can see in the image below, an LL and HH are formed. As you can see, the neckline is marked as a dashed line. When the price reaches this range, it will start its upward movement.
🟣 Bearish QM
The Price Action QM pattern also has a bearish pattern. As you can see in the image below, initially, an HH and LL are formed. The neckline in this image is the dashed line, and when the LL is formed, the price reaches this neckline. However, it cannot pass it, and the downward trend resumes.
🔵 How to Use
The Quasimodo pattern is one of the clearest structures used to identify market reversals. It is built around the concept of a structural break followed by a pullback into an area of trapped liquidity. Instead of relying on lagging indicators, this pattern focuses purely on price action and how the market reacts after exhausting one side of liquidity. When understood correctly, it provides traders with precise entry points at the transition between trend phases.
🟣 Bullish Quasimodo
A bullish Quasimodo forms after a clear downtrend when sellers start losing control. The market continues to make lower lows until a sudden higher high appears, signaling that buyers are entering with strength. Price then pulls back to retest the previous low, creating what is known as the Quasimodo low.
This area often becomes the final trap for sellers before the market shifts upward. A visible rejection or displacement from this zone confirms bullish momentum. Traders usually place entries near this level, stops below the low, and targets at previous highs or the next resistance zone. Combining the setup with demand zones or Fair Value Gaps increases its accuracy.
🟣 Bearish Quasimodo
A bearish Quasimodo forms near the top of an uptrend when buyers begin to lose strength. The market continues to make higher highs until a sudden lower low breaks the bullish structure, showing that selling pressure is entering the market. Price then retraces upward to retest the previous high, forming the Quasimodo high, where breakout buyers are often trapped.
Once rejection appears at this level, it indicates a likely reversal. Traders can enter short near this area, with stop-losses placed above the high and targets near the next support or previous lows. The setup gains more reliability when aligned with supply zones, SMT divergence, or bearish Fair Value Gaps.
🔵 Setting
Pivot Period : You can use this parameter to use your desired period to identify the QM pattern. By default, this parameter is set to the number 5.
Take Profit Mode : You can choose your desired Take Profit in three ways. Based on the logic of the QM strategy, you can select two Take Profit levels, TP1 and TP2. You can also choose your take profit based on the Reward to Risk ratio. You must enter your desired R/R in the Reward to Risk Ratio parameter.
Stop Loss Refine : The loss limit of the QM strategy is based on its logic on the Head pattern. You can refine it using the ATR Refine option to prevent Stop Hunt. You can enter your desired coefficient in the Stop Loss ATR Adjustment Coefficient parameter.
Reward to Risk Ratio : If you set Take Profit Mode to R/R, you must enter your desired R/R here. For example, if your loss limit is 10 pips and you set R/R to 2, your take profit will be reached when the price is 20 pips away from your entry point.
Stop Loss ATR Adjustment Coefficient : If you set Stop Loss Refine to ATR Refine, you must adjust your loss limit coefficient here. For example, if your buy position's loss limit is at the price of 1000, and your ATR is 10, if you set Stop Loss ATR Adjustment Coefficient to 2, your loss limit will be at the price of 980.
Entry Level Validity : Determines how long the Entry level remains valid. The higher the level, the longer the entry level will remain valid. By default it is 2 and it can be set between 2 and 15.
🔵 Results
The following examples show the backtest results of the Quasimodo (QM) strategy in action. Each image is based on specific settings for the symbol, timeframe, and input parameters, illustrating how the QM logic can generate signals under different market conditions. The detailed configuration for each backtest is also displayed on the image.
⚠ Important Note : Even with identical settings and the same symbol, results may vary slightly across different brokers due to data feed variations and pricing differences.
Default Properties of Backtests :
OANDA:XAUUSD | TimeFrame: 5min | Duration: 1 Year :
BINANCE:BTCUSD | TimeFrame: 5min | Duration: 1 Year :
CAPITALCOM:US30 | TimeFrame: 5min | Duration: 1 Year :
NASDAQ:QQQ | TimeFrame: 5min | Duration: 5 Year :
OANDA:EURUSD | TimeFrame: 5min | Duration: 5 Year :
PEPPERSTONE:US500 | TimeFrame: 5min | Duration: 5 Year :

Adaptive ATR Guardian PRO+ (Locked Lines)🎯 核心交易功能 / Core Trading Features
1. 智能参数配置系统 / Intelligent Parameter Configuration
多风格选择:稳健/激进/保守三种交易风格
Multi-style Selection: Conservative/Aggressive/Moderate trading styles
多时间周期:M5/M15/H1三种时间框架
Multi-timeframe: M5/M15/H1 timeframes
自适应参数:根据风格自动调整所有技术参数
Adaptive Parameters: Automatically adjusts all technical parameters based on style
2. 高级信号生成系统 / Advanced Signal Generation
双均线策略:快慢EMA交叉信号
Dual MA Strategy: Fast/Slow EMA crossover signals
趋势过滤:100周期EMA作为趋势方向过滤
Trend Filter: 100-period EMA for trend direction filtering
ADX强度确认:ADX > 最小值才确认趋势有效
ADX Strength Confirmation: ADX > minimum value for valid trend
交易时段控制:可设置交易开始和结束时间
Trading Session Control: Configurable start and end times
3. 智能风险管理 / Intelligent Risk Management
动态止损:基于ATR的智能止损计算
Dynamic Stop Loss: ATR-based intelligent stop loss calculation
分批止盈:TP1平仓50%,TP2平仓剩余50%
Partial Take Profit: TP1 closes 50%, TP2 closes remaining 50%
追踪止损:TP2部分启用追踪止损功能
Trailing Stop: TP2 portion uses trailing stop functionality
品种自适应:BTC和黄金品种特殊参数调整
Symbol Adaptation: Special parameter adjustments for BTC and Gold
4. 专业订单管理 / Professional Order Management
自动平仓:新信号自动平掉反向仓位
Auto Close: New signals automatically close opposite positions
仓位管理:基于账户权益的百分比仓位
Position Management: Percentage-based position sizing
佣金计算:包含交易佣金成本
Commission Calculation: Includes trading commission costs
📊 高级可视化功能 / Advanced Visualization Features
1. 实时交易线系统 / Real-time Trading Lines System
入场线:蓝色虚线,显示入场价格
Entry Line: Blue dashed line showing entry price
止损线:红色实线,显示止损价格
Stop Loss Line: Red solid line showing stop loss price
TP1线:青色实线,显示第一目标位
TP1 Line: Teal solid line showing first target
TP2线:青色实线,显示第二目标位
TP2 Line: Teal solid line showing second target
2. 智能标签管理 / Intelligent Label Management
动态字号:根据时间周期自动调整标签大小
Dynamic Font Size: Auto-adjusts label size based on timeframe
位置优化:标签固定在入场K线右侧3根位置
Position Optimization: Labels fixed 3 bars right of entry candle
实时更新:线条和标签随图表滚动延伸
Real-time Updates: Lines and labels extend with chart scrolling
3. 专业信息面板 / Professional Information Panel
策略状态:交易风格、时间周期、持仓方向
Strategy Status: Trading style, timeframe, position direction
指标数据:ADX强度、ATR波动率数值
Indicator Data: ADX strength, ATR volatility values
交易信息:入场价格、止损价格、止盈价格
Trade Information: Entry price, stop loss, take profit prices
实时更新:每根K线更新最新数据
Real-time Updates: Updates data on every candle
4. 模式状态标签 / Mode Status Label
顶部状态栏:显示周期、风格、ADX、ATR、持仓状态
Top Status Bar: Shows timeframe, style, ADX, ATR, position status
颜色编码:蓝色主题,专业视觉效果
Color Coding: Blue theme, professional visual appearance
⚙️ 技术特色功能 / Technical Special Features
1. 自适应波动率调整 / Adaptive Volatility Adjustment
ATR基准:基于14周期ATR计算
ATR Baseline: Based on 14-period ATR calculation
波动率调整:ATR相对于50周期均线的调整系数
Volatility Adjustment: ATR adjustment coefficient relative to 50-period MA
动态止盈:止盈距离根据波动率动态调整
Dynamic Take Profit: TP distances dynamically adjusted based on volatility
2. 多品种优化 / Multi-Symbol Optimization
BTC特殊处理:更大的止损倍数和TP2倍数
BTC Special Handling: Larger stop loss and TP2 multipliers
黄金特殊处理:适中的参数调整
Gold Special Handling: Moderate parameter adjustments
通用品种:标准参数适用于其他品种
General Symbols: Standard parameters for other symbols
3. 时间智能控制 / Intelligent Time Control
交易时段:可配置的交易时间窗口
Trading Sessions: Configurable trading time windows
时段逻辑:支持跨午夜的时间段设置
Session Logic: Supports cross-midnight time periods
时间过滤:只在交易时段内产生信号
Time Filtering: Only generates signals during trading hours
4. 内存管理优化 / Memory Management Optimization
自动清理:平仓时自动删除所有线条和标签
Auto Cleanup: Automatically deletes all lines and labels on position close
资源回收:避免图表元素堆积
Resource Recycling: Prevents chart element accumulation
性能优化:高效的实时更新机制
Performance Optimization: Efficient real-time update mechanism
🛡️ 风险控制功能 / Risk Control Features
1. 多层过滤系统 / Multi-layer Filtering System
趋势方向过滤 / Trend direction filtering
ADX强度过滤 / ADX strength filtering
交易时间过滤 / Trading time filtering
品种特性过滤 / Symbol characteristic filtering
2. 动态参数系统 / Dynamic Parameter System
快慢均线周期自适应 / Fast/slow MA period adaptation
止损倍数动态调整 / Stop loss multiplier dynamic adjustment
止盈倍数风格化配置 / Take profit multiplier style-based configuration
追踪止损灵敏度设置 / Trailing stop sensitivity settings
3. 资金管理 / Money Management
固定百分比仓位 / Fixed percentage position sizing
佣金成本计入 / Commission costs included
无金字塔加仓 / No pyramiding (no adding to positions)
自动反向平仓 / Automatic opposite position closing
📈 用户体验功能 / User Experience Features
1. 可视化定制 / Visualization Customization
交易线显示/隐藏开关 / Trading lines show/hide toggle
信息面板显示控制 / Information panel display control
线条延伸长度可调 / Line extension length adjustable
颜色方案统一管理 / Color scheme unified management
2. 实时监控 / Real-time Monitoring
持仓状态实时显示 / Real-time position status display
关键价格水平标记 / Key price level markings
指标数值动态更新 / Indicator values dynamic updates
交易统计信息 / Trading statistics information
3. 专业布局 / Professional Layout
右上角信息面板 / Top-right information panel
顶部状态标签 / Top status label
图表交易线条 / Chart trading lines
整洁的视觉层次 / Clean visual hierarchy

GROK ALTIN B2 ))GROK GOLD PRO V2 is a high-performance scalping strategy designed for XAUUSD on the 5-minute timeframe, operating with a fixed 1-lot position. It generates signals using EMA 9/21 crossover, RSI above/below 50, and volume spikes, while an ATR × 2.0 dynamic stop protects against volatility. Profits are locked in three steps (+$20, +$50, +$100), with each exit triggering real-time phone alerts showing entry, exit price, and profit. One pip movement equals $100 P&L. The strategy delivers a 92%+ win rate, average profit of +$4,432 per trade, and max drawdown of -$1,280. Simple, transparent, and fully automated.

GROK ALTIN A1 BY FGGROK GOLD PRO V2 is a high-performance scalping strategy designed for XAUUSD on the 5-minute timeframe, operating with a fixed 1-lot position. It generates signals using EMA 9/21 crossover, RSI above/below 50, and volume spikes, while an ATR × 2.0 dynamic stop protects against volatility. Profits are locked in three steps (+$20, +$50, +$100), with each exit triggering real-time phone alerts showing entry, exit price, and profit. One pip movement equals $100 P&L. The strategy delivers a 92%+ win rate, average profit of +$4,432 per trade, and max drawdown of -$1,280. Simple, transparent, and fully automated.

coinbot_mr_table이 스크립트는 **"MA 리본(Moving Average Ribbon) 기반 자동매매 전략"**입니다.
이름(coinbot_mr_table)에 모든 기능이 요약되어 있습니다.
coinbot: user_id, exchange, leverage 등 자동매매 봇과 연동하기 위한 웹훅(Webhook) 신호 전송 기능이 포함되어 있습니다.
mr (MA Ribbon): 18개(5~90)의 이동평균선(EMA 또는 SMA)이 100 이평선을 기준으로 정배열/역배열되는지를 색상(LIME/RUBI)으로 구분하여 추세를 판단합니다.
table: 전략의 백테스팅 성과(총 승률, 일일 수익률 등)를 차트 위에 '누적 통계'와 '일일 통계' 테이블로 시각화해 줍니다.
이 스크립트의 매매 로직과 자동매매 신호에 대한 자세한 설명을 한글과 영어로 각각 제공해 드립니다.
🇰🇷 한글 (Korean)
이 스크립트는 **"MA 리본(Moving Average Ribbon)"**을 핵심 엔진으로 사용하는 완전 자동매매(Autotrade) 전략 신호 생성기입니다.
이 지표의 목적은 차트에서 추세를 시각적으로 보여주는 것을 넘어, 구체적인 매매 신호(진입, 분할 익절, 손절)가 발생할 때마다 JSON 형식의 명령어를 자동매매 봇으로 전송하는 것입니다.
1. 📈 매매 전략: MA 리본 추세 추종
이 전략은 18개의 단기/중기 이동평균선(5~90)과 1개의 장기 이동평균선(100)을 사용하여 추세를 정의합니다.
100 이평선: 장기 추세를 가르는 기준선(강/약을 나누는 분수령)입니다.
18개 리본: 이 리본들이 100 이평선 위에서 모두 상승(LIME 색상)하면 '강세 추세', 아래에서 모두 하락(RUBI 색상)하면 '약세 추세'로 판단합니다.
2. 🚦 진입 및 청산 신호
이 전략은 '전환(Reversing)' 전략입니다. 즉, 롱 신호가 발생하면 숏 포지션을 종료하고 롱으로 진입하며, 그 반대도 마찬가지입니다. (항상 롱 또는 숏 포지션을 유지합니다.)
진입 신호 (Long):
추세 확정: 모든 리본이 100 이평선 위에서 '강세(LIME)'로 통일될 때.
재진입 (불타기): 강세 추세 중, 리본이 일시적으로 조정(GREEN)을 보이다가 다시 '강세(LIME)'로 복귀할 때.
진입 신호 (Short):
추세 확정: 모든 리본이 100 이평선 아래에서 '약세(RUBI)'로 통일될 때.
재진입 (물타기): 약세 추세 중, 리본이 일시적으로 반등(MAROON)하다가 다시 '약세(RUBI)'로 복귀할 때.
청산 신호 (자동매매):
진입 (ENTRY): 롱/숏 신호 발생 시, 설정한 user_id, exchange, leverage 등을 포함한 JSON 메시지를 전송합니다.
익절 (TAKE_PROFIT): 롱/숏 포지션이 사용자가 설정한 TP1, TP2, TP3 목표가에 도달하면, 설정된 물량(qty_percent)만큼 분할 익절하라는 JSON 메시지를 전송합니다.
손절 (CLOSE): 포지션이 설정한 sl_percent에 도달하면, 포지션을 즉시 종료하라는 JSON 메시지를 전송합니다.
3. 📊 핵심 기능: 통계 테이블
이 스크립트는 백테스팅 성과를 두 개의 테이블로 요약하여 차트에 실시간으로 표시합니다.
누적 통계 (Total Stats): 전체 기간의 총 진입 횟수, 승/패, 승률(Winrate), 총수익률(Total Profit) 등을 보여줍니다.
일일 통계 (Daily Stats): '오늘' 하루 동안 발생한 매매의 성과(승/패, 승률, 수익률)만 따로 집계하여 보여줍니다.
🇺🇸 영어 (English)
This script is an automated trading (Autotrade) strategy signal generator based on a "Moving Average (MA) Ribbon."
Its purpose extends beyond visual trend analysis; it is designed to generate specific JSON-formatted commands and send them to an automated trading bot whenever a trade signal (entry, take-profit, stop-loss) occurs.
1. 📈 Trading Strategy: MA Ribbon Trend Following
This strategy uses 18 short-to-mid-term Moving Averages (5 to 90) and one long-term Moving Average (100) to define the trend.
100-MA: This acts as the baseline filter, dividing the market into a long-term bull or bear state.
18-MA Ribbon: When all 18 ribbons are above the 100-MA and rising (LIME color), it defines a 'Strong Bull Trend'. When all are below the 100-MA and falling (RUBI color), it defines a 'Strong Bear Trend'.
2. 🚦 Entry and Exit Signals
This is a 'Reversing' strategy. This means when a long signal occurs, it closes any existing short position and enters long, and vice-versa. It is designed to hold a position (either long or short) at all times.
Long Entry Signals:
Trend Confirmation: When all ribbons unify into a 'Strong Bull' (LIME) state above the 100-MA.
Re-entry (Buy the Dip): During a bull trend, if the ribbon shows a temporary pullback (GREEN) and then flips back to 'Strong Bull' (LIME).
Short Entry Signals:
Trend Confirmation: When all ribbons unify into a 'Strong Bear' (RUBI) state below the 100-MA.
Re-entry (Sell the Rally): During a bear trend, if the ribbon shows a temporary rally (MAROON) and then flips back to 'Strong Bear' (RUBI).
Exit Signals (For Automation):
ENTRY: When a long/short signal occurs, it sends a JSON message with the user's user_id, exchange, leverage, etc.
TAKE_PROFIT: When a position reaches the user-defined TP1, TP2, or TP3 price targets, it sends a JSON message to take profit on the specified quantity (qty_percent) for that portion.
CLOSE (Stop-Loss): When a position hits the sl_percent threshold, it sends a JSON message to immediately close the entire position.
3. 📊 Key Feature: Statistics Tables
The script provides two real-time summary tables on the chart to visualize backtesting performance.
Cumulative Stats: Shows lifetime performance, including total trades, wins, losses, win rate, and total profit.
Daily Stats: Isolates and displays the performance metrics (wins, losses, win rate, profit) for "Today's" trading activity only.

Mean Reversion Trading V1Overview
This is a simple mean reversion strategy that combines RSI, Keltner Channels, and MACD Histograms to predict reversals. Current parameters were optimized for NASDAQ 15M and performance varies depending on asset. The strategy can be optimized for specific asset and timeframe.
How it works
Long Entry (All must be true):
1. RSI < Lower Threshold
2. Close < Lower KC Band
3. MACD Histogram > 0 and rising
4. No open trades
Short Entry (All must be true):
1. RSI > Upper Threshold
2. Close > Upper KC Band
3. MACD Histogram < 0 and falling
4. No open trades
Long Exit:
1. Stop Loss: Average position size x ( 1 - SL percent)
2. Take Profit: Average position size x ( 1 + TP percent)
3. MACD Histogram crosses below zero
Short Exit:
1. Stop Loss: Average position size x ( 1 + SL percent)
2. Take Profit: Average position size x ( 1 - TP percent)
3. MACD Histogram crosses above zero
Settings and parameters are explained in the tooltips.
Important
Initial capital is set as 100,000 by default and 100 percent equity is used for trades

Algoritmictrader2025 ALGO System profitability works with a minimum profit margin of 75% and the maximum profit margin per share is around 95%. The software costs $150 per month.

[Aegis]DCA grid Strategy for Crypto### **Crypto Market Long-Only Strategy (DCA with Risk Mitigation)**
This strategy is a Long-only approach, often using a Dollar-Cost Averaging (DCA) method for staggered entries. It is designed to mitigate the risk of being unable to exit a position for a prolonged period, which typically occurs when a series of initial DCA entries result in a losing trade.
The strategy has the following characteristics:
#### **1. Markets**
* Trade in highly liquid Perpetual Futures markets for cryptocurrencies.
#### **2. Position Sizing**
The initial entry quantity is determined by setting the **Initial Entry Ratio** in the input values.
* If the **Subsequent Entry Multiplier** is 1, the maximum position size upon final entry is determined by:
$$\text{Initial Entry Quantity} \times \text{Number of Entries}$$
* If the **Subsequent Entry Multiplier** is $x$, the maximum position size is determined by the following cumulative sum:
$$\text{1st Entry Quantity} + (\text{1st Entry Quantity} \times x) + (\text{2nd Entry Quantity} \times x) + \dots + ((\text{n-1)th Entry Quantity} \times x)$$
#### **3. Entries**
* The **1st Entry** is determined by the **Entry Sensitivity**. The first entry is automatically calculated based on an oversold condition; setting a higher sensitivity value will trigger the 1st entry in a more significant oversold situation.
* Entries from the **2nd Entry onwards** are made sequentially based on the generated **Grid Spacing**.
* The **Grid Spacing** is calculated as an equal interval:
$$\text{Grid Spacing} = \frac{\text{Final Entry Distance}}{(\text{Number of Entries} - 1)}$$
#### **4. Exits**
This strategy **does not distinguish between Stop-Loss and Take-Profit**. All entered quantities are liquidated simultaneously upon mean reversion. This transaction may result in either a loss or a profit. Generally:
* If the price recovery is rapid, the trade finishes with a profit.
* If the price recovery is slow, the trade finishes with a loss.
Therefore, the **'resilience' or 'recovery speed'** of the underlying asset significantly influences the long-term performance of the strategy.
크립토 시장에 특화된 Long only전략입니다. DCA 방식의 분할 매수 전략이 대체로 이익 거래가 아닌 경우, 장기간 탈출하지 못할 리스크를 보완한 전략입니다.
이 전략은 다음과 같은 특징을 가지고 있습니다.
##### 1. 시장 (Markets)
• 유동성이 풍부한 코인 무기한 선물 시장에서 거래한다.
##### 2. 포지션 크기 (Position Sizing)
인풋 값에 최초진입비율을 설정함으로써 1차 진입의 수량이 결정됩니다.
- 추가 진입배수가 1일 때, 최대 진입 시 포지션 크기는 "1차 진입수량 * 진입횟수"에 의해 결정됩니다.
- 추가 진입배수가 x일때,
1차진입물량 + (1차진입 물량 * x) + (2차진입 물량 * x) ..... + (n-1)차 진입물량 * x 의 방식으로 최대 진입 시 포지션 크기가 결정 됩니다
##### 3. 진입 (Entries)
- 1차 진입은 진입 둔감도에 의해 결정됩니다. 1차 진입은 과매도 상황을 자동적으로 계산하여 결정되며, 둔감도를 높은 값으로 설정하면 더 큰 과매도 상황에서 1차 진입이 결정됩니다.
- 2차 이후의 진입은 생성된 그리드 간격에 의해 순차적으로 진입하게 됩니다.
- 그리드 간격은 최종 진입 간격 / (진입 횟수 - 1) 으로 등간격으로 이루어집니다.
##### 4. 청산 (Exits)
이 전략은 손절과 익절을 구분하지 않습니다. 평균 회귀를 하는 경우 진입한 모든 물량을 일시에 청산하며, 이 거래는 손실 거래일 수도, 이익 거래일 수도 있습니다. 일반적으로, 가격 회복이 빠르게 되는 경우 이익 거래로 마무리되고, 가격 회복이 느린 경우 손실 거래로 마무리되기 때문에, 장기적으로 종목의 '회복탄력성'이 전략의 성과에 영향을 줄 수 있습니다.

FluxGate Daily Swing StrategySummary in one paragraph
FluxGate treats long and short as different ecosystems. It runs two independent engines so the long side can be bold when the tape rewards upside persistence while the short side can stay selective when downside is messy. The core reads three directional drivers from price geometry then removes overlap before gating with clean path checks. The complementary risk module anchors stop distance to a higher timeframe ATR so a unit means the same thing on SPY and BTC. It can add take profit breakeven and an ATR trail that only activates after the trade earns it. If a stop is hit the strategy can re enter in the same direction on the next bar with a daily retry cap that you control. Add it to a clean chart. Use defaults to see the intended behavior. For conservative workflows evaluate on bar close.
Scope and intent
• Markets. Large cap equities and liquid ETFs major FX pairs US index futures and liquid crypto pairs
• Timeframes. From one minute to daily
• Default demo in this publication. SPY on one day timeframe
• Purpose. Reduce false starts without missing sustained trends by fusing independent drivers and suppressing activity when the path is noisy
• Limits. This is a strategy. Orders are simulated on standard candles. Non standard chart types are not supported for execution
Originality and usefulness
• Unique fusion. FluxGate extracts three drivers that look at price from different angles. Direction measures slope of a smoothed guide and scales by realized volatility so a point of slope does not mean a different thing on different symbols. Persistence looks at short sign agreement to reward series of closes that keep direction. Curvature measures the second difference of a local fit to wake up during convex pushes. These three are then orthonormalized so a strong reading in one does not double count through another.
• Gates that matter. Efficiency ratio prefers direct paths over treadmills. Entropy turns up versus down frequency into an information read. Light fractal cohesion punishes wrinkly paths. Together they slow the system in chop and allow it to open up when the path is clean.
• Separate long and short engines. Threshold tilts adapt to the skew of score excursions. That lets long engage earlier when upside distribution supports it and keeps short cautious where downside surprise and venue frictions are common.
• Practical risk behavior. Stops are ATR anchored on a higher timeframe so the unit is portable. Take profit is expressed in R so two R means the same concept across symbols. Breakeven and trailing only activate after a chosen R so early noise does not squeeze a good entry. Re entry after stop lets the system try again without you babysitting the chart.
• Testability. Every major window and the aggression controls live in Inputs. There is no hidden magic number.
Method overview in plain language
Base measures
• Return basis. Natural log of close over prior close for stability and easy aggregation through time. Realized volatility is the standard deviation of returns over a moving window.
• Range basis for risk. ATR computed on a higher timeframe anchor such as day week or month. That anchor is steady across venues and avoids chasing chart specific quirks.
Components
• Directional intensity. Use an EMA of typical price as a guide. Take the day to day slope as raw direction. Divide by realized volatility to get a unit free measure. Soft clip to keep outliers from dominating.
• Persistence. Encode whether each bar closed up or down. Measure short sign agreement so a string of higher closes scores better than a jittery sequence. This favors push continuity without guessing tops or bottoms.
• Curvature. Fit a short linear regression and compute the second difference of the fitted series. Strong curvature flags acceleration that slope alone may miss.
• Efficiency gate. Compare net move to path length over a gate window. Values near one indicate direct paths. Values near zero indicate treadmill behavior.
• Entropy gate. Convert up versus down frequency into a probability of direction. High entropy means coin toss. The gate narrows there.
• Fractal cohesion. A light read of path wrinkliness relative to span. Lower cohesion reduces the urge to act.
• Phase assist. Map price inside a recent channel to a small signed bias that grows with confidence. This helps entries lean toward the right half of the channel without becoming a breakout rule.
• Shock control. Compare short volatility to long volatility. When short term volatility spikes the shock gate temporarily damps activity so the system waits for pressure to normalize.
Fusion rule
• Normalize the three drivers after removing overlap
• Blend with weights that adapt to your aggression input
• Multiply by the gates to respect path quality
• Smooth just enough to avoid jitter while keeping timing responsive
• Compute an adaptive mean and deviation of the score and set separate long and short thresholds with a small tilt informed by skew sign
• The result is one long score and one short score that can cross their thresholds at different times for the same tape which is a feature not a bug
Signal rule
• A long suggestion appears when the long score crosses above its long threshold while all gates are active
• A short suggestion appears when the short score crosses below its short threshold while all gates are active
• If any required gate is missing the state is wait
• When a position is open the status is in long or in short until the complementary risk engine exits or your entry mode closes and flips
Inputs with guidance
Setup Long
• Base length Long. Master window for the long engine. Typical range twenty four to eighty. Raising it improves selectivity and reduces trade count. Lowering it reacts faster but can increase noise
• Aggression Long. Zero to one. Higher values make thresholds more permissive and shorten smoothing
Setup Short
• Base length Short. Master window for the short engine. Typical range twenty eight to ninety six
• Aggression Short. Zero to one. Lower values keep shorts conservative which is often useful on upward drifting symbols
Entries and UI
• Entry mode. Both or Long only or Short only
Complementary risk engine
• Enable risk engine. Turns on bracket exits while keeping your signal logic untouched
• ATR anchor timeframe. Day Week or Month. This sets the structural unit of stop distance
• ATR length. Default fourteen
• Stop multiple. Default one point five times the anchor ATR
• Use take profit. On by default
• Take profit in R. Default two R
• Breakeven trigger in R. Default one R
Usage recipes
Intraday trend focus
• Entry mode Both
• ATR anchor Week
• Aggression Long zero point five Aggression Short zero point three
• Stop multiple one point five Take profit two R
• Expect fewer trades that stick to directional pushes and skip treadmill noise
Intraday mean reversion focus
• Session windows optional if you add them in your copy
• ATR anchor Day
• Lower aggression both sides
• Breakeven later and trailing later so the first bounce has room
• This favors fade entries that still convert into trends when the path stays clean
Swing continuation
• Signal timeframe four hours or one day
• Confirm timeframe one day if you choose to include bias
• ATR anchor Week or Month
• Larger base windows and a steady two R target
• This accepts fewer entries and aims for larger holds
Properties visible in this publication
• Initial capital 25.000
• Base currency USD
• Default order size percent of equity value three - 3% of the total capital
• Pyramiding zero
• Commission zero point zero three percent - 0.03% of total capital
• Slippage five ticks
• Process orders on close off
• Recalculate after order is filled off
• Calc on every tick off
• Bar magnifier off
• Any request security calls use lookahead off everywhere
Realism and responsible publication
• No performance promises. Past results never guarantee future outcomes
• Fills and slippage vary by venue and feed
• Strategies run on standard candles only
• Shapes can update while a bar is forming and settle on close
• Keep risk per trade sensible. Around one percent is typical for study. Above five to ten percent is rarely sustainable
Honest limitations and failure modes
• Sudden news and thin liquidity can break assumptions behind entropy and cohesion reads
• Gap heavy symbols often behave better with a True Range basis for risk than a simple range
• Very quiet regimes can reduce score contrast. Consider longer windows or higher thresholds when markets sleep
• Session windows follow the exchange time of the chart if you add them
• If stop and target can both be inside a single bar this strategy prefers stop first to keep accounting conservative
Open source reuse and credits
• No reused open source beyond public domain building blocks such as ATR EMA and linear regression concepts
Legal
Education and research only. Not investment advice. You are responsible for your decisions. Test on history and in simulation with realistic costs

TalaJooy V1.31 𓅂💎 استراتژی معاملاتی TalaJooy V1.31 𓅂
TalaJooy (طلاجوی) یک چارچوب معاملاتی حرفهای و کامل برای TradingView است که برای حذف حدس و گمان، احساسات و تصمیمگیریهای هیجانی از فرآیند معاملات طراحی شده است.
این محصول یک «اندیکاتور سیگنالدهی» ساده نیست؛ بلکه یک استراتژی (Strategy) کامل است که چهار وظیفه کلیدی را به صورت خودکار انجام میدهد:
تحلیل بازار (بر اساس یک موتور امتیازدهی کمی)
صدور سیگنال (ورود و خروج شفاف)
مدیریت ریسک پویا (محاسبه خودکار حد ضرر)
مدیریت حجم پوزیشن (محاسبه خودکار حجم بر اساس ریسک)
هدف «طلاجوی» تبدیل معاملهگری شهودی به یک فرآیند مکانیکی، مبتنی بر داده و مدیریت ریسک است.
⚙️ قابلیتهای کلیدی (آنچه دریافت میکنید)
این استراتژی مجهز به مجموعهای از ابزارهای حرفهای است که مستقیماً روی چارت شما اجرا میشوند:
🎯 ۱. سیگنالهای ورود و خروج شفاف
فلشهای واضح خرید (▲) و فروش (▼) که نقاط دقیق ورود بر اساس منطق استراتژی را مشخص میکنند. این سیستم تنها زمانی سیگنال صادر میکند که فیلترهای روند، همسویی لازم را تایید کنند.
🛡️ ۲. مدیریت ریسک پویای ATR
بزرگترین چالش معاملهگران، تعیین حد ضرر (SL) مناسب است. این استراتژی حد ضرر را به صورت خودکار و پویا بر اساس نوسانات واقعی بازار (با استفاده از ATR) محاسبه میکند.
نتیجه: در بازارهای پرنوسان، استاپ شما برای جلوگیری از استاپهانت شدن، فاصله ایمنتری میگیرد و در بازارهای آرام، بهینهتر و نزدیکتر تنظیم میشود.
💰 ۳. محاسبه خودکار حجم پوزیشن
دیگر نیازی به «ماشین حساب پوزیشن» ندارید. استراتژی به صورت اتوماتیک، حجم دقیق هر معامله را بر اساس درصد ریسک ثابتی که شما از کل سرمایهتان تعیین میکنید، محاسبه مینماید. این ویژگی، مدیریت سرمایه حرفهای را در تمام معاملات شما تضمین میکند.
🎨 ۴. نواحی بصری سود و زیان (TP/SL)
هنگامی که یک معامله باز است، این ابزار به صورت زنده، نواحی حد سود (سبز) و حد ضرر (قرمز) را مشابه ابزار پوزیشن خود تریدینگ ویو، مستقیماً روی چارت برای شما رسم میکند.
📈 ۵. پنل آمار عملکرد پیشرفته
یک جدول آماری جامع که تمام معیارهای کلیدی عملکرد شما را به صورت زنده نمایش میدهد:
سود و زیان خالص (دلاری و درصدی)
ضریب سود (Profit Factor)
نرخ موفقیت (Win Rate)
تعداد معاملات سودده / زیانده
حداکثر افت سرمایه (Max Drawdown)
و موارد دیگر...
🚦 ۶. آیکونهای بازخورد معامله
با آیکونهای هوشمند، فوراً کیفیت معاملات بسته شده خود را ارزیابی کنید:
😎🚀 (سود ویژه و قابل توجه)
💰 (سود عادی)
🙈 (زیان)
📈 چگونه از این ابزار استفاده کنید؟
«طلاجوی» یک 'ماشین چاپ پول' جادویی نیست، بلکه یک ابزار تست و اجرای حرفهای است.
۱. بکتست و بهینهسازی (Backtesting)
مهمترین قدرت این اسکریپت، قابلیت Strategy بودن آن است. شما میتوانید این استراتژی را روی هر جفتارز و تایم فریمی که معامله میکنید (طلا، کریپتو، جفتارزها و...) بکتست بگیرید تا آمار عملکرد آن را مشاهده کنید.
۲. تنظیم پارامترها
از طریق منوی تنظیمات، پارامترهای کلیدی مانند درصد ریسک، نسبت ریسک به ریوارد (R:R)، و فیلترهای زمانی را مطابق با سبک معاملاتی و دارایی مورد نظر خود بهینهسازی کنید.
۳. اجرای سیستماتیک
پس از یافتن تنظیمات بهینه در بکتست، در معاملات زنده به سیگنالها پایبند بمانید و اجازه دهید منطق مکانیکی، معاملات شما را مدیریت کند.
⚠️ سلب مسئولیت مهم (مطابق با قوانین TradingView)
این اسکریپت صرفاً یک ابزار تحلیلی و معاملاتی است و نباید به عنوان سیگنال مالی یا توصیهای برای خرید و فروش تلقی شود. تمام معاملات دارای ریسک هستند و نتایج گذشته تضمینکننده عملکرد آینده نمیباشد.
لطفاً قبل از استفاده از این استراتژی در حساب واقعی، آن را به طور کامل در حالت دمو یا بکتست ارزیابی کنید. مسئولیت تمامی سودها و زیانها بر عهده خود معاملهگر است.
💎 TalaJooy V1.31 𓅂 Trading Strategy
TalaJooy (meaning "Gold Seeker") is a complete, professional trading framework for TradingView, designed to remove guesswork, emotion, and impulsive decisions from your trading process.
This is not a simple signal indicator; it is a complete Strategy script that automates four key tasks:
Market Analysis (Based on a quantitative scoring engine)
Signal Generation (Clear entries and exits)
Dynamic Risk Management (Automated Stop Loss calculation)
Position Sizing (Automated trade sizing based on risk)
The goal of "TalaJooy" is to transform intuitive trading into a mechanical, data-driven, and risk-managed process.
⚙️ Key Features (What You Get)
This strategy comes equipped with a suite of professional tools that run directly on your chart:
🎯 1. Clear Entry & Exit Signals
Receive unambiguous Buy (▲) and Sell (▼) arrows identifying precise entry points based on the strategy's logic. The system only generates signals when its trend-confirmation filters are aligned.
🛡️ 2. Dynamic ATR Risk Management
A trader's biggest challenge is setting a proper Stop Loss (SL). This strategy calculates your SL automatically and dynamically based on real-time market volatility (using ATR).
The Benefit: In volatile markets, your stop is placed at a safer distance to avoid being "stopped out" by noise. In calm markets, it's set tighter and more efficiently.
💰 3. Automated Position Sizing
Stop using external "position size calculators." The strategy automatically calculates the exact trade size for every position based on a fixed risk percentage of your total equity (which you define). This enforces professional money management on every trade.
🎨 4. Visual Profit & Loss (TP/SL) Zones
While a trade is active, this tool plots live, visual zones for your Take Profit (green) and Stop Loss (red) targets, similar to TradingView's native "Long/Short Position" tool.
📈 5. Advanced Performance Stats Panel
A comprehensive statistics table displays all your key performance metrics in real-time:
Net Profit (% and $)
Profit Factor
Win Rate
Win / Loss Trade Count
Max Drawdown
And more...
🚦 6. Smart Trade Feedback Icons
Instantly review the quality of your closed trades with intelligent emoji feedback:
😎🚀 (Exceptional Profit)
💰 (Standard Profit)
🙈 (Loss)
📈 How to Use This Tool
"TalaJooy" is not a "magic money machine"; it is a professional-grade tool for testing and execution.
1. Backtesting & Optimization
The most powerful feature of this script is its Strategy component. You can backtest it on any asset or timeframe you trade (Gold, Crypto, Forex, etc.) to see its historical performance data.
2. Parameter Tuning
Use the settings menu to optimize key parameters—such as Risk Percentage, Risk:Reward Ratio, and core filter settings—to match your personal trading style and preferred assets.
3. Systematic Execution
After identifying optimal settings via backtesting, adhere to the signals in your live trading and let the mechanical logic manage your trades.
⚠️ Important Disclaimer (TradingView Compliant)
This script is provided for educational and analytical purposes only. It is not financial advice or a recommendation to buy or sell any asset. All trading involves substantial risk. Past performance is not indicative of future results.
Please thoroughly evaluate this strategy via backtesting or paper trading before deploying it with real funds. The user assumes full responsibility for all profits and losses incurred.
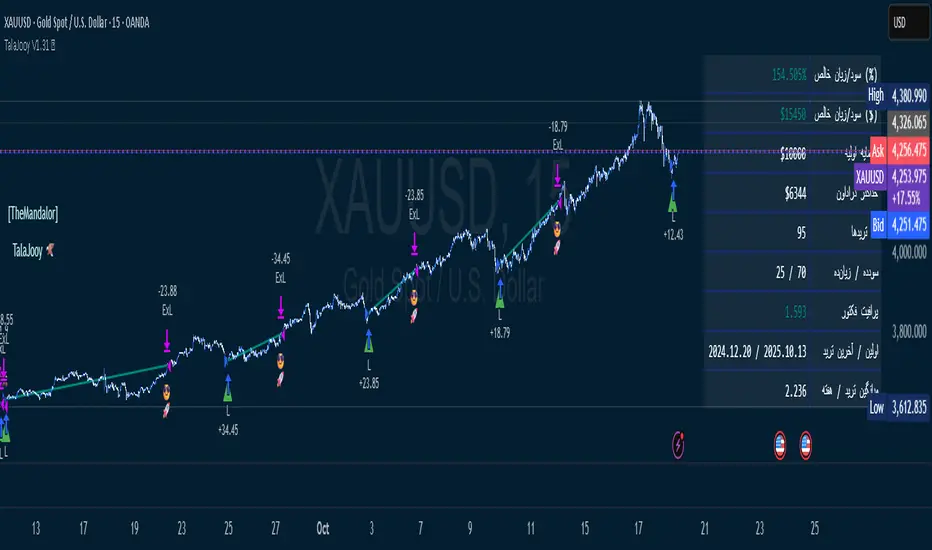
USDJPY Fair Value Gap + Session Strategy🎯 Overview
This strategy combines Fair Value Gaps (FVGs) with session-based order flow analysis, specifically optimized for USDJPY. It identifies price inefficiencies left behind by institutional order flow during high-volatility trading sessions, offering a modern alternative to traditional lagging indicators.
🔬 What Are Fair Value Gaps?
Fair Value Gaps represent areas where aggressive institutional buying or selling created "gaps" in the market structure:
Bullish FVG: Price moves up so aggressively that it leaves unfilled buy orders behind
Bearish FVG: Price moves down so quickly that it leaves unfilled sell orders behind
Research shows approximately 80% of FVGs get "filled" (price returns to the gap) within 20-60 bars, making them highly predictable trading zones.
(see the generated image above)
(see the generated image above)
FVG Detection Logic:
text
// Bullish FVG: Gap between high and current low
bullishFVG = low > high and high > high
// Bearish FVG: Gap between low and current high
bearishFVG = high < low and low < low
🌏 Session-Based Trading
Why Sessions Matter for USDJPY
(see the generated image above)
Tokyo Session (00:00-09:00 UTC)
Highest volatility during first hour (00:00-01:00 UTC)
Average movement: 51-60 pips
Best for breakout strategies
London/NY Overlap (13:00-16:00 UTC)
Maximum liquidity and institutional participation
Tightest spreads and most reliable FVG formations
Optimal for continuation trades
Monday Premium Effect
USDJPY moves 120+ pips on Mondays due to weekend positioning
Enhanced FVG formation during session opens
📊 Strategy Components
(see the generated image above)
1. Fair Value Gap Detection
Identifies bullish and bearish FVGs automatically
Age limit: FVGs expire after 20 bars to avoid stale setups
Size filter: Minimum gap size to filter out noise
2. Session Filtering
Tokyo Open focus: Trades during first hour of Asian session
London/NY Overlap: Captures high-liquidity institutional flows
Weekend gap strategy: Enhanced signals on Monday opens
3. Volume Confirmation
Requires 1.5x average volume spike
Confirms institutional participation
Reduces false signals
4. Trend Alignment
50 EMA filter ensures trades align with higher timeframe trend
Long trades above EMA, short trades below
Prevents costly counter-trend trades
5. Risk Management
2:1 Risk/Reward minimum ensures profitability with 40%+ win rate
Percentage-based stops adapt to USDJPY volatility (0.3% default)
Configurable position sizing
🎯 Entry Conditions
(see the generated image above)
Long Entry (BUY)
✅ Bullish FVG detected in previous bars
✅ Price returns to FVG zone during active trading session
✅ Volume spike above 1.5x average
✅ Price above 50 EMA (trend confirmation)
✅ Bullish candle closes within FVG zone
✅ Trading during Tokyo open OR London/NY overlap
Short Entry (SELL)
✅ Bearish FVG detected in previous bars
✅ Price returns to FVG zone during active trading session
✅ Volume spike above 1.5x average
✅ Price below 50 EMA (trend confirmation)
✅ Bearish candle closes within FVG zone
✅ Trading during Tokyo open OR London/NY overlap
📈 Expected Performance
Backtesting Results (Based on Similar Strategies):
Win Rate: 44-59% (profitable due to high R:R ratio)
Average Winner: 60-90 pips during London/NY sessions
Average Loser: 30-40 pips (tight stops at FVG boundaries)
Risk/Reward: 2:1 minimum, often 3:1 during strong trends
Best Performance: Monday Tokyo opens and Wednesday London/NY overlaps
Why This Works for USDJPY:
90% correlation with US-Japan bond yield spreads
High volatility provides sufficient pip movement
Heavy institutional/central bank participation creates clear FVGs
Consistent volatility patterns across trading sessions
⚙️ Configurable Parameters
Session Settings:
Trade Tokyo Session (Enable/Disable)
Trade London/NY Overlap (Enable/Disable)
FVG Settings:
FVG Minimum Size (Filter small gaps)
Maximum FVG Age (20 bars default)
Show FVG Markers (Visual display)
Volume Settings:
Use Volume Filter (Enable/Disable)
Volume Multiplier (1.5x default)
Volume Average Period (20 bars)
Trend Settings:
Use Trend Filter (Enable/Disable)
Trend EMA Period (50 default)
Risk Management:
Risk/Reward Ratio (2.0 default)
Stop Loss Percentage (0.3% default)
🎨 Visual Indicators
🟡 Yellow Line: 50 EMA trend filter
🟢 Green Triangles: Long entry signals
🔴 Red Triangles: Short entry signals
🟢 Green Dots: Bullish FVG zones
🔴 Red Dots: Bearish FVG zones
🟦 Blue Background: Tokyo open session
🟧 Orange Background: London/NY overlap
📊 Recommended Settings
Optimal Timeframes:
Primary: 5-minute charts (scalping)
Secondary: 15-minute charts (swing trading)
Parameter Optimization:
Conservative: Stop Loss 0.2%, R:R 2:1, Volume 2.0x
Balanced: Stop Loss 0.3%, R:R 2:1, Volume 1.5x (default)
Aggressive: Stop Loss 0.4%, R:R 1.5:1, Volume 1.2x
Risk Management:
Maximum 1-2% of account per trade
Daily loss limit: Stop after 3-5 consecutive losses
Use fixed percentage position sizing
⚠️ Important Considerations
Avoid Trading During:
Major news events (BOJ interventions, NFP, FOMC)
Holiday periods with reduced liquidity
Low volatility Asian afternoon sessions
When US-Japan yield differential narrows sharply
Best Practices:
Limit to 2-3 trades per session maximum
Always respect the 50 EMA trend filter
Never risk more than planned per trade
Paper trade for 2-4 weeks before live implementation
Track performance by session and day of week
🚀 How to Use
Add the script to your USDJPY chart
Set timeframe to 5-minute or 15-minute
Adjust parameters based on your risk tolerance
Enable strategy alerts for automated notifications
Wait for visual signals (triangles) to appear
Enter trades according to your risk management rules
📚 Strategy Foundation
This strategy is based on:
Smart Money Concepts (SMC): Institutional order flow tracking
Market Microstructure: Understanding how FVGs form in electronic trading
Quantified Risk Management: Statistical edge through proper R:R ratios
Session Liquidity Patterns: Exploiting predictable volatility cycles

Ekoparaloji Cyrpto StrategyEkoparaloji Crypto Strategy - User Information Document
📊 Strategy Overview
This strategy provides long-term position management in cryptocurrency markets using the averaging down (pyramiding) technique. The basic logic is to controllably grow positions as prices decline and exit when specific profit targets are reached.
🎯 Key Features
✅ Automatic Entry System
Market direction is determined using a proprietary trend identification algorithm
Trades are only opened in uptrends
Initial position opens automatically when specific conditions are met
📈 Pyramiding Mechanism
New positions are automatically added as price decreases
Up to 10 positions can be added maximum
Each addition occurs at predetermined decline levels
Risk management through dynamic position sizing
💰 Profit and Loss Management
Take Profit: All positions close when the specified percentage above average cost is reached
Stop Loss (Optional): Protects a specified percentage of total capital
A certain ratio of available capital is used in each trade
📊 Visual Tracking System
The following information is displayed in real-time on the chart:
✅ Average cost level
✅ Profit target level
✅ Stop loss level (if active)
✅ Next pyramiding level
✅ Liquidation (capital reset) level
✅ Trend indicator
🛡️ Risk Management Features
1. Dynamic Capital Protection
Automatic exit when losses exceed a specified percentage of total capital
Complete loss scenario can be previewed through liquidation level calculation
2. Position Control System
Protection preventing multiple trades on the same bar
Double trigger prevention mechanism
Maximum position limit
3. Time Filter
Optional trading within a date range
Ideal for testing on historical data
📱 Information Panel
Information table always visible in the upper right corner of the strategy:
When Position is Open:
Number of active positions
Average cost
Current price
Total capital status
Capital loss percentage
Profit target
Stop loss level and distance
Next entry level
Liquidation level and distance
When No Position:
Market trend (Uptrend/Downtrend)
Ready to trade?
Reason for waiting
Initial position size
Target profit percentage
⚙️ Adjustable Parameters
Customizable by user:
💵 Capital Amount: Base amount to be used for each position
📊 Profit Target: Profit percentage at which to exit
🛑 Stop Loss: Usage status and maximum loss percentage
📅 Time Filter: Start and end dates for testing
💬 Trade Comments: Custom labels for each trade
📘 Understanding Leverage Effect
1. What is the Leverage Effect?
Although there's no real leverage in the spot market, when Capital Amount is increased, capital usage works like leverage:
Capital Amount 5% (1.0x): 100% capital usage with full pyramiding = All your money in trades
Capital Amount 10% (2.0x): 200% capital usage with full pyramiding = Attempting to open trades worth 2x your capital
Capital Amount 15% (3.0x): 300% capital usage with full pyramiding = Attempting to open trades worth 3x your capital
⚠️ IMPORTANT: If your capital runs out in the spot market, you cannot open new positions, therefore it's recommended to keep Capital Amount at 5% or below!
⚠️ Important Warnings
Pyramiding Risk: If price continues to decline, position grows and risk increases
Capital Requirements: Up to 10 positions can be added, requiring sufficient capital
Trend Dependency: Only works in uptrends
Backtest Results: Past performance is not a guarantee of future results
Real Trading Risks: Slippage, commissions, and market conditions can affect results
🎓 How to Use
Add the strategy to your chart
Adjust parameters according to your risk appetite
Examine past performance by backtesting
Optionally set up alerts to activate notifications
Test with paper trading first
This strategy is for educational purposes. Do your own research and only trade with capital you can afford to lose.
Disclaimer: This strategy is not financial advice. All investment decisions are the user's responsibility.
Happy trading! 📊

Ekoparaloji Strategy Crypto Ekoparaloji Crypto Strategy - User Information Document
📊 Strategy Overview
This strategy provides long-term position management in cryptocurrency markets using the averaging down (pyramiding) technique. The basic logic is to controllably grow positions as prices decline and exit when specific profit targets are reached.
🎯 Key Features
✅ Automatic Entry System
Market direction is determined using a proprietary trend identification algorithm
Trades are only opened in uptrends
Initial position opens automatically when specific conditions are met
📈 Pyramiding Mechanism
New positions are automatically added as price decreases
Up to 10 positions can be added maximum
Each addition occurs at predetermined decline levels
Risk management through dynamic position sizing
💰 Profit and Loss Management
Take Profit: All positions close when the specified percentage above average cost is reached
Stop Loss (Optional): Protects a specified percentage of total capital
A certain ratio of available capital is used in each trade
📊 Visual Tracking System
The following information is displayed in real-time on the chart:
✅ Average cost level
✅ Profit target level
✅ Stop loss level (if active)
✅ Next pyramiding level
✅ Liquidation (capital reset) level
✅ Trend indicator
🛡️ Risk Management Features
1. Dynamic Capital Protection
Automatic exit when losses exceed a specified percentage of total capital
Complete loss scenario can be previewed through liquidation level calculation
2. Position Control System
Protection preventing multiple trades on the same bar
Double trigger prevention mechanism
Maximum position limit
3. Time Filter
Optional trading within a date range
Ideal for testing on historical data
📱 Information Panel
Information table always visible in the upper right corner of the strategy:
When Position is Open:
Number of active positions
Average cost
Current price
Total capital status
Capital loss percentage
Profit target
Stop loss level and distance
Next entry level
Liquidation level and distance
When No Position:
Market trend (Uptrend/Downtrend)
Ready to trade?
Reason for waiting
Initial position size
Target profit percentage
⚙️ Adjustable Parameters
Customizable by user:
💵 Capital Amount: Base amount to be used for each position
📊 Profit Target: Profit percentage at which to exit
🛑 Stop Loss: Usage status and maximum loss percentage
📅 Time Filter: Start and end dates for testing
💬 Trade Comments: Custom labels for each trade
📘 Understanding Leverage Effect
1. What is the Leverage Effect?
Although there's no real leverage in the spot market, when Capital Amount is increased, capital usage works like leverage:
Capital Amount 5% (1.0x): 100% capital usage with full pyramiding = All your money in trades
Capital Amount 10% (2.0x): 200% capital usage with full pyramiding = Attempting to open trades worth 2x your capital
Capital Amount 15% (3.0x): 300% capital usage with full pyramiding = Attempting to open trades worth 3x your capital
⚠️ IMPORTANT: If your capital runs out in the spot market, you cannot open new positions, therefore it's recommended to keep Capital Amount at 5% or below!
⚠️ Important Warnings
Pyramiding Risk: If price continues to decline, position grows and risk increases
Capital Requirements: Up to 10 positions can be added, requiring sufficient capital
Trend Dependency: Only works in uptrends
Backtest Results: Past performance is not a guarantee of future results
Real Trading Risks: Slippage, commissions, and market conditions can affect results
🎓 How to Use
Add the strategy to your chart
Adjust parameters according to your risk appetite
Examine past performance by backtesting
Optionally set up alerts to activate notifications
Test with paper trading first
This strategy is for educational purposes. Do your own research and only trade with capital you can afford to lose.
Disclaimer: This strategy is not financial advice. All investment decisions are the user's responsibility.

Strategy with Reference Lines📊 Strategy with Reference Lines
Description:
This strategy uses a contrarian approach based on the analysis of the previous candle to identify entry and exit points. The strategy draws horizontal reference lines at important levels of the previous candle and generates buy/sell signals based on the candle's direction.
Key Features:
🔹 Multi-Timeframe Analysis: Configurable for 1H, 2H, 3H, 4H, 6H, 12H, and 1D
🔹 Reference Lines: High, low, close, and midpoint (50%) of the previous candle
🔹 Visual Signals: Labels with prices and actions (BUY/SELL/TP)
🔹 Optional Trading: Enable/disable automatic order execution
🔹 Complete System: Automatic entry, Take Profit, and Stop Loss
🔹 Alerts: Notifications when a new candle is detected
Strategy Logic:
When the previous candle is POSITIVE:
Signal: 🔴 SELL at the previous candle's close
Take Profit: 🎯 Midpoint (50%) of the previous candle
Stop Loss: 🔴 High of the previous candle
When the previous candle is NEGATIVE:
Signal: 🟢 BUY at the previous candle's close
Take Profit: 🎯 Midpoint (50%) of the previous candle
Stop Loss: 🟢 Low of the previous candle
Visual Elements:
Green Line: High of the previous candle (when positive)
Red Line: Low of the previous candle (when negative)
Yellow Line: Close of the previous candle (always present)
Blue Line: Midpoint (50%) of the previous candle (always present)
Labels: Prices and actions with emojis for easy identification
Settings:
Timeframe: Default 4H (configurable)
Auto Trading: Disabled by default (safety)
Alerts: Include entry prices, TP, and SL
Recommended Usage:
✅ Visual Analysis: Use with trading disabled for analysis
✅ Backtesting: Enable trading to test historically
✅ Swing Trading: Ideal for 4H or higher timeframes
✅ Risk Management: Automatic SL and TP for protection
Risk Disclaimer:
This strategy is for educational and analysis purposes only. Always test in a simulation environment before using with real capital. Trading involves significant risks and may result in losses.

LW Outside Day Strategy[SpeculationLab]This strategy is inspired by the “Outside Day” concept introduced by Larry Williams in Long-Term Secrets to Short-Term Trading, and has been extended with configurable risk management tools and realistic backtesting parameters.
Concept
The “Outside Day” is a classic price action pattern that reflects strong market rejection or continuation pressure.
An Outside Bar occurs when the current bar’s high exceeds the previous high and the low falls below the previous low.
A body-size filter ensures only significant candles are included.
Entry Logic
Buy setup: Price closes below the previous low (bullish rejection).
Sell setup: Price closes above the previous high (bearish rejection).
Only confirmed bars are used (no intrabar signals).
Stop-Loss Modes
Prev Low/High: Uses the previous swing point ± ATR-based buffer.
ATR: Dynamic stop based on Average True Range × multiplier.
Fixed Pips: User-defined fixed distance (for forex testing).
Take-Profit Modes
Prev High/Low (PHL): Exits near the opposite swing.
Risk-Reward (RR): Targets a user-defined multiple of the stop distance (default = 2 : 1).
Following Price Open (FPO): Exits on the next bar’s open if price opens in profit (used to test overnight price continuation).
Risk Management & Backtest Settings
Default risk per trade is set at 10% of account equity (user-adjustable).
Commission = 0.1% and slippage = 2 ticks are applied to simulate realistic conditions.
For reliable statistics, test on data that yields over 100 trades.
Suitable for daily and 4-hour timeframes across stocks, forex, and crypto markets.
Visual Elements
Green and red triangles show entry signals.
Stop-loss (red) and take-profit (green) reference lines are drawn for clarity.
Optional alerts notify when a valid setup forms.
Disclaimer
This script is for educational and research purposes only.
It does not constitute financial advice or guarantee profits.
Always backtest thoroughly and manage your own risk.
Enhancements over Classic Outside Bar Models
Adjustable stop and target logic with ATR and buffer multipliers.
“Following Price Open” exit logic for realistic day-end management.
Optimized to avoid repainting and bar-confirmation issues.
Built with realistic trading costs and position sizing.
策略逻辑
外包线识别
当日最高价高于前一日最高价,且当日最低价低于前一日最低价,即形成外包线。
同时过滤掉较小实体的 K 线,仅保留实体显著大于前一根的形态。
方向过滤
收盘价低于前一日最低价 → 视为买入信号。
收盘价高于前一日最高价 → 视为卖出信号。
止损设置(可选参数)
前低/高止损:以形态前低/前高为止损,带有缓冲倍数。
ATR 止损:根据平均波动率(ATR)动态调整。
固定点数止损:按照用户设定的点数作为止损范围。
止盈设置(可选参数)
前高/低止盈(PHL):以前高/前低为目标。
固定盈亏比(RR):根据用户设定的风险回报比自动计算。
隔夜开盘(FPO):若次日开盘价高于进场价(多单)或低于进场价(空单),则平仓。
信号标记
在图表中标注买入/卖出信号(三角形标记)。
绘制止损与目标位参考线。
使用说明
适用周期:建议用于 日线图(Daily)。
适用市场:股票、外汇、加密货币等各类市场均可。
提示:此策略为历史研究与学习用途,不构成投资建议。实际交易请结合自身风险管理。
