SMC 自動交易 - 4HR- BTC適用# SMC Automated Trading Strategy Whitepaper - Stepped Enhanced Edition
## 1. Strategy Overview
This strategy is designed based on the Smart Money Concept (SMC), integrating Order Block (OB), Change of Character (CHoCH), and strict pullback confirmation conditions. The goal is to enhance trading accuracy and strictly control risk, specifically tailored for trading competitions, meeting the requirements of stability and efficiency.
### Core Strategy Concepts:
- Precise identification of key trend reversal points.
- Strict pullback confirmation to avoid chasing tops or bottoms.
- Clear risk management and take-profit mechanisms to maintain stable risk-reward ratio.
- Supports trading time filtering (Kill Zone) to capture prime volatility windows.
- Multiple visual aids for quick in-trade signal recognition.
## 2. Strategy Logic Flow
### 1. Kill Zone (Optional Activation)
- Default trading time: Taiwan time 15:00 - 18:00.
- Purpose: Focus on high-volatility periods to reduce false signals in choppy markets.
### 2. Order Block Detection
- Current candle range exceeds the previous candle by a specified multiplier (default 0.8).
- Bullish OB: Bullish candle with expanded range.
- Bearish OB: Bearish candle with expanded range.
- Flexible OB sensitivity adjustment according to market volatility.
### 3. Change of Character (CHoCH)
- Initial trend reversal confirmation:
- Bullish CHoCH: Close above previous candle’s high.
- Bearish CHoCH: Close below previous candle’s low.
### 4. Pullback Confirmation (Core Condition)
- Avoid premature entries by requiring a pullback to the prior OB:
- Long: Pullback touches the previous Bullish OB high.
- Short: Pullback touches the previous Bearish OB low.
### 5. Fair Value Gap (FVG) Detection (Optional)
- Detect price imbalances as additional confirmation signals.
## 3. Entry Logic
### Long Position:
- Previous Bullish OB is formed.
- Current candle completes a pullback to the prior OB high.
- Current candle closes above the previous high (CHoCH confirmation).
- (Optional) Within Kill Zone.
### Short Position:
- Previous Bearish OB is formed.
- Current candle completes a pullback to the prior OB low.
- Current candle closes below the previous low (CHoCH confirmation).
- (Optional) Within Kill Zone.
## 4. Risk Management & Exit Strategy
### Stop Loss:
- Long: Current candle’s low minus buffer points (default 50 points).
- Short: Current candle’s high plus buffer points (default 50 points).
### Take Profit:
- Default Risk-Reward Ratio (RR): 2.0 (customizable).
- Automatically calculates target take-profit level.
### Full Automation:
- This is a fully automated strategy. Orders are placed automatically upon conditions being met, requiring no manual intervention.
## 5. Visual Aids
- Bullish OB: Green upward triangle.
- Bearish OB: Red downward triangle.
- Bullish CHoCH: Blue circle.
- Bearish CHoCH: Orange circle.
- FVG: Highlighted zones (optional).
> **Advantage:** Quick market status recognition during trades, improving strategy transparency.
## 6. Strategy Advantages
✅ Dual trend reversal confirmation: OB + CHoCH.
✅ Strict pullback requirement to reduce false breakouts.
✅ Clear risk control and stable risk-reward ratio.
✅ Visual aids + time filter for clear in-trade decisions.
✅ Fully automated trading reduces human error.
## 7. Application Scenarios
- Trading competitions: Designed for high win-rate and strict risk control.
- FTMO and similar evaluation challenges.
- Intraday or swing trading strategy frameworks.
- High-volatility assets: Crypto / Forex / Index CFDs.
## 8. Risk Warning
- Strategy is based on historical backtesting; live trading should consider slippage and liquidity risks.
- During high volatility periods, use proper money management tools and strictly execute stop losses.
## 9. Version Note
Version: Stepped Enhanced Edition (Updated April 2025)
Developer: natwad3000
Cari dalam skrip untuk "profit"

Universal Breakout Strategy [KedArc Quant]Description:
A flexible breakout framework where you can test different logics (Prev Day, Bollinger, Volume, ATR, EMA Trend, RSI Confirm, Candle Confirm, Time Filter) under one system.
Choose your breakout mode, and the strategy will handle entries, exits, and optional risk management (ATR stops, take-profits, daily loss guard, cooldowns).
An on-chart info table shows live mode values (like Prev High/Low, Bollinger levels, RSI, etc.) plus P&L stats for quick analysis.
Use it to compare which breakout style works best on your instrument and timeframe, whether intraday, swing, or positional trading
🔑 Why it’s useful
* Flexibility: Switch between breakout strategies without loading different indicators.
* Clarity: On-chart info table displays current mode, relevant indicator levels, and live strategy P&L stats.
* Testing efficiency: Quickly A/B test different breakout styles under the same backtest environment.
* Transparency: Every trade is rule-based and displayed with entry/exit markers.
🚀 How it helps traders
* Lets you experiment with breakout strategies quickly without loading multiple scripts.
* Helps identify which breakout method fits your instrument & timeframe.
* Gives clear on-chart visual + statistical feedback for confident decision-making.
⚙️ Input Configuration
* Breakout Mode → choose which strategy to test:
* *Prev Day* → breakouts of yesterday’s High/Low.
* *Bollinger* → Upper/Lower BB pierce.
* *Volume* → Breakout confirmed with volume above average.
* *ATR Stop* → Wide range breakout using ATR filter.
* *Time Filter* → Breakouts inside defined session hours.
* *EMA Trend* → Breakouts only in EMA fast > slow alignment.
* *RSI Confirm* → Breakouts with RSI confirmation (e.g. >55 for longs).
* *Candle Confirm* → Breakouts validated by bullish/bearish candle.
* Lookback / ATR / Bollinger inputs → adjust sensitivity.
* Intrabar mode → option to evaluate breakouts using bar highs/lows instead of closes.
* Table options → show/hide info table, show/hide P&L stats, choose corner placement.
📈 Entry & Exit Logic
* Entry → occurs when breakout condition of chosen mode is met.
* Exit → default exits via opposite signals or optional stop/target if enabled.
* Session filter → optional auto-flat at session end.
* P&L management → optional daily loss guard, cooldown between trades, and ATR-based stop/take profit.
❓ FAQ — Choosing the best setup
Q: Which strategy should I use for which chart?
* *Prev Day Breakouts*: Best on indices, FX, and liquid futures with strong daily levels.
* *Bollinger*: Works well in range-bound environments, or crypto pairs with volatility compression.
* *Volume*: Good on equities where breakout strength is tied to volume spikes.
* *ATR Stop*: Suits volatile instruments (commodities, crypto).
* *EMA Trend*: Useful in trending markets (stocks, indices).
* *RSI Confirm*: Adds momentum filter, better for swing trades.
* *Candle Confirm*: Ideal for scalpers needing visual confirmation.
* *Time Filter*: For intraday traders who want signals only in high-liquidity sessions.
Q: What timeframe should I use?
* Intraday traders → 5m to 15m (Time Filter, Candle Confirm).
* Swing traders → 1H to 4H (EMA Trend, RSI Confirm, ATR Stop).
* Position traders → Daily (Prev Day, Bollinger).
* Breakout
A trade entry condition triggered when price crosses above a resistance level (for longs) or below a support level (for shorts).
* Prev Day High/Low
Formula:
Prev High = High of (Day )
Prev Low = Low of (Day )
* Bollinger Bands
Formula:
Basis = SMA(Close, Length)
Upper Band = Basis + (Multiplier × StdDev(Close, Length))
Lower Band = Basis – (Multiplier × StdDev(Close, Length))
* Volume Confirmation
A breakout is only valid if:
Volume > SMA(Volume, Length)
* ATR (Average True Range)
Measures volatility.
Formula:
ATR = SMA(True Range, Length)
where True Range = max(High–Low, |High–Close |, |Low–Close |)
* EMA (Exponential Moving Average)
Weighted moving average giving more weight to recent prices.
Formula:
EMA = (Price × α) + (EMA × (1–α))
with α = 2 / (Length + 1)
* RSI (Relative Strength Index)
Momentum oscillator scaled 0–100.
Formula:
RSI = 100 – (100 / (1 + RS))
where RS = Avg(Gain, Length) ÷ Avg(Loss, Length)
* Candle Confirmation
Bullish candle: Close > Open AND Close > Close
Bearish candle: Close < Open AND Close < Close
Win Rate (%)
Formula:
Win Rate = (Winning Trades ÷ Total Trades) × 100
* Average Trade P&L
Formula:
Avg Trade = Net Profit ÷ Total Trades
📊 Performance Notes
The Universal Breakout Strategy is designed as a framework rather than a single-asset optimized system. Results will vary depending on the chart, timeframe, and asset chosen.
On the current defaults (15-minute, INR-denominated example), the backtest produced 132 trades over the selected period. This provides a statistically sufficient sample size.
Win rate (~35%) is relatively low, but this is balanced by a positive reward-to-risk ratio (~1.8). In practice, a lower win rate with larger wins versus smaller losses is sustainable.
The average P&L per trade is close to breakeven under default settings. This is expected, as the strategy is not tuned for a single symbol but offered as a universal breakout framework.
Commissions (0.1%) and slippage (1 tick) are included in the simulation, ensuring realistic conditions.
Risk management is conservative, with order sizing set at 1 unit per trade. This avoids over-leveraging and keeps exposure well under the 5-10% equity risk guideline.
👉 Traders are encouraged to:
Experiment with inputs such as ATR period, breakout length, or Bollinger parameters.
Test across different timeframes and instruments (equities, futures, forex, crypto) to find optimal setups.
Combine with filters (trend direction, volatility regimes, or volume conditions) for further refinement.
⚠️ Disclaimer This script is provided for educational purposes only.
Past performance does not guarantee future results.
Trading involves risk, and users should exercise caution and use proper risk management when applying this strategy.

RSI Momentum ScalperOverview
The "RSI Momentum Scalper" is a Pine Script v5 strategy crafted for trading highly volatile markets, with a special focus on newly listed cryptocurrencies. This strategy harnesses the Relative Strength Index (RSI) alongside volume analysis and momentum thresholds to pinpoint short-term trading opportunities. It supports both long and short trades, managed with customizable take profit, stop loss, and trailing stop levels, which are visually plotted on the chart for easy tracking.
Why I Created This Strategy
I developed the "RSI Momentum Scalper" because I was seeking a reliable trading strategy tailored to newly listed, highly volatile cryptocurrencies. These assets often experience rapid price fluctuations, rendering traditional strategies less effective. I aimed to create a tool that could exploit momentum and volume spikes while managing risk through adaptable exit parameters. This strategy is designed to address that need, offering a flexible approach for traders in dynamic crypto markets.
How It Works
The strategy utilizes RSI to identify momentum shifts, combined with volume confirmation, to trigger long or short entries. Trades are controlled with take profit, stop loss, and trailing stop levels, which adjust dynamically as the price moves in your favor. The trailing stop helps lock in profits, while the plotted exit levels provide clear visual cues for trade management.
Customizable Settings
The script is highly customizable, allowing you to adjust it to various market conditions and trading styles. Here’s a brief overview of the key settings:
Trade Mode: Select "Both," "Long Only," or "Short Only" to determine the trade direction.
(Default: Both)
RSI Length: Sets the lookback period for the RSI calculation (2 to 30).
(Default: 8)
A shorter length increases RSI sensitivity, suitable for volatile assets.
RSI Overbought: Defines the upper RSI threshold (60 to 99) for short entries.
(Default: 90)
Higher values signal stronger overbought conditions.
RSI Oversold: Defines the lower RSI threshold (1 to 40) for long entries.
(Default: 10)
Lower values indicate stronger oversold conditions.
RSI Momentum Threshold: Sets the minimum RSI momentum change (1 to 15) to trigger entries.
(Default: 14)
Adjusts the sensitivity to price momentum.
Volume Multiplier: Multiplies the volume moving average to filter high-volume bars (1.0 to 3.0).
(Default: 1)
Higher values require stronger volume confirmation.
Volume MA Length: Sets the lookback period for the volume moving average (5 to 50).
(Default: 13)
Influences the volume trend sensitivity.
Take Profit %: Sets the profit target as a percentage of the entry price (0.1 to 10.0).
(Default: 4.15)
Determines when to close a winning trade.
Stop Loss %: Sets the loss limit as a percentage of the entry price (0.1 to 6.0).
(Default: 1.85)
Protects against significant losses.
Trailing Stop %: Sets the trailing stop distance as a percentage (0.1 to 4.0).
(Default: 2.55)
Locks in profits as the price moves favorably.
Visual Features
Exit Levels: Take profit (green), fixed stop loss (red), and trailing stop (orange) levels are plotted when in a position.
Performance Table: Displays win rate, total trades, and net profit in the top-right corner.
How to Use
Add the strategy to your chart in TradingView.
Adjust the input settings based on the cryptocurrency and timeframe you’re trading.
Monitor the plotted exit levels for trade management.
Use the performance table to assess the strategy’s performance over time.
Notes
Test the strategy on a demo account or with historical data before live trading.
The strategy is optimized for short-term scalping; adjust settings for longer timeframes if needed.

The Best Strategy Template[LuciTech]Hello Traders,
This is a powerful and flexible strategy template designed to help you create, backtest, and deploy your own custom trading strategies. This template is not a ready-to-use strategy but a framework that simplifies the development process by providing a wide range of pre-built features and functionalities.
What It Does
The LuciTech Strategy Template provides a robust foundation for building your own automated trading strategies. It includes a comprehensive set of features that are essential for any serious trading strategy, allowing you to focus on your unique trading logic without having to code everything from scratch.
Key Features
The LuciTech Strategy Template integrates several powerful features to enhance your strategy development:
•
Advanced Risk Management: This includes robust controls for defining your Risk Percentage per Trade, setting a precise Risk-to-Reward Ratio, and implementing an intelligent Breakeven Stop-Loss mechanism that automatically adjusts your stop to the entry price once a specified profit threshold is reached. These elements are crucial for capital preservation and consistent profitability.
•
Flexible Stop-Loss Options: The template offers adaptable stop-loss calculation methods, allowing you to choose between ATR-Based Stop-Loss, which dynamically adjusts to market volatility, and Candle-Based Stop-Loss, which uses structural price points from previous candles. This flexibility ensures the stop-loss strategy aligns with diverse trading styles.
•
Time-Based Filtering: Optimize your strategy's performance by restricting trading activity to specific hours of the day. This feature allows you to avoid unfavorable market conditions or focus on periods of higher liquidity and volatility relevant to your strategy.
•
Customizable Webhook Alerts: Stay informed with advanced notification capabilities. The template supports sending detailed webhook alerts in various JSON formats (Standard, Telegram, Concise Telegram) to external platforms, facilitating real-time monitoring and potential integration with automated trading systems.
•
Comprehensive Visual Customization: Enhance your analytical clarity with extensive visual options. You can customize the colors of entry, stop-loss, and take-profit lines, and effectively visualize market inefficiencies by displaying and customizing Fair Value Gap (FVG) boxes directly on your chart.
How It Does It
The LuciTech Strategy Template is meticulously crafted using Pine Script, TradingView's powerful and expressive programming language. The underlying architecture is designed for clarity and modularity, allowing for straightforward integration of your unique trading signals. At its core, the template operates by taking user-defined entry and exit conditions and then applying a sophisticated layer of risk management, position sizing, and trade execution logic.
For instance, when a longCondition or shortCondition is met, the template dynamically calculates the appropriate position size. This calculation is based on your specified risk_percent of equity and the stop_distance (the distance between your entry price and the calculated stop-loss level). This ensures that each trade adheres to your predefined risk parameters, a critical component of disciplined trading.
The flexibility in stop-loss calculation is achieved through a switch statement that evaluates the sl_type input. Whether you choose an ATR-based stop, which adapts to market volatility, or a candle-based stop, which uses structural price points, the template seamlessly integrates these methods. The ATR calculation itself is further refined by allowing various smoothing methods (RMA, SMA, EMA, WMA), providing granular control over how volatility is measured.
Time-based filtering is implemented by comparing the current bar's time with user-defined start_hour, start_minute, end_hour, and end_minute inputs. This allows the strategy to activate or deactivate trading during specific market sessions or periods of the day, a valuable tool for optimizing performance and avoiding unfavorable conditions.
Furthermore, the template incorporates advanced webhook alert functionality. When a trade is executed, a customizable JSON message is formatted based on your webhook_format selection (Standard, Telegram, or Concise Telegram) and sent via alert function. This enables seamless integration with external services for real-time notifications or even automated trade execution through third-party platforms.
Visual feedback is paramount for understanding strategy behavior. The template utilizes plot and fill functions to clearly display entry prices, stop-loss levels, and take-profit targets directly on the chart. Customizable colors for these elements, along with dedicated options for Fair Value Gap (FVG) boxes, enhance the visual analysis during backtesting and live trading, making it easier to interpret the strategy's actions.
How It's Original
The LuciTech Strategy Template distinguishes itself in the crowded landscape of TradingView scripts through its unique combination of integrated, advanced risk management features, highly flexible stop-loss methodologies, and sophisticated alerting capabilities, all within a user-friendly and modular framework. While many templates offer basic entry/exit signal integration, LuciTech goes several steps further by providing a robust, ready-to-use infrastructure for managing the entire trade lifecycle once a signal is generated.
Unlike templates that might require users to piece together various risk management components or code complex stop-loss logic from scratch, LuciTech offers these critical functionalities out-of-the-box. The inclusion of dynamic position sizing based on a user-defined risk percentage, a configurable risk-to-reward ratio, and an intelligent breakeven mechanism significantly elevates its utility. This comprehensive approach to capital preservation and profit targeting is a cornerstone of professional trading and is often overlooked or simplified in generic templates.
Furthermore, the template's provision for multiple stop-loss calculation types—ATR-based for volatility adaptation, and candle-based for structural support/resistance—demonstrates a deep understanding of diverse trading strategies. The underlying code for these calculations is already implemented, saving developers considerable time and effort. The subtle yet powerful inclusion of FVG (Fair Value Gap) related inputs also hints at advanced price action concepts, offering a sophisticated layer of analysis and execution that is not commonly found in general-purpose templates.
The advanced webhook alerting system, with its support for various JSON formats tailored for platforms like Telegram, showcases an originality in catering to the needs of modern, automated trading setups. This moves beyond simple TradingView pop-up alerts, enabling seamless integration with external systems for real-time trade monitoring and execution. This level of external connectivity and customizable data output is a significant differentiator.
In essence, the LuciTech Strategy Template is original not just in its individual features, but in how these features are cohesively integrated to form a powerful, opinionated, yet highly adaptable system. It empowers traders to focus their creative energy on developing their core entry/exit signals, confident that the underlying framework will handle the complexities of risk management, trade execution, and external communication with precision and flexibility. It's a comprehensive solution designed to accelerate the development of robust and professional trading strategies.
How to Modify the Logic to Apply Your Strategy
The LuciTech Strategy Template is designed with modularity in mind, making it exceptionally straightforward to integrate your unique trading strategy logic. The template provides a clear separation between the core strategy management (risk, position sizing, exits) and the entry signal generation. This allows you to easily plug in your own buy and sell conditions without altering the robust underlying framework.
Here’s a step-by-step guide on how to adapt the template to your specific trading strategy:
1.
Locate the Strategy Logic Section:
Open the Pine Script editor in TradingView and navigate to the section clearly marked with the comment //Strategy Logic Example:. This is where the template’s placeholder entry conditions (a simple moving average crossover) are defined.
2.
Define Your Custom Entry Conditions:
Within this section, you will find variables such as longCondition and shortCondition. These are boolean variables that determine when a long or short trade should be initiated. Replace the existing example logic with your own custom buy and sell conditions. Your conditions can be based on any combination of indicators, price action patterns, candlestick formations, or other market analysis techniques. For example, if your strategy involves a combination of RSI and MACD, you would define longCondition as (rsi > 50 and macd_line > signal_line) and shortCondition as (rsi < 50 and macd_line < signal_line).
3.
Leverage the Template’s Built-in Features:
Once your longCondition and shortCondition are defined, the rest of the template automatically takes over. The integrated risk management module will calculate the appropriate position size based on your Risk % input and the chosen Stop Loss Type. The Risk:Reward ratio will determine your take-profit levels, and the Breakeven at R feature will manage your stop-loss dynamically. The time filter (Use Time Filter) will ensure your trades only occur within your specified hours, and the webhook alerts will notify you of trade executions.

SMA Cross 5/50 with Trend Filter & Risk Management by JuggiDThe basic SMA (5/50) crossover strategy can be enhanced to improve profitability by adding filters and risk management. For example, a long entry is triggered only when the fast SMA (5) crosses above the slow SMA (50) **and** the price is above the SMA (200), ensuring trades align with the major trend. Similarly, a short entry requires the crossover confirmation plus the price staying below the SMA (200). To reduce false signals and protect capital, stop-loss and take-profit levels can be set automatically (e.g., 2% loss, 5% gain), while additional confirmation tools such as volume spikes, RSI above 50, or MACD momentum can be applied to validate stronger signals. This approach helps avoid whipsaws in sideways markets and allows trades to capture larger moves while minimizing downside risk.

EMA inFusion Pro - Multiple SourcesEMA Fusion Pro: Dynamic Trend & Momentum Strategy with Three Exit Modes
EMA Fusion Pro is a highly customizable, multi-exit trend-following strategy designed for traders who value both precision and flexibility. By leveraging exponential moving averages (EMA), average directional index (ADX), and volume analysis, this strategy aims to capture trending market moves while offering three distinct exit modes for optimal risk management across varying market conditions.
Strategy Overview
This strategy systematically identifies potential entry points using a moving average crossover with highly configurable data sources (including price, volume, rate of change, or their Heikin Ashi versions) and filters signal quality with ADX trend strength and volume spikes. Each trade is managed with one of three advanced exit methodologies—reverse signal, ATR-based stop/take profit, or fixed percentage—giving you the control to adapt your risk profile to different market regimes.
Key Features
Customizable EMA Source: Calculate the core trend-filtering EMA from price (default), volume, rate of change, or their Heikin Ashi counterparts for unique market perspectives.
Trend Filter with ADX: Confirm entries only when the trend is strong, as measured by the user-adjustable ADX threshold.
Volume Spike Confirmation: Optional filter to only take trades with above-average volume activity, reducing false signals.
Three Exit Modes:
Reverse Signal: Exit trades when a new, opposite entry signal occurs.
ATR-Based Stop/Take Profit: Dynamic risk management using multiples of the average true range (ATR) for both take profit and stop loss.
Percent-Based Stop/Take Profit: Fixed-percentage risk management with user-defined thresholds.
Visual Annotations: Signal markers, EMA line color-coded by source, trend background coloring, and optional ATR/percent-based TP/SL levels.
Info Panel: Real-time display of all core indicators, current trading mode, exit parameters, and position status for quick oversight.
How It Works
Entry Logic: A crossover signal (above/below the EMA) triggers a new entry, but only if both ADX trend strength and (optionally) volume spike conditions are met.
Exit Logic: Three selectable modes allow you to exit trades on reverse signals, at a dynamic ATR-based profit or loss, or at a fixed percentage gain/loss.
Flexible Data Analysis: The EMA source can be chosen from six options—standard price, volume, rate of change, or their Heikin Ashi variants—allowing experimentation with different market dimensions.
Risk Management: All exits are precisely controlled, either by the next opposing signal, by volatility-adjusted levels, or by fixed risk/reward ratios.
Backtest & Optimization: The strategy is fully backtestable within TradingView’s Strategy Tester, with adjustable parameters for optimization.
Customization & Usage
Indicator Source: Select your preferred data type for EMA calculation, opening the door to creative strategy variations (e.g., volume momentum, pure price trend, rate of change divergence).
Filter Toggles: Enable/disable ADX and volume filters as desired—useful for different market environments.
Exit Mode Selection: Switch between reverse, ATR, or percent-based exits with a single parameter—ideal for adapting to ranging vs. trending markets.
Visual Clarity: The EMA line color reflects its underlying source, and the info panel summarizes all critical values for easy monitoring.
Who Should Use This Strategy?
Trend Followers seeking to ride strong moves with multiple exit options.
Experienced Traders who want to experiment with different data types (volume, momentum, Heikin Ashi) for trend analysis.
Algorithmic Traders looking for a robust, flexible base to build upon with their own ideas.
Getting Started
Apply the script to your chart and review default settings.
Customize parameters—EMA length, ADX threshold, volume settings, exit type—as desired.
Backtest on multiple instruments and timeframes to evaluate performance.
Optimize filters, exit rules, and risk parameters for your preferred trading style.
Monitor with the real-time info panel and trade alerts.
Disclaimer
This script is for educational and entertainment purposes only. It is not financial advice. Past performance is not indicative of future results. Always conduct thorough testing and consider your risk tolerance before trading real capital.
— Happy Trading —
Feel free to adapt, share, and contribute to this open-source strategy!

J12Matic Builder by galgoomA flexible Renko/tick strategy that lets you choose between two entry engines (Multi-Source 3-way or QBand+Moneyball), with a unified trailing/TP exit engine, NY-time trading windows with auto-flatten, daily profit/loss and trade-count limits (HALT mode), and clean webhook routing using {{strategy.order.alert_message}}.
Highlights
Two entry engines
Multi-Source (3): up to three long/short sources with Single / Dual / Triple logic and optional lookback.
QBand + Moneyball: Gate → Trigger workflow with timing windows, OR/AND trigger modes, per-window caps, optional same-bar fire.
Unified exit engine: Trailing by Bricks or Ticks, plus optional static TP/SL.
Session control (NY time): Evening / Overnight / NY Session windows; auto-flatten at end of any enabled window.
Day controls: Profit/Loss (USD) and Trade-count limits. When hit, strategy HALTS new entries, shows an on-chart label/background.
Alert routing designed for webhooks: Every order sets alert_message= so you can run alerts with:
Condition: this strategy
Notify on: Order fills only
Message: {{strategy.order.alert_message}}
Default JSONs or Custom payloads: If a Custom field is blank, a sensible default JSON is sent. Fill a field to override.
How to set up alerts (the 15-second version)
Create a TradingView alert with this strategy as Condition.
Notify on: Order fills only.
Message: {{strategy.order.alert_message}} (exactly).
If you want your own payloads, paste them into Inputs → 08) Custom Alert Payloads.
Leave blank → the strategy sends a default JSON.
Fill in → your text is sent as-is.
Note: Anything you type into the alert dialog’s Message box is ignored except the {{strategy.order.alert_message}} token, which forwards the payload supplied by the strategy at order time.
Publishing notes / best practices
Renko users: Make sure “Renko Brick Size” in Inputs matches your chart’s brick size exactly.
Ticks vs Bricks: Exit distances switch instantly when you toggle Exit Units.
Same-bar flips: If enabled, a new opposite signal will first close the open trade (with its exit payload), then enter the new side.
HALT mode: When day profit/loss limit or trade-count limit triggers, new entries are blocked for the rest of the session day. You’ll see a label and a soft background tint.
Session end flatten: Auto-closes positions at window ends; these exits use the “End of Session Window Exit” payload.
Bar magnifier: Strategy is configured for on-close execution; you can enable Bar Magnifier in Properties if needed.
Default JSONs (used when a Custom field is empty)
Open: {"event":"open","side":"long|short","symbol":""}
Close: {"event":"close","side":"long|short|flat","reason":"tp|sl|flip|session|limit_profit|limit_loss","symbol":""}
You can paste any text/JSON into the Custom fields; it will be forwarded as-is when that event occurs.
Input sections — user guide
01) Entries & Signals
Entry Logic: Choose Multi-Source (3) or QBand + Moneyball (pick one).
Enable Long/Short Signals: Master on/off switches for entering long/short.
Flip on opposite signal: If enabled, a new opposite signal will close the current position first, then open the other side.
Signal Logic (Multi-Source):
Single: any 1 of the 3 sources > 0
Dual: Source1 AND Source2 > 0
Triple (default): 1 AND 2 AND 3 > 0
Long/Short Signal Sources 1–3: Provide up to three series (often indicators). A positive value (> 0) is treated as a “pulse”.
Use Lookback: Keeps a source “true” for N bars after it pulses (helps catch late triggers).
Long/Short Lookback (bars): How many bars to remember that pulse.
01b) QBands + Moneyball (Gate -> Trigger)
Allow same-bar Gate->Trigger: If ON, a trigger can fire on the same bar as the gate pulse.
Trigger must fire within N bars after Gate: Size of the gate window (in bars).
Max signals per window (0 = unlimited): Cap the number of entries allowed while a gate window is open.
Buy/Sell Source 1 – Gate: Gate pulse sources that open the buy/sell window (often a regime/zone, e.g., QBands bull/bear).
Trigger Pulse Mode (Buy/Sell): How to detect a trigger pulse from the trigger sources (Change / Appear / Rise>0 / Fall<0).
Trigger A/B sources + Extend Bars: Primary/secondary triggers plus optional extension to persist their pulse for N bars.
Trigger Mode: Pick S2 only, S3 only, S2 OR S3, or S2 AND S3. AND mode remembers both pulses inside the window before firing.
02) Exit Units (Trailing/TP)
Exit Units: Choose Bricks (Renko) or Ticks. All distances below switch accordingly.
03) Tick-based Trailing / Stops (active when Exit Units = Ticks)
Initial SL (ticks): Starting stop distance from entry.
Start Trailing After (ticks): Start trailing once price moves this far in your favor.
Trailing Distance (ticks): Offset of the trailing stop from peak/trough once trailing begins.
Take Profit (ticks): Optional static TP distance.
Stop Loss (ticks): Optional static SL distance (overrides trailing if enabled).
04) Brick-based Trailing / Stops (active when Exit Units = Bricks)
Renko Brick Size: Must match your chart’s brick size.
Initial SL / Start Trailing After / Trailing Distance (bricks): Same definitions as tick mode, measured in bricks.
Take Profit / Stop Loss (bricks): Optional static distances.
05) TP / SL Switch
Enable Static Take Profit: If ON, closes the trade at the fixed TP distance.
Enable Static Stop Loss (Overrides Trailing): If ON, trailing is disabled and a fixed SL is used.
06) Trading Windows (NY time)
Use Trading Windows: Master toggle for all windows.
Evening / Overnight / NY Session: Define each session in NY time.
Flatten at End of : Auto-close any open position when a window ends (sends the Session Exit payload).
07) Day Controls & Limits
Enable Profit Limits / Profit Limit (Dollars): When daily net PnL ≥ limit → auto-flatten and HALT.
Enable Loss Limits / Loss Limit (Dollars): When daily net PnL ≤ −limit → auto-flatten and HALT.
Enable Trade Count Limits / Number of Trades Allowed: After N entries, HALT new entries (does not auto-flatten).
On-chart HUD: A label and soft background tint appear when HALTED; a compact status table shows Day PnL, trade count, and mode.
08) Custom Alert Payloads (used as strategy.order.alert_message)
Long/Short Entry: Payload sent on entries (if blank, a default open JSON is sent).
Regular Long/Short Exit: Payload sent on closes from SL/TP/flip (if blank, a default close JSON is sent).
End of Session Window Exit: Payload sent when any enabled window ends and positions are flattened.
Profit/Loss/Trade Limit Close: Payload sent when daily profit/loss limit causes auto-flatten.
Tip: Any tokens you include here are forwarded “as is”. If your downstream expects variables, do the substitution on the receiver side.
Known limitations
No bracket orders from Pine: This strategy doesn’t create OCO/attached brackets on the broker; it simulates exits with strategy logic and forwards your payloads for external automation.
alert_message is per order only: Alerts fire on order events. General status pings aren’t sent unless you wire a separate indicator/alert.
Renko specifics: Backtests on synthetic Renko can differ from live execution. Always forward-test on your instrument and settings.
Quick checklist before you publish
✅ Brick size in Inputs matches your Renko chart
✅ Exit Units set to Bricks or Ticks as you intend
✅ Day limits/Windows toggled as you want
✅ Custom payloads filled (or leave blank to use defaults)
✅ Your alert uses Order fills only + {{strategy.order.alert_message}}

ORB Strategy W/ Confluence This is an Opening Range Breakout (ORB) strategy designed for intraday trading on futures or indices (e.g., MNQ, MES, ES). It identifies the opening range (default 30-minute session from 9:30-10:00 ET) and enters long on a bullish breakout above the range high (ORH) or short below the range low (ORL), with optional daily bias filtering. Targets are set as multiples of the range width (default 50% per level), with partial profit-taking at each hit level. Stop-loss is dynamically set based on a factor of the range width (default 1.0x full range). Optional confluence filters (RSI >70 for long/<30 for short, price above/below 200 EMA, Williams Vix Fix above/below 0.3, or following previous day's close color) can be enabled for entry confirmation. Position sizing is fixed (default 10 contracts), with an option to double after a losing day. Entries are restricted to a user-defined session (default 8:00-17:00), and all positions close at a specified time (default 16:00 ET) to comply with prop firm rules.
Key Parameters to Test:
Instrument/Timeframe: Test on 5-min or 1-min charts for MNQ/MES/ES futures (e.g., tick value 0.5 for MNQ, 1.25 for MES).
Core Settings: OR timeframe=30m, Target %=50, SL Factor=1.0, TP % Remaining=20 (for partial closes). Enable/disable bias ("Daily Bias" for conservative entries).
Filters: Start with all off; test enabling RSI (len=14, level=50, offset=20), EMA (len=200), WVF (period=22, thresh=0.3), and Prev Day Trend individually/combined to see impact on win rate/false signals.
Risk/Sizing: Fixed contracts=10; test double sizing after loss. For risk-based sizing, adjust to use equity risk % (e.g., 1%) and tick value.
Time Rules: Entry session=0800-1700, Exit=16:00; test on NY session data.
Expected Behavior & Test Focus:
Entry Logic: Long signal on close crossover ORH (or ORH + target1 if bearish bias); short on crossunder ORL. Expect 1-2 trades per day, filtered by confluence to reduce whipsaws.
Exits: SL at ORL - factor*range for long (vice versa for short); partial TP at each target level (e.g., 20% of position at T1, reducing thereafter). Full close at 4 PM if open.
Backtest Metrics: Aim for >50% win rate, positive expectancy over 1-2 years (e.g., 2023-2025 NY session data). Monitor drawdown (<10%), profit factor (>1.5), and Sharpe ratio. Test sensitivity to volatility (e.g., high-vol days may hit more targets but risk larger SL). Visuals: OR box, dashed targets/SL lines, signals (▲/▼).
Edge Cases: Test on low-vol days (tight range, fewer breakouts); gaps; after news events. Ensure no over-entries (pyramiding=0) and daily reset works.
This setup emphasizes disciplined intraday breakouts with risk control—backtest on historical data to validate profitability before live use.

Liquidity Sweep Breakout - LSBLiquidity Sweep Breakout - LSB
A professional session-based breakout system designed for OANDA:USDJPY and other JPY pairs.
Not guesswork, but precision - built on detailed observation of institutional moves to capture clear trade direction daily.
Master the Market’s Daily Bank Flow.
---
Strategy Detail:
I discovered this strategy after carefully studying how Japanese banks influence the forex market during their daily settlement period. Banks are some of the biggest players in the financial world, and when they adjust or settle their accounts in the morning, it often creates a push in the market. From years of observation, I noticed a consistent pattern, once banks finish their settlements, the market usually continues moving in the same direction that was formed right after those actions. This daily banking flow often sets the tone for the entire trading session, especially for JPY pairs like USDJPY.
To capture this move, I built the indicator so that it follows the bank-driven trend with clear rules for entries, stop-loss (SL), and take-profit (TP). The system is designed with professional risk management in mind. By default, it assumes a $10,000 account size, risks only 1% of that balance per trade, and targets a 1:1.5 reward-to-risk ratio. This means for every $100 risked, the potential profit is $150. Such controlled risk makes the system safer and more sustainable for long-term traders. At the same time, users are not limited to this setup, they can adjust the account balance in the settings, and the indicator will automatically recalculate the lot size and risk levels based on their own capital. This ensures the strategy works for small accounts and larger accounts alike.
🌍 Why It Works
Fundamentally driven: Based on **daily Japanese banking settlement flows**.
Session-specific precision: Targets the exact window when USDJPY liquidity reshapes.
Risk-managed: Always calculates lot size based on account and risk preferences.
Automatable: With webhook + MT5 EA, it can be fully hands-free.
---
✅ Recommended
Pair: USDJPY (best observed behavior).
Timeframe: 3-Minute chart.
Platform: TradingView Premium (for webhooks).
Execution: MT5 via EA.
---
🔎 Strategy Concept
The Tokyo Magic Breakout (TMB) is built on years of session observation and the unique daily rhythm of the Japanese banking system.
Every morning between 5:50 AM – 6:10 AM PKT (09:50 – 10:10 JST), Japanese banks perform daily reconciliation and settlement. This often sets the tone for the USDJPY direction of the day.
This strategy isolates that critical moment of liquidity adjustment and waits for a clean breakout confirmation. Instead of chasing noise, it executes only when price action is aligned with the Tokyo market’s hidden flows.
---
🕒 Timing Logic
Session Start: 5:00 AM PKT (Tokyo market open range).
Magic Candle: The 5:54 AM PKT candle is marked as the reference “breakout selector.”
Checkpoints: First confirmation at 6:30 AM PKT, then every 15 minutes until 8:30 AM PKT.
* If price stays inside the magic range → wait.
* If a breakout happens but the candle wick touches the range → wait for the next checkpoint.
* If by 8:30 AM PKT no clean breakout occurs → the day is marked as No Trade Day (NTD).
👉 Recommended timeframe: 3-Minute chart (3M) for precise signals.
---
📈 Trade Execution
Entry: Clean break above/below the magic candle’s range.
Stop-Loss: Opposite side of the Tokyo session high/low.
Take-Profit: Calculated by Reward\:Risk ratio (default 1.5:1).
Lot Size: Auto-calculated based on your risk model:
* Fixed Dollar
* % of Equity
* Conservative (minimum of both).
Visuals include:
✅ Entry/SL/TP lines
✅ Shaded risk (red) and reward (green) zones
✅ Trade labels (Buy/Sell with lot size & levels)
✅ TP/SL hit markers
---
🔔 Alerts & Automation (AutoTMB)
This strategy is fully automation-ready with EA + MT5:
1. Enable alerts in TMB settings.
2. Insert your PineConnector License Key.
3. Configure your risk management preferences.
4. Create a TradingView alert → in the message box simply type:
Pine Script®
{{alert_message}}
and set the EA webhook.
Now, every breakout trade (with exact entry, SL, TP, and lot size) is sent instantly.
👉 On your MT5:
* Install the EA.
* Use the same license key.
* Run it on a VPS or local MT5 terminal.
You now have a hands-free trading system: AutoTMB.

ETH/BTC/XRP Strategy - Powered by BCHETH/BTC/XRP Strategy — Cross-Asset Momentum-Based Strategy
Overview
This strategy aims to identify medium-term long trade opportunities on ETH/BTC/XRP 2 or 4 hour charts by leveraging cross-asset momentum signals from Bitcoin Cash (BCH) relative to Ethereum (ETH). It integrates volatility filters, volume validation, and momentum confirmations to improve trade timing and risk management.
Key Features and Logic
Cross-Asset Momentum Filter: Enters long trades when BCH outperforms ETH in the prior candle, supporting relative strength confirmation.
Volume Confirmation: BCH volume must exceed 135% of its 20-period average, validating market interest before entry signals.
Volatility Filter: ETH price near or below 110% of the lower Bollinger Band (20 periods, 2σ) indicates oversold conditions.
Momentum Indicators: ETH RSI below 70 ensures the asset is not overbought, coupled with BCH MACD line crossing above its signal line for bullish bias.
Risk Controls: Includes trailing stop losses and take profit targets to protect gains and limit drawdowns.
Timing Constraints: Controlled cooldown periods between trades help prevent overtrading and false signals.
Usage Recommendations
Optimized for 2 or 4hour ETH/BTC/XRP USDT candles; 5-minute data optionally used for finer entries and exits.
Suitable for traders seeking dynamic timing based on multi-asset interactions rather than blind holding.
Works as a complement within diversified or rotational strategies focusing on Ethereum exposure.
Performance Summary (Backtest Jan 2023 – Jul 2025) ; ETHUSDT 2hour basis.
Total trades: 65
Win rate: 61.5%
Profit factor: 5.1
Note: The sample size is limited; results should be interpreted with caution. Past performance is not indicative of future results.
Important Notes
This script represents an original combination of cross-asset momentum with volatility and volume filters tailored to ETH and BCH interaction.
Source code is protected to safeguard unique implementation details while allowing free usage without restrictions.
Use appropriate risk management, and consider these signals as part of a broader trading analysis.
No guarantees on profitability; trading involves significant risk.

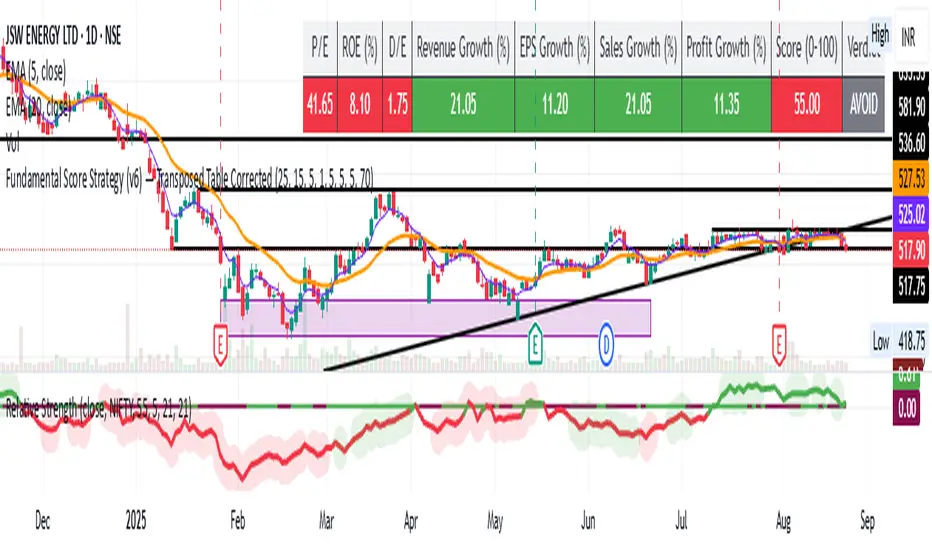
Fundamental Strategy - anuragmundraFundamental Score Based Backtest
This strategy combines fundamental analysis with automated backtesting to help identify long-term investment opportunities. Instead of relying only on price action or technical indicators, it evaluates the financial health of a company and generates simulated BUY/SELL signals accordingly.
🔑 Key Parameters Considered:
Price-to-Earnings (P/E Ratio): Ensures the stock is not overpriced.
Return on Equity (ROE): Indicates efficiency of management and business profitability.
Debt-to-Equity Ratio (D/E): Evaluates leverage and financial risk.
Revenue Growth (YoY): Shows business expansion and demand.
EPS Growth: Reflects consistent profit generation for shareholders.
Sales Growth: Confirms topline improvement.
Profit Growth: Measures bottom-line strength.
✅ Buy Condition
When the fundamental score ≥ 70/100, the strategy enters a long position.
Score is based on meeting/exceeding thresholds for P/E, ROE, Revenue Growth, EPS Growth, Sales Growth, Profit Growth, and Debt-to-Equity.
❌ Sell/Exit Condition
When the score falls below 70, the position is closed.
⚡ How to Use
Designed for medium to long-term investors who prefer fundamentally strong companies.
Can be run in the Strategy Tester to evaluate the historical performance of any stock.
Suitable as a stock-picking filter rather than a short-term trading system.
📊 Notes
Some ratios (like ROE) are based on annual values (FY), while others (EPS, Revenue, Net Income) use TTM for recency.
Not all symbols/exchanges provide full fundamental data. If data is missing, some metrics may show as N/A.
⚠️ Disclaimer: This is an educational tool for research and backtesting only. It is not financial advice. Always combine with your own due diligence before making investment decisions.
BDNS ORB Strategy v3BDNS Opening Range Breakout Strategy
What This Strategy Does This strategy implements an Opening Range Breakout (ORB) system that identifies the high and low prices during a customizable opening period, then trades breakouts above or below these levels with momentum confirmation. The strategy goes beyond basic ORB concepts by incorporating ADX momentum filtering, VWAP directional bias, dynamic position sizing, and sophisticated exit management including breakeven moves and trailing stops.
Core Strategy Logic
Opening Range Definition: The strategy tracks price action during a user-defined opening period (default: 9:30-9:35 AM ET for 5 minutes). During this time, blue horizontal lines appear marking the session high and low. A yellow background highlights this opening range period.
Breakout Detection: After the opening range completes, green and red horizontal lines appear showing the actual entry levels - these are offset from the range boundaries by a configurable number of ticks (default: 24 ticks) to filter out false breakouts and ensure committed moves.
Entry Conditions: Trades trigger when price breaks through these offset levels during the trading window (green background, default until 10:30 AM ET), but only when:
ADX momentum indicator exceeds threshold (default 24.0) in the breakout direction
Price relationship to VWAP confirms directional bias (when VWAP filter enabled)
Daily trade limits haven't been reached
Large range filtering conditions are met
Visual Elements and Usage
Range Lines: Blue lines show the actual opening range boundaries. These appear immediately when the opening session begins.
Entry Levels: Green (long) and red (short) lines show where trades will trigger, appearing after the opening range completes.
Information Table: A data table appears in the top-right showing real-time strategy status including range size in ticks, ADX readings, filter status, trade counts, and momentum conditions.
Position Management:
When in a trade, colored circles appear showing:
Lime circles: Long position targets (T1, T2, T3)
Orange circles: Short position targets
Red circles: Stop loss levels
Blue crosses: Breakeven levels (when that feature activates)
Purple lines: Trailing stop levels (when position 3 trailing activates)
Background Colors:
Yellow: Opening range session active
Green: Trading window active
Purple: Large range day detected
Gray: Large range day being skipped
Position Management System
The strategy uses a three-tier exit approach:
Position 1: Takes partial profits at first target (default 50% of range size)
Position 2: Exits at second target (default 100% of range size)
Position 3: Either exits at third target or uses trailing stop after Position 2 wins
Breakeven Feature: When enabled and price reaches the breakeven trigger level, all stop losses move to a more favorable breakeven level instead of the original stop, protecting against giving back profits.
Trailing Stop System: After Position 2 hits its target, Position 3 automatically switches to a trailing stop that moves in the trader's favor as price continues trending.
Customization for Different Instruments
The default settings are configured for MNQ (Micro NASDAQ futures) but the ORB concept is highly customizable for any futures instrument and timeframe. Range duration, breakout offsets, and filter thresholds should be adjusted based on the specific instrument's volatility characteristics and typical intraday patterns.
Filter Usage Guidelines
ADX Momentum Filter: Essential for avoiding breakouts during consolidation. Higher thresholds (30+) for trending markets, lower (20-25) for more opportunities.
VWAP Filter: Helpful in trending conditions but may reduce trade frequency. Better to disable during range-bound or mean-reverting periods.
Large Range Filter: Critical risk management tool. When the opening range exceeds your threshold:
Skip: Avoids trades when stops would be too large
Fade: Trades mean reversion back into the range
Trade: Takes breakouts regardless (higher risk)
Range Size Considerations: Setting a large range threshold (200-400 ticks) helps avoid days when both sides of the range get tested before any meaningful breakout occurs, which often leads to whipsaws.
Risk Management Features
Dynamic Stops and Targets: All exit levels scale with the opening range size, ensuring risk/reward remains consistent regardless of daily volatility. A 100-tick range day will have proportionally smaller stops than a 300-tick range day.
Position Sizing: Configure contract amounts for each position tier based on account size and risk tolerance.
Daily Trade Limits: Prevents overtrading by limiting trades per direction per day.
Breakout Offset: The tick offset from range boundaries is crucial - too small creates false signals, too large misses good moves. Test different values based on your instrument's typical noise levels.
Advanced Features
Large Third Target: Set Target 3 to 300-500% to essentially hold runners indefinitely, using the trailing stop as the primary exit method for capturing extended trends.
Fade Trading: On large range days, the strategy can trade mean reversion when initial breakouts fail, often providing good counter-trend opportunities.
Time-Based Exits: All positions close at the end of the trading window, preventing overnight risk.
Strategy Properties Used
Initial Capital: $5,000 (realistic for micro contract trading)
Commission: $0.50 per contract (realistic retail rates)
Position Size: 100% of equity (manages risk through contract quantities and stop placement)
Default quantities: 3/1/1 contracts across the three positions
The default settings assume larger account sizes or proprietary trading firm accounts where higher risk tolerance is acceptable. With MNQ at $0.50 per tick, a typical 200-tick opening range with 75% stop loss (150 ticks) would risk $375 on a 5-contract position. For smaller retail accounts, consider reducing position sizes significantly - using only Position 1 (3 contracts) would risk $225, or even reducing to 1-2 total contracts to maintain appropriate risk levels relative to account size.
Getting Started Apply the strategy to your preferred instrument
Adjust the opening range time and duration for your market
Set appropriate breakout offset based on typical noise levels
Configure large range threshold based on your risk tolerance
Test filter combinations to find what works best for your trading style
Adjust contract quantities based on your account size and risk management rules
The strategy works best on liquid instruments with clear opening sessions and sufficient volatility to generate meaningful ranges. Results will vary significantly based on market conditions, parameter settings, and the specific instrument traded.
I warrant that the information created and published by by me here on TradingView is not prohibited, doesn't constitute investment advice, and isn't created solely for qualified investors.

The Barking Rat LiteMomentum & FVG Reversion Strategy
The Barking Rat Lite is a disciplined, short-term mean-reversion strategy that combines RSI momentum filtering, EMA bands, and Fair Value Gap (FVG) detection to identify short-term reversal points. Designed for practical use on volatile markets, it focuses on precise entries and ATR-based take profit management to balance opportunity and risk.
Core Concept
This strategy seeks potential reversals when short-term price action shows exhaustion outside an EMA band, confirmed by momentum and FVG signals:
EMA Bands:
Parameters used: A 20-period EMA (fast) and 100-period EMA (slow).
Why chosen:
- The 20 EMA is sensitive to short-term moves and reflects immediate momentum.
- The 100 EMA provides a slower, structural anchor.
When price trades outside both bands, it often signals overextension relative to both short-term and medium-term trends.
Application in strategy:
- Long entries are only considered when price dips below both EMAs, identifying potential undervaluation.
- Short entries are only considered when price rises above both EMAs, identifying potential overvaluation.
This dual-band filter avoids counter-trend signals that would occur if only a single EMA was used, making entries more selective..
Fair Value Gap Detection (FVG):
Parameters used: The script checks for dislocations using a 12-bar lookback (i.e. comparing current highs/lows with values 12 candles back).
Why chosen:
- A 12-bar displacement highlights significant inefficiencies in price structure while filtering out micro-gaps that appear every few bars in high-volatility markets.
- By aligning FVG signals with candle direction (bullish = close > open, bearish = close < open), the strategy avoids random gaps and instead targets ones that suggest exhaustion.
Application in strategy:
- Bullish FVGs form when earlier lows sit above current highs, hinting at downward over-extension.
- Bearish FVGs form when earlier highs sit below current lows, hinting at upward over-extension.
This gives the strategy a structural filter beyond simple oscillators, ensuring signals have price-dislocation context.
RSI Momentum Filter:
Parameters used: 14-period RSI with thresholds of 80 (overbought) and 20 (oversold).
Why chosen:
- RSI(14) is a widely recognized momentum measure that balances responsiveness with stability.
- The thresholds are intentionally extreme (80/20 vs. the more common 70/30), so the strategy only engages at genuine exhaustion points rather than frequent minor corrections.
Application in strategy:
- Longs trigger when RSI < 20, suggesting oversold exhaustion.
- Shorts trigger when RSI > 80, suggesting overbought exhaustion.
This ensures entries are not just technically valid but also backed by momentum extremes, raising conviction.
ATR-Based Take Profit:
Parameters used: 14-period ATR, with a default multiplier of 4.
Why chosen:
- ATR(14) reflects the prevailing volatility environment without reacting too much to outliers.
- A multiplier of 4 is a pragmatic compromise: wide enough to let trades breathe in volatile conditions, but tight enough to enforce disciplined exits before mean reversion fades.
Application in strategy:
- At entry, a fixed target is set = Entry Price ± (ATR × 4).
- This target scales automatically with volatility: narrower in calm periods, wider in explosive markets.
By avoiding discretionary exits, the system maintains rule-based discipline.
Visual Signals on Chart
Blue “▲” below candle: Potential long entry
Orange/Yellow “▼” above candle: Potential short entry
Green “✔️”: Trade closed at ATR take profit
Blue (20 EMA) & Orange (100 EMA) lines: Dynamic channel reference
⚙️Strategy report properties
Position size: 25% equity per trade
Initial capital: 10,000.00 USDT
Pyramiding: 10 entries per direction
Slippage: 2 ticks
Commission: 0.055% per side
Backtest timeframe: 1-minute
Backtest instrument: HYPEUSDT
Backtesting range: Jul 28, 2025 — Aug 17, 2025
Note on Sample Size:
You’ll notice the report displays fewer than the ideal 100 trades in the strategy report above. This is intentional. The goal of the script is to isolate high-quality, short-term reversal opportunities while filtering out low-conviction setups. This means that the Barking Rat Lite strategy is very selective, filtering out over 90% of market noise. The brief timeframe shown in the strategy report here illustrates its filtering logic over a short window — not its full capabilities. As a result, even on lower timeframes like the 1-minute chart, signals are deliberately sparse — each one must pass all criteria before triggering.
For a larger dataset:
Once the strategy is applied to your chart, users are encouraged to expand the lookback range or apply the strategy to other volatile pairs to view a full sample.
💡Why 25% Equity Per Trade?
While it's always best to size positions based on personal risk tolerance, we defaulted to 25% equity per trade in the backtesting data — and here’s why:
Backtests using this sizing show manageable drawdowns even under volatile periods.
The strategy generates a sizeable number of trades, reducing reliance on a single outcome.
Combined with conservative filters, the 25% setting offers a balance between aggression and control.
Users are strongly encouraged to customize this to suit their risk profile.
What makes Barking Rat Lite valuable
Combines multiple layers of confirmation: EMA bands + FVG + RSI
Adaptive to volatility: ATR-based exits scale with market conditions
Clear, actionable visuals: Easy to monitor and manage trades

TrendPilot AI v2 — Adaptive Trend Day Trading StrategyOverview
TrendPilot AI v2 is a structured, rules-based day trading strategy that identifies and follows market momentum using a sophisticated blend of technical indicators. Optimized for 15-minute and higher timeframes on high market cap cryptocurrencies (AAVE, SOL, ETH, BCH, BTC) to minimize manipulation risks, it adapts to changing market conditions with dynamic risk management and controlled re-entry logic to maximize trend participation while minimizing noise.
Core Logic
Multiple EMA Trend Confirmation — Uses three Exponential Moving Averages (fast, medium, slow) to detect robust bullish, bearish, or neutral trends, ensuring trades align with the prevailing market direction.
ADX Momentum Filter — Employs an ADX-based filter to confirm strong trends, avoiding entries in choppy or low-momentum markets.
Smart Entry Filter — Optional ATR-based buffer (period 14, multiplier 1.5) around the fast EMA prevents entries at overextended prices, enhancing trade precision.
Flexible Exit System — Offers multiple exit options: fixed take-profit (default 1.7 offset), trend-reversal exits, or ATR-based trailing stops (period 14, multiplier 2.0), with secure modes requiring candle closes for confirmation to gain Max Profit.
Controlled Re-Entry Logic — Allows re-entries after take-profit or price-based stop-loss with configurable wait periods (default 6 bars), max attempts (default 2), and EMA touch requirements (fast, medium, or slow).
State-Aware Risk Management — Tracks trend states and recent exits to adapt entries, with daily trade limits (default 5 long/short) and loss cooldowns (default 2 stop-losses) for disciplined trading.
How to Use & Configuration
Markets & Timeframes
Works with high market cap cryptocurrencies (AAVE, SOL, ETH, BCH, BTC).
Optimized for intraday charts (15m–4h) but adaptable to higher timeframes (e.g., 1h, 4h).
Trade Direction Settings
Dual Trades — Trades both long and short, quickly re-aligning after trend reversals.
Long Only — Ignores bearish signals, ideal for bullish markets or strong uptrends.
Short Only — Ignores bullish signals, suited for bearish markets or downtrends.
Risk Management Settings
Stop Loss Types
Trend Reversal — Closes positions when an opposite trend signal is confirmed (default).
Fixed Offset — Static stop at 3.5 offset from entry price (adjustable).
ATR Based — Dynamic trailing stop using ATR (period 14, multiplier 2.0), adjusting to market volatility.
Secure SL Mode — Optional setting to trigger price-based stops only on candle closes, reducing false exits.
Maximum recommended risk per trade is 5–10% of account equity.
Trade size is configurable (default 20 units) to match individual risk appetite.
Take Profit Options
Fixed Offset — Predefined target at 1.7 offset from entry (adjustable, e.g., 2.5 for SOL).
Secure TP Mode — Exits only when a candle closes beyond the target, ensuring reliable profit capture.
Trend Reversal — Exits on opposite trend signals when fixed TP is disabled, ideal for riding longer trends.
Trade Management Controls
Smart Entry Filter — Optional ATR-based buffer (period 14, multiplier 1.5) prevents chasing overextended prices.
Max Re-Entries — Limits continuation trades per trend cycle (default 2).
Daily Trade Limits — Caps long/short trades per day (default 5 each) for disciplined trading.
Daily Loss Cooldown — Pauses trading after a set number of stop-losses (default 2) per day.
Max Bars in Trade — Closes positions after a set duration (default 1440 bars) to prevent stale trades.
Configuration Steps
Apply the strategy to your chosen symbol (e.g., AAVE/USDT, SOL/USDT) and timeframe (15m or higher).
Select Trade Direction mode (Dual, Long Only, or Short Only).
Set Stop Loss (Trend Reversal, Fixed Offset, or ATR Based) and Take Profit (fixed or trend-reversal).
Adjust Smart Entry Filter, Max Re-Entries, Daily Limits, and Loss Cooldown as needed.
Test across multiple market conditions using the performance panel (top-right, showing Total Trades, Wins, Losses, Win Rate).
Enables automated trading via webhook integration with platforms like Binance Futures.
Set up alerts for long/short entries (🟢 Long, 🔴 Short) and exits (🎯 Max TP, 🛑 Max SL, 🚨 Force Exit).
Backtesting Guidance
Use realistic commission (default 0.01%) and slippage (default 2 ticks) matching your broker and instrument.
Validate performance over long historical periods (e.g., 3–6 months) to ensure >100 trades across different market regimes.
Avoid curve-fitting by testing on multiple high market cap coins (AAVE, SOL, ETH, BCH, BTC) and avoiding over-optimization.
EMA and ATR parameters are set to balanced, industry-standard values for realistic backtesting.
Best Practices, Defaults & Disclaimer
Best Practices
Use consistent and conservative position sizing (default 20 units).
Match commission and slippage to your broker’s actual rates.
Enable secure TP/SL modes for entries and exits to reduce false signals.
Test across different symbols, timeframes, and market phases before live trading.
Keep parameters simple to avoid overfitting.
Default Settings (Recommended Starting Point)
Initial Capital: $10,000
Order Size: Fixed, 20 units
Commission: 0.01%
Slippage: 2 ticks
Take Profit Offset: 1.7 (adjustable, e.g., 2.5 for SOL)
Stop Loss Type: Trend Reversal (default), Fixed Offset (3.5), or ATR Based (period 14, multiplier 2.0)
Smart Entry Filter: ATR period 14, multiplier 1.5 (optional)
Max Re-Entries: 2 per trend cycle
Daily Trade Limits: 5 long, 5 short
Daily Loss Cooldown: 2 stop-losses
Max Bars in Trade: 1440 bars
Subscription Information
TrendPilot AI v2 is an invite-only strategy, accessible only to approved subscribers.
Benefits include full access to all features, priority support, and regular updates.
Access is limited to ensure a high-quality user experience.
Compliance Status
No functional warnings in the script.
The script uses closed candle logic, ensuring no repainting or lookahead issues.
Designed for realistic backtesting with a $10,000 account and sustainable risk (≤5–10% per trade).
Disclaimer
This strategy is intended for educational and analytical purposes only. Trading involves substantial risk, and past performance does not guarantee future results. You are solely responsible for your own trading decisions and risk management.
Developed by: TrendPilotAI Team
For questions, setup guidance, or enhancement suggestions, contact TrendPilotAI Team via TradingView.

Engulfing & Pin Bar Breakout StrategyOverview
This strategy automates a classic, powerful trading methodology based on identifying key candlestick reversal patterns and trading the subsequent price breakout. It is designed to be a complete, "set-and-go" system with built-in risk and position size management.
The core logic operates on the 1-Hour timeframe, scanning for four distinct high-probability reversal signals: two bullish and two bearish. An entry is only triggered when the market confirms the signal by breaking a key price level, aiming to capture momentum following a potential shift in market sentiment.
The Strategy Logic
The system is composed of two distinct modules: Bullish (Long) and Bearish (Short).
🐂 Bullish (Long) Setup
The script initiates a long trade based on the following strict criteria:
Signal: Identifies either a Hammer or a Bullish Engulfing pattern. These patterns often indicate that sellers are losing control and buyers are stepping in.
Confirmation: Waits for the very next candle after the signal.
Entry Trigger: A long position is automatically opened as soon as the price breaks above the high of the signal candle.
Stop Loss: Immediately set just below the low of the signal candle.
Take Profit: A fixed target is placed at a 1:5 Risk/Reward Ratio.
🐻 Bearish (Short) Setup
The script initiates a short trade based on the following strict criteria:
Signal: Identifies either a Shooting Star or a Bearish Engulfing pattern. These patterns suggest buying pressure is fading and sellers are taking over.
Confirmation: Waits for the very next candle after the signal.
Entry Trigger: A short position is automatically opened as soon as the price breaks below the low of the signal candle.
Stop Loss: Immediately set just above the high of the signal candle.
Take Profit: A fixed target is placed at a 1:4 Risk/Reward Ratio.
Key Feature: Automated Risk Management
This strategy is designed for disciplined trading. You do not need to calculate position sizes manually.
Fixed Risk: The script automatically calculates the correct position size to risk exactly 2% of your total account equity on every single trade.
Dynamic Sizing: The position size will adjust based on the distance between your entry price and your stop loss for each specific setup, ensuring a consistent risk profile.
How To Use
Apply the script to your chosen chart (e.g., BTC/USD).
Crucially, set your chart's timeframe to 1-Hour (H1). The strategy is specifically calibrated for this interval.
Navigate to the "Strategy Tester" tab below your chart to view backtest results, including net profit, win rate, and individual trades.
Disclaimer: This script is provided for educational and informational purposes only. It is not financial advice. All trading involves substantial risk, and past performance is not indicative of future results. Please use this tool responsibly and at your own risk.

Options Strategy V2.0📈 Options Strategy V2.0 – Intraday Reversal-Resilient Momentum System
Overview:
This strategy is designed specifically for intraday SPY, TSLA, MSFT, etc. options trading (0DTE or 1DTE), using high-probability signals derived from a confluence of technical indicators: EMA crossovers, RSI thresholds, ATR-based risk control, and volume spikes. The strategy aims to capture strong directional moves while avoiding overtrading, thanks to a built-in cooldown logic and optional time/session filters.
⚙️ Core Concept
The strategy executes trades only in the direction of the prevailing trend, determined by short- and long-term Exponential Moving Averages (EMA). Entry signals are generated when the Relative Strength Index (RSI) confirms momentum in the direction of the trend, and volume spikes suggest institutional activity.
To increase adaptability and user control, it includes a highly customizable parameter set for both long and short entries independently.
📌 Key Features
✅ Trend-Following Logic
Long entries are only allowed when EMA(short) > EMA(long)
Short entries are only allowed when EMA(short) < EMA(long)
✅ RSI Confirmation
Long: Requires RSI crossover above a configurable threshold
Short: Requires RSI crossunder below a configurable threshold
Optional rejection filters: Entry blocked above/below specific RSI extremes
✅ Volume Spike Filter
Confirms institutional participation by comparing current volume to an average multiplied by a user-defined factor.
✅ ATR-Based Risk Management
Both Stop Loss (SL) and Take Profit (TP) are dynamically calculated using ATR × a multiplier.
TP/SL ratio is fully configurable.
✅ Cooldown Control
After every trade, the system waits for a set number of bars before allowing new entries.
This prevents overtrading and increases signal quality.
Optionally, cooldown is ignored for reversal trades, ensuring the system can react immediately to a confirmed trend change.
✅ Candle Body Filter (Noise Control)
Avoids trades on candles with too small bodies relative to wicks (often noise or indecision candles).
✅ VWAP Confirmation (Optional)
Ensures price is trading above VWAP for long entries, or below for short entries.
✅ Time & Session Filters
Trades only during regular market hours (09:30–16:00 EST).
No-trade zone (e.g., 14:15–15:45 EST) to avoid low-liquidity traps or late-day whipsaws.
✅ End-of-Day Auto Close
All open positions are force-closed at 15:55 EST, protecting against overnight risk (especially relevant for 0DTE options).
📊 Visual Aids
EMA plots show trend direction
VWAP line provides real-time mean-reversion context
Stop Loss and Take Profit lines appear dynamically with each trade
Alerts notify of entry signals and exit triggers
🔧 Customization Panel
Nearly every element of the strategy can be tailored:
EMA lengths (short and long, for both sides)
RSI thresholds and length
ATR length, SL multiplier, and TP/SL ratio
Volume spike sensitivity
Minimum EMA distance filter
Candle body ratio filter
Session restrictions
Cooldown logic (duration + reversal exception)
This makes the strategy extremely versatile, allowing both conservative and aggressive configurations depending on the trader’s profile and the market context.
📌 Example Use Case: SPY Options (0DTE or 1DTE)
This system was designed and tested specifically for SPY and other intraday options trading, where:
Delta is around 0.50 or higher
Trades are short-lived (often 1–5 candles)
You aim to trade 1–3 signals per day, filtering out weak entries
🚫 Important Notes
It is not a scalping strategy; it relies on confirmed breakouts with trend support
No pyramiding or re-entries without cooldown to preserve risk integrity
Should be used with real-time alerts and manual broker execution
📈 Alerts Included
📈 Long Entry Signal
📉 Short Entry Signal
⚠️ Auto-closed all positions at 15:55 EST
✅ Proven Settings – Real Trades + Backtest Results
The current version of the strategy includes the optimal settings I’ve arrived at through extensive backtesting, as well as 3 months of real trading with consistent profitability. These results reflect real-world execution under live market conditions using 0DTE SPY options, with disciplined trade management and risk control.
🧠 Final Thoughts
Options Strategy V2.0 is a robust, highly tunable intraday strategy that blends momentum, trend-following, and volume confirmation. It is ideal for disciplined traders focused on SPY or other 0DTE/1DTE options, and it includes guardrails to reduce false signals and improve execution timing.
Perfect for those who seek precision, flexibility, and risk-defined setups—not blind automation.

Parallax Momentum MNQ Strategy# 📈 Parallax Momentum MNQ Strategy
## Overview
The Parallax Momentum MNQ Strategy is a sophisticated support/resistance breakout system specifically designed for Micro Nasdaq futures (MNQ) trading (also works on minis). This strategy combines dynamic level detection with momentum confirmation to identify high-probability entry opportunities while maintaining strict risk management protocols.
## 🎯 Key Features
### Core Strategy Logic
- **Dynamic Support/Resistance Detection**: Automatically identifies key levels using configurable lookback periods
- **Momentum Confirmation**: Volume-based filtering ensures trades align with market momentum
- **ATR-Based Risk Management**: Adaptive stop losses and take profits based on market volatility
- **Dual Entry System**: Both long and short opportunities with limit order execution
### Risk Management
- **ATR-Adaptive Stops**: Stop losses and take profits automatically adjust to market volatility
- **Reward-to-Risk Ratios**: Configurable R:R ratios with default 2:1 minimum
- **Maximum Loss Protection**: Optional daily loss limits to prevent overtrading
- **Session Time Filtering**: Trade only during specified market hours
### Strategy Modes
- **Conservative Mode**: 0.8x risk multiplier for cautious trading
- **Balanced Mode**: Standard 1.0x risk multiplier (default)
- **Aggressive Mode**: 1.2x risk multiplier for active trading
## 📊 Visual Features
### Dashboard Display
- Real-time strategy status and performance metrics
- Current support/resistance levels and ATR values
- Live risk-to-reward ratios for potential trades
- Win rate, profit factor, and drawdown statistics
- Adjustable dashboard size and positioning
### Chart Indicators
- Support and resistance lines with labels
- ATR-based levels (+/-1 ATR and +/-2 ATR)
- Dynamic visual updates as levels change
- Configurable line extensions and styling
## ⚙️ Configuration Options
### Entry Filters
- **Volume Filter**: Optional volume confirmation above SMA
- **Session Time Filter**: 12-hour format time restrictions
- **ATR vs Fixed Stops**: Choose between adaptive or fixed tick-based exits
### Risk Controls
- **ATR Period**: Default 14-period ATR calculation
- **Stop Loss Multiplier**: ATR-based stop distance (default 1.5x)
- **Take Profit Multiplier**: ATR-based target distance (default 1.5x)
- **Secondary Take Profit**: Optional TP2 with position scaling
## 📋 How It Works
### Entry Conditions
**Long Trades**: Triggered when price closes above support buffer but low touches support level, with volume and session confirmation
**Short Trades**: Triggered when price closes below resistance buffer but high touches resistance level, with volume and session confirmation
### Exit Strategy
- **Primary Take Profit**: ATR-based target with 2:1 R:R minimum
- **Stop Loss**: ATR-based protective stop
- **Optional TP2**: Extended target for partial profit taking
- **One Trade at a Time**: No overlapping positions
## 🎛️ Default Settings
- **Lookback Period**: 20 bars for support/resistance detection
- **ATR Period**: 14 bars for volatility calculation
- **Stop Loss**: 1.5x ATR from entry
- **Take Profit**: 1.5x ATR with 2:1 reward-to-risk ratio
- **Session**: 7:30 AM - 2:00 PM (configurable)
## ⚠️ Important Notes
### Risk Disclaimer
- This strategy is for educational and informational purposes only
- Past performance does not guarantee future results
- Always use proper position sizing and risk management
- Test thoroughly on historical data before live trading
- Consider market conditions and volatility when using
### Best Practices
- Backtest on sufficient historical data
- Start with conservative mode for new users
- Monitor performance regularly and adjust parameters as needed
- Use appropriate position sizing for your account
- Consider broker commissions and slippage in live trading
## 🔧 Customization
The strategy offers extensive customization options including:
- Adjustable time sessions with AM/PM format
- Configurable ATR and risk parameters
- Optional maximum daily loss limits
- Dashboard size and position controls
- Visual element toggles and styling
## 📈 Ideal For
- MNQ (Micro Nasdaq) futures traders
- Intraday momentum strategies
- Traders seeking systematic entry/exit rules
- Risk-conscious traders wanting automated stops
- Both beginner and experienced algorithmic traders
---
**Version**: Pine Script v5 Compatible
**Timeframe**: Works on multiple timeframes (test on 1m, 3m, 5m, 15m)
**Market**: Optimized for MNQ but adaptable to other instruments
**Strategy Type**: Trend following with momentum confirmation

Modular Range-Trading Strategy (V9.2)# 模块化震荡行情策略 (V9.2)
# Modular Range-Trading Strategy (V9.2)
## 策略简介 | Strategy Overview
该策略基于布林带 (Bollinger Bands)、RSI、MACD、ADX 等经典指标的组合,通过多逻辑模块化结构识别震荡区间的价格反转机会,支持多空双向操作,并在相同逻辑下允许智能加仓,适用于震荡市场的回测和研究。
This strategy combines classic indicators such as Bollinger Bands, RSI, MACD, and ADX to identify price reversal opportunities within ranging markets. It features a modular multi-logic structure, allowing both long and short trades with intelligent pyramiding under the same logic. It is designed for backtesting and research in range-bound conditions.
---
## 功能特点 | Key Features
- **多逻辑结构**:支持多套震荡逻辑(动能确认均值回归、布林带极限反转等)。
- **加仓与仓位互斥**:同逻辑下可智能加仓,不同逻辑间自动互斥,避免冲突。
- **回测可调时间范围**:可自定义回测起止时间,精准评估策略表现。
- **指标可视化**:布林带、RSI、MACD 及动态 ATR 止损线实时绘图。
- **K线收盘确认信号**:通过 `barstate.isconfirmed` 控制信号,避免未收盘的虚假信号。
- **Multi-logic structure**: Supports multiple range-trading logics (e.g., momentum-based mean reversion, Bollinger Band reversals).
- **Pyramiding with mutual exclusion**: Allows intelligent pyramiding within the same logic while preventing conflicts between different logics.
- **Adjustable backtesting range**: Customizable start and end dates for accurate performance evaluation.
- **Visual indicators**: Real-time plotting of Bollinger Bands, RSI, MACD, and dynamic ATR stop lines.
- **Close-bar confirmation**: Uses `barstate.isconfirmed` to avoid false signals before bar close.
---
## 使用说明 | Usage
1. 将该脚本添加到 TradingView 图表。
2. 在参数中设置回测时间段和指标参数。
3. 仅用于学习与策略研究,请勿直接用于实盘交易。
1. Add this script to your TradingView chart.
2. Configure backtesting dates and indicator parameters as needed.
3. For educational and research purposes only. **Not for live trading.**
---
## ⚠️ 免责声明 | Disclaimer
本策略仅供学习和研究使用,不构成任何形式的投资建议。
作者不参与任何实盘交易、资金管理或收益分成,也不保证策略盈利能力。
严禁将本脚本用于任何非法集资、私募募资或与虚拟货币相关的金融违法活动。
使用本策略即表示您自行承担所有风险与法律责任。
This strategy is for educational and research purposes only and does not constitute investment advice.
The author does not participate in live trading, asset management, or profit sharing, nor guarantee profitability.
The use of this script in illegal fundraising, private placements, or cryptocurrency-related financial activities is strictly prohibited.
By using this strategy, you accept all risks and legal responsibilities.
---

ICT OTE StrategyStrategy Overview
This strategy is designed to automate a specific trading setup based on the concepts of Inner Circle Trader (ICT). Its primary goal is to identify significant market structure swings, frame a Fibonacci retracement over the most recent price leg, and execute a trade when the price pulls back to a key user-defined level. It is a counter-trend entry strategy, meaning it looks to enter a trade during a pullback within an established trend.
How It Works: Step-by-Step
1. Swing Detection:
The strategy first identifies significant swing highs and swing lows.
A swing high is confirmed only if it's higher than a specific number of bars to its left and right (defined by "Left Strength" and "Right Strength" in the settings).
The same logic applies to swing lows, which must be lower than the bars around them. This filtering ensures only structurally important turning points are considered.
2. Defining the Trading Range:
Once a new swing is confirmed, the strategy defines the most recent dealing range.
If a new swing high forms, the range is drawn from the previous swing low up to this new high. This is considered a bullish leg.
If a new swing low forms, the range is drawn from the previous swing high down to this new low. This is considered a bearish leg.
3. Fibonacci Retracement & Trade Setup:
An automatic Fibonacci retracement tool is drawn over this newly defined dealing range. The 0.0 level is placed at the end of the move, and the 1.0 level is at the beginning.
The strategy then prepares to enter a trade based on this range.
4. Trade Execution:
Entry: A limit order is placed at a specific Fibonacci level within the range, waiting for the price to retrace. The default entry is the 0.618 level, but this can be changed in the settings.
For a bullish leg, it places a LONG (Buy) order, anticipating that the price will bounce from the retracement level.
For a bearish leg, it places a SHORT (Sell) order, anticipating that the price will be rejected from the retracement level.
Stop Loss: The Stop Loss is automatically placed at the 1.0 level of the Fibonacci range. This is the point where the original trade idea is invalidated.
Take Profit: The Take Profit is automatically placed at the 0.0 level of the Fibonacci range. This is the target at the end of the price leg.
Key Features & Customization
Automated Trade Logic: The entire process, from identifying the setup to placing the entry, stop loss, and take profit, is fully automated.
Visual Aid: The script draws the swing points and the Fibonacci retracement on the chart, so you can visually confirm the setups the strategy is taking.
Customizable Entry: You can change the "Entry Level" in the settings to test different Fibonacci levels, such as the Optimal Trade Entry (OTE) at 0.705.
Toggle Visuals: You can turn the Fibonacci drawing on or off to keep your chart clean while still allowing the strategy to run in the background.

The SamuraiOverview
This strategy implements a session-based range breakout system specifically designed for GBP/JPY trading. The approach focuses on identifying key price ranges during specific market sessions and trading breakouts of these ranges during optimal trading windows. The strategy combines multi-timeframe analysis using 30-minute data with precise session timing to capture high-probability breakout moves.
Entry Logic
The strategy operates on a two-phase approach:
Range Collection Phase:
Monitors price action during a specified session window
Identifies session high and low levels
Only collects ranges on selected trading days
Trading Phase:
Long Entry: Price closes above the established session high
Short Entry: Price closes below the established session low
Entries only occur on valid trading days (day after range collection)
One trade per direction per session to prevent overtrading
Exit Conditions
Stop Loss: Set at a percentage of the session range below entry (long) or above entry (short)
Take Profit: Calculated using a Risk-Reward Ratio based on stop loss distance
Session Close: All positions are closed at the end of the trading window
Risk Management Features
Fixed risk-reward ratio of for consistent risk management
Stop loss calculated as percentage of session range for adaptive sizing
Visual risk/reward boxes display potential outcomes before entry
Daily session close protection prevents overnight exposure
Visual Features
Customizable Colors: Full control over line colors, styles, and box opacities
Risk/Reward Visualization: Color-coded boxes showing potential profit and loss zones
Take Profit Lines: TP level with different line styles for clarity
Stop Loss Line: Clear visual indication of risk level
Clean Interface: Streamlined settings focused on essential visual customization
Important Notes
Timeframe Dependency: Strategy uses 30-minute data regardless of chart timeframe for consistency
Session Timing: All times are in UTC - ensure proper timezone conversion for your location
Trading Days: Default setup trades Tuesday-Friday ranges (Monday-Thursday collection)
Single Position: Only one position per direction per session to maintain discipline
No Pyramiding: Strategy prevents position averaging to maintain clear risk parameters
Suggested Use
Recommended Pairs: Optimized for GBP/JPY but may work on other volatile pairs
Best Timeframes: Display on any timeframe (strategy uses 30m data internally)
Session Awareness: Most effective during high-volatility session transitions
Risk Management: Consider position sizing based on account risk tolerance
Market Conditions: Performs best in trending or breakout market environments
Backtesting Considerations
Strategy includes realistic entry/exit conditions based on closing prices
Visual elements help understand historical performance context
Built-in position management prevents unrealistic results
Session-based logic ensures trades align with actual market sessions
This strategy is designed for traders who prefer systematic, rule-based approaches to breakout trading with clear risk management parameters. The visual feedback helps in understanding market context and decision-making process.
Disclaimer: Past performance does not guarantee future results. Always test thoroughly on historical data and consider your risk tolerance before live trading.
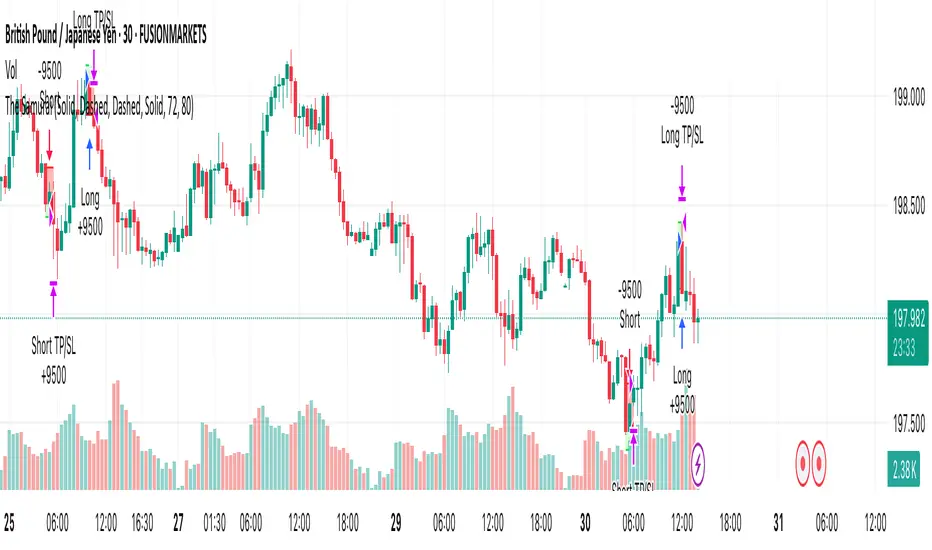
200 SMA (5%/-3% Buffer) for SPY & QQQ In my testing TQQQ is an absolute monster of an ETF that performs extremely well even from a buy and hold standpoint over long periods of time, its largest drawback is the massive drawdown exposure that it faces which can be easily sidestepped with this strategy.
This strategy is meant to basically abuse TQQQ's insane outperformance while augmenting the typical 200SMA strategy in a way that uses all of its strengths while avoiding getting whipsawed in sideways markets.
The strategy BUYS when price crosses 5% over the 200SMA and then SELLS when price drops 3% below the 200SMA. Between trades I'll be parking my entire account in SGOV.
So maximizing profit while minimizing risk.
You use the strategy based off of QQQ and then make the trades on TQQQ when it tells you to BUY/SELL.
Here are some reasons why I will be using this strategy:
Simple emotionless BUY and SELL signals where I don't care who the president is, what is happening in the world, who is bombing who, who the leadership team is, no attachment to individual companies and diversified across the NASDAQ.
~85% win percentage and when it does lose the loses are nothing compared to the wins and after a loss you're basically set up for a massive win in the next trade.
Max drawdown of around 53% when using TQQQ
You benefit massively when the market is doing well and when there is a recession you basically sit in SGOV for a year and then are set up for a monster recovery with a clear easy BUY signal. So as long as you're patient you win regardless of what happens.
The trades are often very long term resulting in you taking advantage of Long Term Capital Gains tax advantage which could mean saving up to 15-20% in taxes.
With only a few trades you can spend time doing other stuff and don't have to track or pay attention to anything that is happening.
Simple, easy, and massively profitable.

WaverVanir Alpha Reversal Scalper [ETF Eval Bot]🧠 Strategy Overview:
The WaverVanir Alpha Reversal Scalper is a precision-engineered futures trading bot designed to pass prop firm evaluations, specifically Elite Trader Funding (ETF) via Tradovate integration.
This scalping engine was developed after analyzing over 100+ evaluation trades, and is powered by institutional logic, volume behavior, and adaptive VWAP-based confluence.
🔍 Core Logic:
Directional Bias: Trades long only based on VWAP slope confirmation (to avoid funding-damaging shorts)
Entry Conditions:
Price deviates below VWAP standard deviation
Volume spike exceeds 1.5× 20-period average
Bullish reversal wick detected (smart money pattern)
Exit Management:
Stop Loss: 10-tick precision SL below local low
Take Profit: 2.5R static or dynamic trailing stop
Session Filter: Trades only between 9:00–14:00 ET, avoiding lunch and close traps
📊 Backtest Summary (ESU2025)
Metric Result
Net Profit $9,487.50
Profit Factor 1.66 (longs)
Sharpe Ratio 0.03
Sortino Ratio 0.042
Winning Bias Long-Only
Max Drawdown Under $3,000
Commissions $0 (sim tested)
🧪 Tested across March–July 2025 on CME Mini ES (ESU2025)
🔒 Short trades disabled after review: Net −$7,312.50 loss on shorts alone
✅ Profit factor improves > 60% post-optimization
🔄 Recent Optimizations
❌ Disabled unprofitable short setups
✅ VWAP slope filter added for institutional alignment
✅ Trailing stop logic added (activates after 1.5R)
⏱️ Session filter to reduce market noise
🧠 Designed For:
Passing ETF funding challenges quickly
Avoiding drawdown breaches with controlled risk
Running on TradingView with direct Tradovate integration
🚀 Execution-Ready
This bot runs natively on TradingView. Simply:
Add the Pine Script to your chart
Use a tradable symbol (e.g., ESU2025)
Create an alert using “Order fills”
✅ Enable auto-trading to Tradovate
📡 Learn More
🔗 Powered by VolanX Protocol, the AI-driven infrastructure layer of
🌐 WaverVanir International LLC – where institutional logic meets retail precision.
—
🧠 Want to upgrade this bot to include macros, adaptive entries, or launch in NQ/CL?
💬 Drop a comment or message — let’s build your funding empire.
#ES #Futures #ETF #Funding #PropFirm #TradingBot #VWAP #VolumeProfile #AlphaScalper #WaverVanir #VolanX

Refined MA + Engulfing (M5 + Confirmed Structure Break)I would like to start by saying that this strategy was put together using ChatGPT, some past trades from myself and some backtested trades, and from my time as a student in Wallstreet Academy under Cue Banks.
I am not profitable yet. I am too jumpy and blow accounts. I'm hoping this strategy (and it's indicator twin) can help me spend less time on the charts, so that I'm not tempted to press buttons as much.
It does fire quite a bit. But, the Strategy Tester tab shows a 30% win rate with our wins being significant to our losses. So, in theory, if you followed the rules of this strategy STRICTLY, you COULD BE profitable.
With that being said, there are times that this strategy has shown to trigger and I ask, "Why?".
I just want to help myself and others, and maybe make some decent\cool stuff along the way. Enjoy
KR
