METRIC-TREND-TRADERThis script is a Fully Automated trading script meant to be used with "Oanda" broker and the plug-ins for algorithmic trading automation.( FOREX ONLY)
This script is meant to capture "TREND FOLLOWING " for intraday charts (1hour) preferably and will hold for days / weeks .trading on forex markets.
(The combination of indicators includes a short high and low price channel and a longer term high and low price channel)
This script is original in description as being automated to try and capture dynamic trending markets with both long and short fractal price channels. although trend trading is not an original concept. trend trading with this dynamic indicator allows the user visualize both short term and longer term price action at the same time, helping to make better trading decisions. the channels are designed to buy breakouts in the direction of the longer term trend while trailing stop a built-in stop loss that allows normal market movement while attempting to lock in flexible profits.
The concept of this indicator is be able to quickly visualize trends by high lighting the large green areas beneath price "when trending long" which is the difference between the (user defined) short term lows and the (user defined) Long period price lows.
For "down trending" markets a large red area above price will be displayed and this is the difference between the (user defined) short term highs and the (user defined) long term highs.
This strategy uses a lower than reward profile to jump in direction of market moves for continuation,
(1 risk to 4 reward)
in the likelihood the instrument will continue (example) 200 pips before it reverts 50 pips in the counter direction.
This strategy should only be used in markets that you believe are "TRENDING" at the time of trading otherwise you risk trend trading a range market.
This script uses a (user defined period) of short term high and low price ( green/red color) and (user defined period) Long Term high and low price (green/red) chosen in the indicator settings menu.
The default parameters are 10 with a (minimum of 1 and maximum of 10000) for the short term channel and 50 with a (minimum of 1 and maximum of 10000) for the long term price channel , the default parameters = roughly 2 days "long term" and 10 hours "short term" of price action on the (1 hour) chart.
Strategy entries and exits , for Long trades the trade will be entered if the short term high crosses above the Long Term high and the Short term low is not equal to the Long term low . the trade will exit if profit or stop loss are hit or if the Short term low crosses under the long term low.
For Short trades the trade will enter short if , the short term low crosses under the long term low and the short term high is not equal to the long term high. the trade will exit if profit or stop loss are hit or the short term high crosses over the long term high
"The default parameters should be kept unless you fully understand the complete strategy"
There are two very important inputs to be selected at the user setting menu "Long Only " and "Short Only" if you are looking to place long trades only select "Long Only" or for short trades select " Short Only" it is not recommended to keep both selected as it will trade both sides!
When the trade is entered a red , a blue and green horizontal dotted line will appear on the chart.
the blue line is the strategy entry price , the red line is the stop loss price , and the green line is the take profit price . the colors will invert if the trade is long or short.
(Setting alerts should be done in the indicator settings menu, and the parameters you chose will determine the stop loss/target and the amount of "units = (position size)" you wish to trade for the (forex only) markets. using "alert() function calls only" is the only alert that should be used with this strategy.
(note : when "alert() function calls only" is set two messages will be sent, one closing any open position in the opposite direction and one placing the new order regardless if you are currently in a trade or not)
Trade targets , stoploss and trade position size are a user defined variables entered in the indicator settings menu. (target pips minimum 0 and a maximum of 1000)(stop pips minimum of 0 and maximum of 1000)
Back test date range is included in the script for back testing different data periods.
the back ground will be colored a transparent navy blue if the period you are looking trading is with in the date range( note: to place live trades the end date will need to be in the future)
this is also adjustable in the settings menu
The avoid spread filter is a user defined time in which the spread is typically higher than average, applying this filter avoids trades in the specified time. When this filter is applied there will be a transparent red back ground color in the specified time.
Back test default setting are equivocal to OANDA:USDJPY
at the time of this publication placing trades with the "Oanda" broker are as follows , USD units = 2000 equal 2000 USD position size . "Oanda" current leverage is 20 to 1 for this particular pair and commission is paid in spread (1.4) pips = 0.19 USD per trade , Margin required for the trade is 100.0 USD , Position sizing = 10% of a 1000 USD account.
OANDA:USDJPY
Cari dalam skrip untuk "profit"

HTF star - trailingDescription:
The HTF - Stars (Highertimeframe Stars) Strategy Script is designed to explore the behavior of a strategy using multiple timeframes. This experimental script focuses on identifying star candle patterns on a chosen higher timeframe and capturing subsequent price movements on a lower timeframe. By leveraging the power of star candle patterns forming on a higher timeframe, this strategy aims to capture potential trading opportunities on a shorter timeframe.
Key Features:
Multiple Timeframe Analysis: The strategy script allows you to be on a lower timeframe while searching for star candle patterns on a higher timeframe using the security function. This approach enables you to take advantage of higher timeframe insights and potentially capture favorable price movements on a shorter timeframe.
Star Candle Pattern Detection: The script identifies star candle patterns on the chosen higher timeframe. After the candle closes, a buy or sell order is executed on the lower timeframe, signaling a potential trading opportunity based on the detected pattern.
Trailing Stop: The strategy utilizes a trailing stop feature to manage trades. The trailing stop is set at a specified ATR (Average True Range) distance above or below the candle closes. This mechanism allows you to capture potential profits if the price moves in the anticipated direction and then reverses.
Mean Reversion Potential: During backtesting, it was observed that shorting stars above the 360 MA (Moving Average) and taking long positions on stars below the 360 MA yielded the most profitable results in the current market conditions. This suggests that star candle patterns in this context may serve as potential mean reversion signals. However, user inputs allow for customization, enabling you to experiment with different trading approaches when a star candle is detected.
Backtesting Feature: The script includes a backtesting feature that uses a percentage of equity, with 1% of equity set as the default. It displays a table presenting various statistics about the strategy's performance, providing valuable insights into its historical results.
Adjustable User Inputs: The script offers multiple adjustable settings, each accompanied by tooltips explaining their functionality. This flexibility allows you to fine-tune the strategy according to your preferences and experiment with different parameters to optimize its performance.
Disclaimer:
The HTF - Stars Strategy Script is provided for experimental and educational purposes only. Trading in the financial markets involves risk, and you should only trade with funds that you can afford to lose. The information presented in this script does not constitute financial advice or investment recommendations. Always conduct your own research and due diligence before making any investment decisions. The creator of this script shall not be held responsible for any losses or damages incurred from the use of this script. Historical performance is not indicative of future results.
Please note that past performance is not necessarily indicative of future results. Trading the markets involves risk, and there is no guarantee that the strategy described will be profitable for you. It is important to thoroughly test the strategy, adapt it to your trading style, and use proper risk management techniques.

D-Bot Alpha RSI Breakout StrategyHello dear Traders,
Here is a simple yet effective strategy to use, for best profit higher time frame, such as daily.
Structure of the code
The code defines inputs for SMA (simple moving average) length, RSI (relative strength index) length, RSI entry level, RSI stop loss level, and RSI take profit level. The default values of these variables can be customized as per the user's preferences.
The script calculates SMA and RSI based on the input parameters and the closing price of the asset.
Trading logic
This strategy allows the placement of a long position when:
The RSI crosses above the RSI entry level and
The close price is above the SMA value.
After entering a long position, it applies a trailing stop mechanism. The stop price is updated to the close price if the close price is lower than the last close price.
The script closes the long position when:
RSI falls below the stop loss level.
RSI reaches or exceeds the take profit level.
If the trailing stop is activated (once RSI reaches or exceeds the take profit level), the closing price falls below the trailing stop level.
Strengths
The strategy includes mechanisms for entering a position, taking profit, and stopping losses, which are fundamental aspects of a trading strategy.
It applies a trailing stop mechanism that allows to capture further gains if the price keeps increasing while protecting from losses if the price starts to decrease.
Weaknesses
This strategy only contemplates long positions. Depending on the market situation, the strategy may miss opportunities for short selling when the market is on a downward trend.
The choice of the fixed RSI entry, stop loss, and take profit levels may not be ideal for all market conditions or assets. It might benefit from a more adaptive mechanism that adjusts these levels according to market volatility or trend.
The strategy doesn't factor in trading costs (such as spread or commission), which could have a significant impact on the net profit, especially if the user is trading with a high frequency or in a low liquidity market.
How to trade with this strategy
Given these parameters and the strategy outlined by the code, the trader would enter a long position when the RSI crosses above the RSI entry level (default 34) and the closing price is above the SMA value (SMA calculated with default period of 200). The trader would exit the position when either the RSI falls below the RSI stop loss level (default 30), or RSI rises above the RSI take profit level (default 50), or when the trailing stop is hit.
Remember "The strategies I have prepared are entirely for educational purposes and should not be considered as investment advice. Support your trades using other tools. Wishing everyone profitable trades..."

Mechanical Trading StrategyThe "Mechanical Trading Strategy" is a simple and systematic approach to trading that aims to capture short-term price movements in the financial markets. This strategy focuses on executing trades based on specific conditions and predetermined profit targets and stop loss levels.
Key Features:
Profit Target: The strategy allows you to set a profit target as a percentage of the entry price. This target represents the desired level of profit for each trade.
Stop Loss: The strategy incorporates a stop loss level as a percentage of the entry price. This level represents the maximum acceptable loss for each trade, helping to manage risk.
Entry Condition: The strategy triggers trades at a specific time. In this case, the condition for entering a trade is based on the hour of the candle being 16 (4:00 PM). This time-based entry condition provides a systematic approach to executing trades.
Position Sizing: The strategy determines the position size based on a fixed percentage of the available equity. This approach ensures consistent risk management and allows for potential portfolio diversification.
Execution:
When the entry condition is met, signified by the hour being 16, the strategy initiates a long position using the strategy.entry function. It sets the exit conditions using the strategy.exit function, with a limit order for the take profit level and a stop order for the stop loss level.
Take Profit and Stop Loss:
The take profit level is calculated by adding a percentage of the entry price to the entry price itself. This represents the profit target for the trade. Conversely, the stop loss level is calculated by subtracting a percentage of the entry price from the entry price. This level represents the maximum acceptable loss for the trade.
By using this mechanical trading strategy, traders can establish a disciplined and systematic approach to their trading decisions. The predefined profit target and stop loss levels provide clear exit rules, helping to manage risk and potentially maximize returns. However, it is important to note that no trading strategy is guaranteed to be profitable, and careful analysis and monitoring of market conditions are always recommended.

VWAP Trendfollow Strategy [wbburgin]This is an experimental strategy that enters long when the instrument crosses over the upper standard deviation band of a VWAP and enters short when the instrument crosses below the bottom standard deviation band of the VWAP. I have added a trend filter as well, which stops entries that are opposite to the current trend of the VWAP. The trend filter will reduce total false breakouts, thus improving the % profitable while maintaining the overall returns of the strategy. Because this is a trend-following breakout strategy, the % profitable will typically be low but the average % return will be higher. As a rule, be sure to look at the average winning trade % compared to the average losing trade %, and compare that to the % profitable to judge the effectiveness of a strategy. Factor in fees and slippage as well.
This strategy appears to work better with the lower timeframes, and I was impressed with its results. It also appears to work on a wide range of asset classes. There isn't a stop loss or take profit built-in (other than the reversal signals, which close the current trade), so I would encourage you to expand on the strategy based on your own trading parameters.
You can toggle off the bar colors and the trend filter if you so desire.
Future updates to this script (or ideas of improving on it) might include a take profit level set at one standard deviation past the current level and a stop loss level set at one standard deviation closer to the vwap from the current level - or applying a multiple to the two based off of your reward/risk ratio.
About the strategy results below: this is with commissions of 0.5 % per trade.

Premium MTF Layered RSI - Bitcoin Bot [wbburgin]This the premium version of my MTF Layered RSI strategy, which improves significantly on the original strategy (publicly available on my profile). Improvements are below. This strategy will also appear as an overlay on your chart. It is completely non-repainting.
The MTF Layered RSI strategy uses the current timeframe and two configurable higher timeframes to enter a long position when Bitcoin is oversold on all three timeframes, and exit the long position when Bitcoin is overbought on the current timeframe. This hedges against situations where the RSI on higher timeframes never reaches the overbought level and we are left "holding the bag" so to speak with the classic "enter long at oversold and enter short at overbought" strategy.
IMPORTANT: This strategy does not work on ranges. It will work on all timeframes and assets, but does not work on ranges (Renko blocks and some other advanced types of charts).
********** My Background
I am an investor, trader, and entrepreneur with 10 years of cryptocurrency and equity trading experience and founder of two fintech startups. I am a graduate of a prestigious university in the United States and carry broad and inclusive interests in mathematical finance, computer science, machine learning / artificial intelligence, as well as other fields.
**********
Improvements over the original MTF RSI strategy include:
Filters for Uptrends and Downtrends → The Premium RSI strategy will adjust its buy and sell thresholds depending on whether the instrument is trending. This means that, in uptrends, the Premium strategy will buy more frequently, bringing in potentially greater profit, and in downtrends, the strategy will stop buying altogether. These filters and dynamic buy/sell thresholds have made this strategy more profitable in my backtesting across random timeframes, but I cannot guarantee that the strategy will be profitable for you on the default settings. To that end, I have enabled a number of different configurations that you can change in the settings of the strategy.
Stop Loss / Take Profit Calculation Per Tick → Stop loss and take profit are now both enabled in the script and each has their own alerts. You can specify what type of stop loss or take profit you want: percentage or ATR. If you have alerts configured, you will be alerted mid-bar, instead of at close. This helps prevent loss from abrupt falls in price between closing price and next bar open.
Customizable Alert Messages In-Strategy → In the settings, there will be text boxes where you can create your own alerts. All you will need to do is create an alert in the alert panel on Tradingview and leave the message box blank - if you fill out the alert boxes in the settings, these will automatically populate into your alerts. There are in total eight different customizable alerts messages: Entry, Exit, Stop loss, and Take profit alerts for both Long and Short sides. If you disable stop loss and/or take profit, these alerts will also be disabled. Similarly, if you disable shorts, all short alerts will be disabled.
**********
Display
Configuring Stop Loss or Take Profit will make their corresponding displays appear.
Separately from the trading boxes, background colors (green, red) signify extended uptrends and downtrends, respectively.
Configuring Alerts
In TradingView desktop, go to the ‘Alerts’ tab on the right panel. Click the “+” button to create a new alert. Select this strategy for the condition and one of the two options that includes alert() function calls. Name the alert what you wish and clear the default message, because your text in the settings will replace this message.
Now that the alert is configured, you can go to the settings of the strategy and fill in your chosen text for the specific alert condition. You will need to check “Long and Short” in the “Trade Direction” setting in order for any Short Alerts to become active. Similarly, you will need to check “Enable Stop Loss” for stop loss alerts to become active and “Enable Take Profit” for take profit alerts to become active.
**********
Disclaimer
Copyright by wbburgin.
The information contained in my Scripts/Indicators/Algorithms does not constitute financial advice or a solicitation to buy or sell any securities of any type. I will not accept liability for any loss or damage, including without limitation any loss of profit, which may arise directly or indirectly from the use of or reliance on such information.
All investments involve risk, and the past performance of a security, industry, sector, market, financial product, trading strategy, backtest, or individual's trading does not guarantee future results or returns. Investors are fully responsible for any investment decisions they make. Such decisions should be based solely on an evaluation of their financial circumstances, investment objectives, risk tolerance, and liquidity needs.
**********
Notes on the Strategy Performance below: This is 3% of equity per trade, with a pyramiding number of 3. I did not include fees because Binance US on Bitcoin/USD does not charge fees on the instrument; however, I heavily encourage you to include fees in your backtesting if you use a different brokerage. To mitigate fees, this strategy is designed with a high average %/trade. If your current fees are greater than the strategy's average %/trade, I encourage you to choose a higher RSI period, such as 14 or 28, which will result in less trades but potentially a higher %/trade.

Index Strength Strategy with Signal Using the Index Strength Strategy Indicator for Trading
Introduction:
In this article, we'll explore the Index Strength Strategy Indicator and how it can be used for trading. The Index Strength Strategy Indicator is a technical analysis tool designed to help traders identify trends, determine trend strength, and generate buy and sell signals.
Overview of the Index Strength Strategy Indicator:
The Index Strength Strategy Indicator is based on two moving averages - a fast moving average and a slow moving average - and the Relative Strength Index (RSI). The fast and slow moving averages are used to determine the trend direction, while the RSI is used to calculate the trend strength. The indicator assigns a strength score to the current trend, which is then classified into one of four categories - Very Weak, Weak, Strong, or Very Strong. Traders can use this information to identify the strength of the trend and adjust their trading strategy accordingly.
The indicator also generates buy and sell signals based on a user-defined threshold level. When the strength score crosses above the threshold level, a buy signal is generated, and when the strength score crosses below the threshold level, a sell signal is generated.
Using the Index Strength Strategy Indicator for Trading:
Traders can use the Index Strength Strategy Indicator to identify trends, determine trend strength, and generate buy and sell signals. To use the indicator, traders should first determine the appropriate fast and slow moving average periods and the strength threshold level for their trading style. These input parameters can be adjusted in the indicator's settings.
Once the indicator is added to the chart, traders can use the strength score and trend direction to identify potential trading opportunities. If the trend is classified as Strong or Very Strong, traders may look for opportunities to enter long or short positions in the direction of the trend. If the trend is classified as Very Weak or Weak, traders may look for opportunities to exit or avoid positions.
Traders can also use the buy and sell signals generated by the indicator to enter or exit positions. When a buy signal is generated, traders can enter a long position, and when a sell signal is generated, traders can enter a short position. Traders should set stop-loss and take-profit levels based on their risk management strategy.
Avoiding Mistakes:
To avoid mistakes when using the Index Strength Strategy Indicator, traders should keep the following tips in mind:
Don't rely solely on the indicator - it should be used in conjunction with other technical analysis tools and fundamental analysis.
Use appropriate risk management strategies, including setting stop-loss and take-profit levels.
Adjust the input parameters of the indicator to match your trading style and preferences.
Avoid overtrading and chasing trades - wait for the right opportunities to enter or exit positions.
Trading Strategy Test Results: Time Frame Tested for 15 Mins
To provide an idea of the potential performance of the Index Strength Strategy Indicator, let's look at some recent test results for two popular indices - Bank Nifty and Nifty 50.
From 1-May-2023 to 12-May-2023, using 2 lots of Bank Nifty with the Index Strength Strategy Indicator, a profit of 15,175 was achieved, with a percentage profitable trade rate of 80% and a profit factor of 3.395. The maximum drawdown was 7,000, and the average trade was 3,035.
During the same time period, using 1 lot of Nifty 50 with the Index Strength Strategy Indicator, a profit of 8,187 was achieved
Conclusion:
The Index Strength Strategy Indicator is a useful tool for traders to identify trends, determine trend strength, and generate buy and sell signals. Traders can use the indicator in conjunction with other technical analysis tools and fundamental analysis to make informed trading decisions. By following proper risk management strategies and avoiding common mistakes, traders can use the indicator to improve their trading performance.

FRAMA & CPMA Strategy [CSM]The script is an advanced technical analysis tool specifically designed for trading in financial markets, with a particular focus on the BankNifty market. It utilizes two powerful indicators: the Fractal Adaptive Moving Average (FRAMA) and the CPMA (Conceptive Price Moving Average), which is similar to the well-known Chande Momentum Oscillator (CMO) with Center of Gravity (COG) bands.
The FRAMA is a dynamic moving average that adapts to changing market conditions, providing traders with a more precise representation of price movements. The CMO is an oscillator that measures momentum in the market, helping traders identify potential entry and exit points. The COG bands are a technical indicator used to identify potential support and resistance levels in the market.
Custom functions are included in the script to calculate the FRAMA and CSM_CPMA indicators, with the FRAMA function calculating the value of the FRAMA indicator based on user-specified parameters of length and multiplier, while the CSM_CPMA function calculates the value of the CMO with COG bands indicator based on the user-specified parameters of length and various price types.
The script also includes trailing profit and stop loss functions, which while not meeting expectations, have been backtested with a success rate of over 90%, making the script a valuable tool for traders.
Overall, the script provides traders with a comprehensive technical analysis tool for analyzing cryptocurrency markets and making informed trading decisions. Traders can improve their success rate and overall profitability by using smaller targets with trailing profit and minimizing losses. Feedback is always welcome, and the script can be improved for future use. Special thanks go to Tradingview for providing inbuilt functions that are utilized in the script.

Moving Average Trap Strategy by D. BrigagliaThis is a strategy that follows the 200 periods moving average and fades the cross of ma3, ma5 and ma8. It is designed for profiting by mean reversion while at the same time respecting long term trend. It is designed for long term trending markets such as stocks and stock indices.
In this backtest, the strategy shows the ability to beat the S&P500 index with an average slippage set to 2 ticks. The number of trades is good (350), the profit factor is acceptable (1.67). The drawdowns are also reduced compared to the underlying asset.
Nothing of my content is financial advice.

MTF Diagonally Layered RSI - 1 minute Bitcoin Bot [wbburgin]This is a NON-REPAINTING multi-timeframe RSI strategy (long-only) that enters a trade only when two higher timeframes are oversold. I wrote it on BTC/USD for 1min, but the logic should work on other assets as well. It is diagonally layered to be profitable for when the asset is in a downtrend.
Diagonal layering refers to entry and exit conditions spread across different timeframes. Normally, indicators can become unprofitable because in downtrends, the overbought zones of the current timeframe are not reached. Rather, the overbought zones of the faster timeframes are reached first, and then a selloff occurs. Diagonally-layered strategies mitigate this by selling diagonally, that is, selling once the faster timeframe reaches overbought and buying once the slower timeframe reaches oversold.
Thus this strategy is diagonally layered down . I may create a separate script that alternates between diagonal-up and diagonal-down based off of overall trend, as in extended trend periods up this indicator may not flash as frequently. This can be visualized in a time series x timeframe chart as an "X" shape. Something to consider...
Let me know if you like this strategy. Feel free to alter the pyramiding entries, initial capital, and entry size, as well as commission regime. My strategies are designed to maximize average profit instead of flashing super frequently, as the fees will eat you up. Additionally, at the time of publication, all of my strategy scripts are intended to have profitable Sharpe and Sortino ratios.
Timeframes, RSI period, and oversold/overbought bounds are configurable.

Bitcoin 30m Swing Trader Long/Short StrategyIntro
I want to share the results of my passionate hobby and the unstoppable chase for a profitable automated trading strategy. It has been created with the intention of trading only Bitcoin. Altcoins are not interesting for me, as I have discovered lots of issues with finding the right parameter values for experiencing a good performance. As altcoins typically follow the trend of bitcoin and characteristically have a high volatility that may cause stop-hunts, I decided to not over complicate this project. I was just aiming for a profitable trading strategy with an acceptable drawdown and enough confidence by a statistically significant number of trades beside a wide backtesting timespan (credits going out to TradingView: Deep Backtesting).
Total time spent on this is approximately 2 years.
Indicators used
RSI: Used for entries and trend reversal spots
MACD: Used for entry and exit optimiziation
ATR: Used for dynamic offsets in trend definition indicator
Custom trend indicator: Self-made indicator, based on simple price action of higher timeframes using pivot points to find support and resistance zones that have formerly been created
Strategy parameters
I have reduced the total parameters used to just a few. It took lots of working hours to find appropriate values along the trading algorithm and I don’t want to overcomplicate it to you.
This strategy is for those, who have been looking for a working strategy. No DIY kit.
Feel free to adapt Take profit or stop loss targets. But it’s not recommended to do so.
How it works
Entries:
I started with a kind of template that I have been using for strategies for a long time. This includes how to find the right Entries during a trend as well as spotting trend reverse opportunities. Here I combine simple indicators like RSI and MACD beside necessary trend conditions. If a target RSI Value is hit, it will enter a trade, after MACD histogram has stopped to fall/rise. Depends on long/short. While we are in a trade and trend reversed, it waits for a specific RSI target level to be hit, to reverse the trade. As simple as it is, it closes the open one and starts a trade in other direction.
Micro trend:
It starts to get more interesting when it comes to trend recognition, as it forms the core of the strategy and discovering appropriate values for it has been very hard. The final trend variable is defined by the responses over higher timeframes of my self-made trend indicator. Executed on the current timeframe, the trend indicator is quite interesting. But for a automated trading strategy it is necessary to deviate trading instructions from higher timeframes trends.
Macro trend:
The same process that happens for micro trend is also applied with much higher timeframes, like 3D or weekly. The basic assumption is, that if we are in a bull or bear run, where retail investors are flooding the markets, we are increasing our take profit targets respectively. This way we can catch bigger moves in bigger trends.
Exits:
Closing a trade generally happens when a TP target (in %) is hit, or the SL (in %) is hit. The strategy has a special treatment with SL’s. After it happens, the strategy is more careful about market conditions and typically waits for a countertrade. The third way of closing a trade has already been mentioned: the reverse trades. They happen during choppy market conditions. The strategy has also special awareness here and tracks, if reverse trades start to happen more often. After a while, it starts to be more restrictive in opening new reverse trades.
Performance
Capabilities and limitations:
As I have already mentioned the strategy is only optimized for bitcoin (Perpetual Futures). This does not mean, it can not be used on other markets, because the algorithm itself is universal appliable. A very hard task was about finding the right parameter values for the strategy performing like this. If you have a special wish to configure this strategy for a specific market, DM me. The strategy has been tested with different configurations on the following timeframes: 30, 15, 10, 5, 1. I have decided to publish the one for 30m TF, because its performance simply convinced me.
Repainting:
It has been tested lots of times against repainting.
Confidence:
The total backtesting performance reaches out to 2019-09-08. So the strategy has been managing to be successful since then, but this does not guarantee that the logic, this strategy follows, is going to continue this level in future.
Commission:
The algorithm is configured with 0.04% commission per trade, as it is on Binance (for Future Market orders).
Ordersize:
Its totally up to you, how much of your total equity should be traded. Nevertheless, I would personally recommend to not exceed 50% ordersize of your equity with this strategy. In the past, you would have had great performance beside a drawdown, that was from psychological point of view good to handle with. This strategy additionally uses STOP LOSSES, so you can never loose you whole ordersize at one trade.
Slippage:
You also must consider about getting slipped when trading this strategy on live markets. Statistically one could assume, that the slippage could be neutral, as it can be both positive or negative. It depends on your execution time, the exchange, on which you are executing trades and market conditions. But keep it in mind, as if you have too much slippage, this strategy would be unprofitable.

Cycle Position TradingTitle: Cycle Position Trading Strategy v1.0
Description: Cycle Position Trading Strategy is a simple yet effective trading strategy based on a 200-day Simple Moving Average (SMA). Users can select between two modes, "Buy Uptrend" and "Buy Downtrend," to customize the strategy according to their trading preferences. The strategy allows users to set their own stop loss (SL) and take profit (TP) levels, providing more flexibility and control over their trades.
Features:
Choose between two trading modes: "Buy Uptrend" and "Buy Downtrend."
Customize your stop loss (SL) and take profit (TP) levels.
Clear visual representation of the 200-day Simple Moving Average (SMA) on the chart.
How to use:
Add the strategy to your chart by searching for "Cycle Position Trading Strategy" in the TradingView "Indicators & Strategies" section.
Configure the strategy settings according to your preferences:
Select the trading mode from the dropdown menu. "Buy Uptrend" will open long positions when the closing price is above the 200-day SMA. "Buy Downtrend" will open long positions when the closing price is below the 200-day SMA.
Set your desired stop loss (SL) and take profit (TP) levels. The default values are 0.9 (10% below the entry price) for the stop loss and 1.1 (10% above the entry price) for the take profit.
Monitor the chart for trade signals based on the chosen mode and settings. The strategy will enter and exit trades automatically based on the selected mode and the configured stop loss and take profit levels.
Analyze the performance of the strategy by checking the TradingView strategy performance summary or by viewing individual trades in the "Trades" list.
Disclaimer: This strategy is intended for educational and illustrative purposes only. Use it at your own risk. Past performance is not indicative of future results. Trading stocks, cryptocurrencies, or any other financial instrument involves significant risk and may result in the loss of capital.
Version: v1.0
Release date: 2023-03-25
Author: I11L
License: Mozilla Public License 2.0 (mozilla.org)

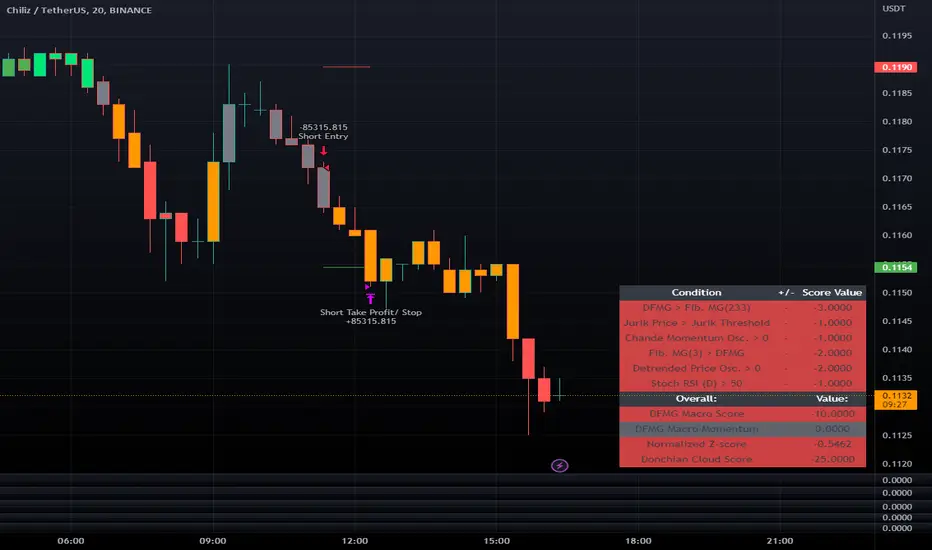
LeafAlgo Premium Macro StrategiesA "macro score", as defined here, is created by giving various weights to different signals and adding them together to get one smooth score. Positive or negative values are assigned to each of the signals depending on if the statement is true or false (e.g. DPO > 0: +1, DPO < 0: -1). This manner of strategy allows for a subset of the available signals to be present at one time as opposed to every technical signal having to be active in order for a long/short signal to trigger.
This strategy contains SIX different macro score strategies -- "Base DFMA", "Base DFMG", "Ichimoku", "TSI", "Donchian DFMA", and "Donchian DFMG". These strategies have the signals and weights pre-determined in the code. The "Base DFMA" strategy is based on our Democratic Fibonacci Moving Average (DFMA) indicator; the "Donchian DFMA" is the same as the base DFMA strategy, but with a signal from our Donchian Cloud Score indicator as added confluence. The "Base DFMG" strategy is based on our Democratic Fibonacci McGinley Dynamics (DFMG) indicator; the "Donchian DFMG" is the same, but with the Donchian Cloud Score as added confluence. The "Ichimoku" strategy is based on the major sub-indicators found within an Ichimoku Cloud in addition to our Donchian Cloud Score. The "TSI" strategy is based on the True Strength Index.
The ability to select your strategy of choice can be found at the top of the strategy settings under "Strategy Options", then in the drop-down menu labeled "Strategy Choice".
The DFMA - Democratic Fibonacci Moving Average - is a separate indicator that we have released that takes 10 different Fibonacci MAs (lengths of 3 to 233, at Fibonacci intervals) and averages them to form the DFMA line. This helps by creating a consensus on the trend based on moving averages alone. Crossovers of the DFMA with the various Fib MA lengths as well as a cross of the price source and these lines can provide adequate long and short signals. In the two DFMA strategies, the heaviest weights have been given to crosses of the DFMA line/Fib MA (233) as well as the crosses of the Fib MA (3)/DFMA. Additionally, there are thresholds for DPO ( Detrended Price Oscillator , above or below 0), CMO ( Chande Momentum Oscillator , above or below 0), Jurik Volatility Bands (above or below 0), and Stoch RSI (above or below 50). These four signals hold a lighter weight than the MA cross signals. The macro score itself ranges between -10 and 10. In addition to the macro score line, a momentum line (sourced by the macro score itself) has been included. A crossover/crossunder of the macro score and the macro momentum line is included into the long/short signal syntax in addition to a threshold for the macro score.
The DFMG - Democratic Fibonacci McGinley Dynamics - is a separate indicator that we have released that takes 10 different Fibonacci McGinley Dynamic liness (lengths of 3 to 233, at Fibonacci intervals) and averages them to form the DFMG line. This helps by creating a consensus on the trend based on moving averages alone. Crossovers of the DFMG with the various Fib MG lengths as well as a cross of the price source and these lines can provide adequate long and short signals. This strategy has the signals and weights pre-determined in the code. Heaviest weights have been given to crosses of the DFMG line/ McGinley (233) as well as the crosses of the McGinley (3)/DFMG. Additionally, there are thresholds for DPO ( Detrended Price Oscillator , above or below 0), CMO ( Chande Momentum Oscillator , above or below 0), Jurik Volatility Bands (above or below 0), and Stoch RSI (above or below 50). These four signals hold a lighter weight than the McGinley cross signals. The macro score itself ranges between -10 and 10. In addition to the macro score line, a momentum line (sourced by the macro score itself) has been included. A crossover/crossunder of the macro score and the macro momentum line is included into the long/short signal syntax in addition to a threshold for the macro score.
For the Ichimoku macro score, five signals were considered and weighted equally:
- Kijun-sen < Ichimoku Source
- Tenkan-sen < Ichimoku Source
- Kijun-sen > Chikou-span
- Tenkan-sen > Kijun-sen
- Senkou Span A > Senkou Span B
In addition to these factors, the Ichimoku strategy utilizes the Donchian Cloud Score in the long and short entry signals. Thus, the Donchian Cloud settings are applicable to this strategy.
For the True Strength Index strategy, the heaviest weights have been given to various TSI signals, including a crossover/crossunder of TSI signal and TSI value, a threshold for the TSI Signal (above or below 0), and a crossover/crossunder of the CMO ( Chande Momentum Oscillator ) and the TSI signal line. Additionally, there are thresholds for DPO ( Detrended Price Oscillator , above or below 0), Jurik Volatility Bands (above or below 0), and Stoch RSI (above or below 50). These three signals hold a lighter weight than the three TSI signals. The macro score itself ranges between -10 and 10. In addition to the macro score line, a momentum line (sourced by the macro score itself) has been included. A crossover/crossunder of the macro score and the macro momentum line is included into the long/short signal syntax in addition to a threshold for the macro score.
The Donchian Cloud Score is derived from a set of 5 Donchian channels (upper, lower, and basis plotted) defaulted to lengths of 25, 50, 100, 150, and 200. A set of conditions associated with the channels aims to determine ranging versus trending markets. Weights are given to these conditions accordingly, then tallied up to determine the "cloud score", ranging between -25 and 25. In general, a ranging market is determined by a cloud score between -10 and 10, while a positive trending market has a score higher than 10 and a negative trending market has a score lower than -10. That said, long and short thresholds similar to the macro score itself are included in the user settings and set to a default of 5 or -5. The cloud score is plotted as a line in the underlay with coloration reflecting ranging or trending markets (green color above the long threshold, gray between the thresholds, and red below the short threshold). The cloud score is incorporated into the strategy syntax for long and short positions in that the score must be above or below the set threshold for a trade to be placed. A breakdown for the Donchian scoring is as follows:
- Broke the 25-length DC (DC(25)) upper band in the previous 3 bars - +1 if true, 0 if false
- Broke the DC(50) upper band in the previous 3 bars - +2 if true, 0 if false
- Broke the DC(100) upper band in the previous 3 bars - +3 if true, 0 if false
- Broke the DC(150) upper band in the previous 3 bars - +4 if true, 0 if false
- Broke the DC(200) upper band in the previous 3 bars - +5 if true, 0 if false
- Broke the DC(25) lower band in the previous 3 bars - -1 if true, 0 if false
- Broke the DC(50) lower band in the previous 3 bars - -2 if true, 0 if false
- Broke the DC(100) lower band in the previous 3 bars - -3 if true, 0 if false
- Broke the DC(150) lower band in the previous 3 bars - -4 if true, 0 if false
- Broke the DC(200) lower band in the previous 3 bars - -5 if true, 0 if false
- DC(25) basis line above the DC(50) basis line - +1 if true, -1 if false
- DC(25) basis line above the DC(100) basis line - +1 if true, -1 if false
- DC(25)basis line above the DC(150) basis line - +1 if true, -1 if false
- DC(25) basis line above the DC(200) basis line - +1 if true, -1 if false
- DC(50) basis line above the DC(100) basis line - +1 if true, -1 if false
- DC(50) basis line above the DC(150) basis line - +1 if true, -1 if false
- DC(50) basis line above the DC(200) basis line - +1 if true, -1 if false
- DC(100) basis line above the DC(150) basis line - +1 if true, -1 if false
- DC(100) basis line above the DC(200) basis line - +1 if true, -1 if false
- DC(150) basis line above the DC(200) basis line - +1 if true, -1 if false
Thresholds for both the respective macro score and the Donchian Cloud score have been included. Entry signals for each strategy require the score to be >= the respective thresholds for longs and <= the respective thresholds for shorts.
Additionally, a normalized z-score has been included. The z-score does not affect the entry and exit signals, however, it is displayed on the chart in the form of bar coloration. The z-score has been normalized to a range of -1 to +1. A z-score under -0.60 is displayed as a red bar color, a score between -0.60 and -0.2 is displayed as an orange bar color, a score between -0.2 and 0.2 is displayed as a gray bar color, a score between 0.2 and 0.6 is displayed as a lime bar color, and a score over 0.6 is displayed in green.
Data for each respective strategy will be displayed in an overlaid table. This includes the factors that comprise the macro score of choice, the values of each signal that adds up to the macro score, the macro score itself, the value of the momentum line of the macro score, the normalized z-score value, and the Donchian Cloud score (if applicable). Green coloration notes bullish sentiment within the signals or values, gray coloration is neutral, and red coloration notes bearish sentiment.
Take profit, stop loss, and trailing percentages are also included, found at the bottom of the Input tab under “TT and TTP” as well as “Stop Loss”. The take profit and stop loss levels will be reflected as green and red lines respectively on the chart as they occur. Make sure to understand the TP/SL ratio that you desire before use, as the desired hit rate/profitability percentage will be affected accordingly. The option for adding in a trailing stop has also been included, with options to choose between an ATR-based trail or a percentage-based trail. This strategy does NOT guarantee future returns. Apply caution in trading regardless of discretionary or algorithmic. Understand the concepts of risk/reward and the intricacies of each strategy choice before utilizing them in your personal trading.
Profitview/Pineconnector Settings:
If you wish to utilize Profitview’s automation system, find the included “Profitview Settings” under the Input tab of the strategy settings menu. If not, skip this section entirely as it can be left blank. Options will be “OPEN LONG TITLE”, “OPEN SHORT TITLE”, “CLOSE LONG TITLE”, and “CLOSE SHORT TITLE”. If you wished to trade SOL, for example, you would put “SOL LONG”, “SOL SHORT”, “SOL CLOSE LONG”, and “SOL CLOSE SHORT” in these areas. Within your Profitview extension, ensure that your Alerts all match these titles. To set an alert for use with Profitview, go to the “Alerts” tab in TradingView, then create an alert. Make sure that your desired asset and timeframe are currently displayed on your screen when creating the alert. Under the “Condition” option of the alert, select the strategy, then select the expiration time. If using TradingView Premium, this can be open-ended. Otherwise, select your desired expiration time and date. This can be updated whenever desired to ensure the strategy does not expire. Under “Alert actions”, nothing necessarily needs to be selected unless so desired. Leave the “Alert name” option empty. For the “Message”, delete the generated message and replace it with {{strategy.order.alert_message}} and nothing else. If using Pineconnector, follow the same directions for setting up an alert, but use the ",buy,,risk=" syntax as noted in the tooltips.
Self Optimizing Supertrend [Starbots]Self Optimizing Supertrend Strategy. (non-repainting)
Script constantly tests 15 Supertrend combinations for maximum profitability and trades based on the best performing combination.
You will notice that signal lines switch after a bar close sometimes, this is when the strategy optimizes to the better combination and change plots, strategy is dynamic.
---------------------------------------------------------------------------------------------------------
# Average True Range (ATR)
The Average True Range (ATR) is a tool used in technical analysis to measure volatility. Unlike many of today's popular indicators, the ATR is not used to indicate the direction of price. Rather, it is a metric used solely to measure volatility, especially volatility caused by price gaps or limit moves.
# Supertrend
A Super Trend is a trend following indicator similar to moving averages. It is plotted on price and the current trend can simply be determined by its placement vis-a-vis price. It is a very simple indicator and is constructed with the help of just two parameters- period and multiplier.
When we construct the Supertrend indicator strategy, the default parameters are 10 for Average True Range (ATR) and 3 for its multiplier. The average true range (ATR) plays a key role in ‘Supertrend’ as the indicator uses ATR to compute its value and it signals the degree of price volatility.
-----------------------------------------------------------------------------------------------------------
-Turn on Supertrend Profit Dashboard and spot the worst/best performing combination. You can change them to get the best performance overall.
-Backtesting Range - backtest within your desired time window. Example: 'from 01 / 01 /2020 to 01 / 01 /2023'.
-Optimizing range - you can decrease the amount of bars/data for optimizing script. This way you can keep it up to date to more recent market by selecting optimizing range to optimize it just from the recent 3-6months of data for example. Strategy before this selected range will normally trade (backtest) based on the fifth buying condition (5. Supertrend Factor) parameter in your menu (1.6 by default) if you turn this on.
*I recommend 'Optimizing Range' turned off actually, use max amount of available bars in your history for optimization script.
- Strategy is trading on the bar close without repaint. You can trade Long-Sell or Long- Short. Alerts available, insert webhook messages.
- Turn on Profit Calendar for better overview of how your strategy performs monthly/annualy
- Recommended ATR Length : 10 (default), higher timeframes usually performs good on the shorter period lengths 6-10, smaller timeframes on the larger ATR period length 10-20.
- Recommended Sources : hl2 (default Supertrend), close, hlc3, hlcc4 (when scalping/day trading and market is uptrending good, you can use 'volume' as a source, comes in handy)
- Recommended Smoothing Moving Average for ATR : We smooth the ATR calculation with moving average, traders usually use SMA as a moving average here, but you can use alternatives like EMA, HMA. Try them if this improves your results.
- Recommended TF : 15min, 30min, 1h, 2h, 4h, 8h, 1d (low timeframes works good if you have no fees like Binance currently do on BTC for example otherwise you probably want to use 1/2h+ chart)
- Supertrend Factor parameters : pre-set Supertrend Factors are very good and common in trading world, you don't need to change them, but you can do it at free will. Traders usually use Supertrend factor of 2 or 3, use parameters around this numbers.
- Notes window : add your custom comments in or save your webhook message text inside here for later use.
- Trading Session: in a session, you have to specify the time range for every day. It will trade only within this window and close trades when it's out. Session from 9am to 5pm will look like that: 0900-1700 or 7am to 4:30pm 0700-1630. After the colon, you can specify days of the week for your trading session. 1234567 trading all days, 23456 – Monday to Friday ('1 is Sunday here'). 0000-0000:1234567 by default will trade every day nonstop. 00.00am to 00.00pm and 1234567 every day of the week for example - Cryptocurrencies.
This script is simple to use for any trader as it saves a lot of time for searching good parameters on your own. It's self-optimizing and adjusting to the markets on the go.

Strategy for UT Bot Alerts indicator Using the UT Bot alerts indicator by @QuantNomad, this strategy was designed for showing an example of how this indicator could be used, also, it has the goal to help some people from a group that use to use this indicator for their trading. Under any circumstance I recommend to use it without testing it before in real time.
Backtesting context: 2020-02-05 to 2023-02-25 of BTCUSD 4H by Tvc. Commissions: 0.03% for each entry, 0.03% for each exit. Risk per trade: 2.5% of the total account
For this strategy, 3 indicators are used:
UT Bot Alerts indicator by Quantnomad
One Ema of 200 periods for indicate the trend
Atr stop loss from Gatherio
Trade conditions:
For longs:
Close price is higher than Atr from UT Bot
Ema from UT Bot cross over Atr from UT Bot.
This gives us our long signal. Stop loss will be determined by atr stop loss (white point), break even(blue point) by a risk/reward ratio of 0.75:1 and take profit of 3:1 where half position will be closed. This will be showed as buy (open long position)
The other half will be closed when close price is lower than Atr and Ema from UT Bot cross under Atr. This will be showed as cl buy (close long position)
For shorts:
Close price is lower than Atr from UT Bot
Ema from UT Bot cross over Atr from UT Bot.
This gives us our short signal. Stop loss will be determined by atr stop loss (white point), break even(blue point) by a risk/reward ratio of 0.75:1 and take profit of 3:1 where half position will be closed. This will be showed as sell (open short position)
The other half will be closed when close price is higher than Atr and Ema from UT Bot cross over Atr. This will be showed as cl sell (close short position)
Risk management
For calculate the amount of the position you will use just a small percent of your initial capital for the strategy and you will use the atr stop loss for this.
Example: You have 1000 usd and you just want to risk 2,5% of your account, there is a long signal at price of 20,000 usd. The stop loss price from atr stop loss is 19,000. You calculate the distance in percent between 20,000 and 19,000. In this case, that distance would be of 5,0%. Then, you calculate your position by this way: (initial or current capital * risk per trade of your account) / (stop loss distance).
Using these values on the formula: (1000*2,5%)/(5,0%) = 500usd. It means, you have to use 500 usd for risking 2.5% of your account.
We will use this risk management for apply compound interest.
In settings, with position amount calculator, you can enter the amount in usd of your account and the amount in percentage for risking per trade of the account. You will see this value in green color in the upper left corner that shows the amount in usd to use for risking the specific percentage of your account.
Script functions
Inside of settings, you will find some utilities for display atr stop loss, break evens, positions, signals, indicators, etc.
You will find the settings for risk management at the end of the script if you want to change something. But rebember, do not change values from indicators, the idea is to not over optimize the strategy.
If you want to change the initial capital for backtest the strategy, go to properties, and also enter the commisions of your exchange and slippage for more realistic results.
In risk managment you can find an option called "Use leverage ?", activate this if you want to backtest using leverage, which means that in case of not having enough money for risking the % determined by you of your account using your initial capital, you will use leverage for using the enough amount for risking that % of your acount in a buy position. Otherwise, the amount will be limited by your initial/current capital
---> Do not forget to deactivate Trades on chart option in style settings for a cleaner look of the chart <---
Some things to consider
USE UNDER YOUR OWN RISK. PAST RESULTS DO NOT REPRESENT THE FUTURE.
DEPENDING OF % ACCOUNT RISK PER TRADE, YOU COULD REQUIRE LEVERAGE FOR OPEN SOME POSITIONS, SO PLEASE, BE CAREFULL AND USE CORRECTLY THE RISK MANAGEMENT
Do not forget to change commissions and other parameters related with back testing results!
Strategies for trending markets use to have more looses than wins and it takes a long time to get profits, so do not forget to be patient and consistent !
---> The strategy can still be improved, you can change some parameters depending of the asset and timeframe like risk/reward for taking profits, for break even, also the main parameters of the UT Bot Alerts <----

Double Alligator x Donchian Cloud StrategyThis strategy is based on two sets of Williams Alligator indicators, taking crossovers and crossunders of the two pairs of lips as the main entry signal with confluence from the Donchian Cloud. The first Alligator used is set to the standard 13/8/5 lengths found in the standard indicator. The second Alligator is multiplied tenfold (10x) to 130/80/50 with the offset values also being multiplied. This second set is colored yellow, aqua, and purple for the jaw, teeth, and lips, respectively. A strategy similar to a moving average crossover can be created using these sets of Alligator indicators. While there are 6 lines in total, and can be used for discretionary matters outside of the strategy entry/exits, a cross of the lip pairs seems to yield the most optimal results. As a filter for these signals, we have introduced our Donchian Cloud Score code.
The Donchian Cloud Score is derived from a set of 5 Donchian channels (upper, lower, and basis plotted) defaulted to lengths of 25, 50, 100, 150, and 200. A set of conditions associated with the channels aims to determine ranging versus trending markets. Weights are given to these conditions accordingly, then tallied up to determine the "cloud score", ranging between -25 and 25. In general, a ranging market is determined by a cloud score between -10 and 10, while a positive trending market has a score higher than 10 and a negative trending market has a score lower than -10. That said, long and short thresholds similar to the macro score itself are included in the user settings and set to a default of 3 or -3. Trade frequency will increase the closer these numbers are to zero, however, the stronger (yet infrequent) signals come with values approaching +/- 10 or greater. The cloud score is plotted as a line in the underlay with coloration reflecting ranging or trending markets (green color above the long threshold, gray between the thresholds, and red below the short threshold). The cloud score is incorporated into the strategy syntax for long and short positions in that the score must be above or below the set threshold for a trade to be placed. A breakdown for the Donchian scoring is as follows:
- Broke the 25-length DC (DC(25)) upper band in the previous 3 bars - +1 if true, 0 if false
- Broke the DC(50) upper band in the previous 3 bars - +2 if true, 0 if false
- Broke the DC(100) upper band in the previous 3 bars - +3 if true, 0 if false
- Broke the DC(150) upper band in the previous 3 bars - +4 if true, 0 if false
- Broke the DC(200) upper band in the previous 3 bars - +5 if true, 0 if false
- Broke the DC(25) lower band in the previous 3 bars - -1 if true, 0 if false
- Broke the DC(50) lower band in the previous 3 bars - -2 if true, 0 if false
- Broke the DC(100) lower band in the previous 3 bars - -3 if true, 0 if false
- Broke the DC(150) lower band in the previous 3 bars - -4 if true, 0 if false
- Broke the DC(200) lower band in the previous 3 bars - -5 if true, 0 if false
- DC(25) basis line above the DC(50) basis line - +1 if true, -1 if false
- DC(25) basis line above the DC(100) basis line - +1 if true, -1 if false
- DC(25)basis line above the DC(150) basis line - +1 if true, -1 if false
- DC(25) basis line above the DC(200) basis line - +1 if true, -1 if false
- DC(50) basis line above the DC(100) basis line - +1 if true, -1 if false
- DC(50) basis line above the DC(150) basis line - +1 if true, -1 if false
- DC(50) basis line above the DC(200) basis line - +1 if true, -1 if false
- DC(100) basis line above the DC(150) basis line - +1 if true, -1 if false
- DC(100) basis line above the DC(200) basis line - +1 if true, -1 if false
- DC(150) basis line above the DC(200) basis line - +1 if true, -1 if false
Take profit, stop loss, and trailing percentages are also included, found at the bottom of the Input tab under “TT and TTP” as well as “Stop Loss”. Make sure to understand the TP/SL ratio that you desire before use, as the desired hit rate/profitability percentage will be affected accordingly. The option for adding in a trailing stop has also been included, with options to choose between an ATR-based trail or a percentage-based trail. This strategy does NOT guarantee future returns. Apply caution in trading regardless of discretionary or algorithmic. Understand the concepts of risk/reward and the intricacies of each strategy choice before utilizing them in your personal trading.
Profitview/Pineconnector Settings:
If you wish to utilize Profitview’s automation system, find the included “Profitview Settings” under the Input tab of the strategy settings menu. If not, skip this section entirely as it can be left blank. Options will be “OPEN LONG TITLE”, “OPEN SHORT TITLE”, “CLOSE LONG TITLE”, and “CLOSE SHORT TITLE”. If you wished to trade SOL, for example, you would put “SOL LONG”, “SOL SHORT”, “SOL CLOSE LONG”, and “SOL CLOSE SHORT” in these areas. Within your Profitview extension, ensure that your Alerts all match these titles. To set an alert for use with Profitview, go to the “Alerts” tab in TradingView, then create an alert. Make sure that your desired asset and timeframe are currently displayed on your screen when creating the alert. Under the “Condition” option of the alert, select the strategy, then select the expiration time. If using TradingView Premium, this can be open-ended. Otherwise, select your desired expiration time and date. This can be updated whenever desired to ensure the strategy does not expire. Under “Alert actions”, nothing necessarily needs to be selected unless so desired. Leave the “Alert name” option empty. For the “Message”, delete the generated message and replace it with {{strategy.order.alert_message}} and nothing else. If using Pineconnector, follow the same directions for setting up an alert, but use the ",buy,,risk=" syntax as noted in the tooltips.
Self Optimizing MACD [Starbots]Self Optimizing MACD Strategy. (non-repainting)
Script constantly tests 15 MACD combinations for maximum profitability and trades based on the best performing combination.
You will notice that signal lines switch sometimes, this is when the strategy optimizes to the better combination and change plots, strategy is dynamic.
There are a lot of black - shadow lines, this are the signals that are not currently active, but script keeps checking and valuating every one of them on every bar close. I recommend using dark mode chart for better view.
MACD /Signal lines in Blue/ Orange are the best performing combination and active at the moment.
*Histogram bars are always displayed based on the default MACD setting (12,26,9) - to keep the script running fast and smoothly. It's not changing plots unlike MACD /Signal lines.
-Turn on MACD Profit Dashboard and spot the worst performing combination to change it and get the better performance overall.
-Backtesting Range - backtest within your desired time window. Example: 'from 01/01/2020 to 01/01/2023'
-Optimizing range - you can decrease the amount of bars/data for optimizing script. This way you can keep it up to date to more recent market by selecting optimizing range to optimize it just from the recent 3-6months of data for example. Strategy before this selected range will normally trade (backtest) based on the first MACD parameters in your menu (12,26,9 by default) if you turn this on.
*I recommend 'Optimizing Range' turned off actually, use max amount of available bars in your history for optimization
- Strategy is trading on the bar close without repaint. You can trade Long-Sell or Long- Short. Alerts available.
- Turn on Profit Calendar for better overview of how your strategy performs monthly/annualy
- Recommended Sources : close, hl2 , hlc3, hlcc4 (when scalping/day trading and market is uptrending good, you can use 'volume' as a source, comes in handy)
- Recommended TF : 30s, 3min, 5min, 10min, 1h, 2h, 4h, 8h, 1d (low timeframes works good if you have no fees like Binance currently do on BTC for example otherwise you probably want to use 1h+ chart)
- MACD parameters : pre-set MACD combinations are very good and common in trading world, you don't need to change them, but you can do it at free will
- Notes window : add your custom comments in or save your webhook message text inside here for later use.
- Trading Session: in a session, you have to specify the time range for every day. It will trade only within this window and close trades when it's out. Session from 9am to 5pm will look like that: 0900-1700 or 7am to 4:30pm 0700-1630. After the colon, you can specify days of the week for your trading session. 1234567 trading all days, 23456 – Monday to Friday ('1 is Sunday here'). 0000-0000:1234567 by default will trade every day nonstop. 00.00am to 00.00pm and 1234567 every day of the week for example - Cryptocurrencies.
This script is simple to use for any trader as it saves a lot of time for searching good parameters on your own. It's also self-optimizing and adjusting to the markets on the go.

Macro Score (DFMA) and Donchian Cloud Score StrategyA "macro score", as defined here, is created by giving various weights to different signals and adding them together to get one smooth score. Positive or negative values are assigned to each of the signals depending on if the statement is true or false (e.g. DPO > 0: +1, DPO < 0: -1). This manner of strategy allows for a subset of the available signals to be present at one time as opposed to every technical signal having to be active in order for a long/short signal to trigger.
The DFMA - Democratic Fibonacci Moving Average - is a separate indicator that we have released that takes 10 different Fibonacci MAs (lengths of 3 to 233, at Fibonacci intervals) and averages them to form the DFMA line. This helps by creating a consensus on the trend based on moving averages alone. Crossovers of the DFMA with the various Fib MA lengths as well as a cross of the price source and these lines can provide adequate long and short signals.
This strategy has the signals and weights pre-determined in the code. Heaviest weights have been given to crosses of the DFMA line/Fib MA (233) as well as the crosses of the Fib MA (3)/DFMA. Additionally, there are thresholds for DPO ( Detrended Price Oscillator , above or below 0), CMO ( Chande Momentum Oscillator , above or below 0), Jurik Volatility Bands (above or below 0), and Stoch RSI (above or below 50). These four signals hold a lighter weight than the MA cross signals.
The macro score itself is printed in an underlay as a white line that goes between -10 and 10 for this strategy. In addition to the macro score line, a blue momentum line (sourced by the macro score itself) has been included. A crossover/crossunder of the macro score and the macro momentum line is included into the long/short signal syntax in addition to a threshold for the macro score. Long and short thresholds can be determined by the user in the settings menu.
The Donchian Cloud Score is derived from a set of 5 Donchian channels (upper, lower, and basis plotted) defaulted to lengths of 25, 50, 100, 150, and 200. A set of conditions associated with the channels aims to determine ranging versus trending markets. Weights are given to these conditions accordingly, then tallied up to determine the "cloud score", ranging between -25 and 25. In general, a ranging market is determined by a cloud score between -10 and 10, while a positive trending market has a score higher than 10 and a negative trending market has a score lower than -10. That said, long and short thresholds similar to the macro score itself are included in the user settings and set to a default of 5 or -5. The cloud score is plotted as a line in the underlay with coloration reflecting ranging or trending markets (green color above the long threshold, gray between the thresholds, and red below the short threshold). The cloud score is incorporated into the strategy syntax for long and short positions in that the score must be above or below the set threshold for a trade to be placed. A breakdown for the Donchian scoring is as follows:
- Broke the 25-length DC (DC(25)) upper band in the previous 3 bars - +1 if true, 0 if false
- Broke the DC(50) upper band in the previous 3 bars - +2 if true, 0 if false
- Broke the DC(100) upper band in the previous 3 bars - +3 if true, 0 if false
- Broke the DC(150) upper band in the previous 3 bars - +4 if true, 0 if false
- Broke the DC(200) upper band in the previous 3 bars - +5 if true, 0 if false
- Broke the DC(25) lower band in the previous 3 bars - -1 if true, 0 if false
- Broke the DC(50) lower band in the previous 3 bars - -2 if true, 0 if false
- Broke the DC(100) lower band in the previous 3 bars - -3 if true, 0 if false
- Broke the DC(150) lower band in the previous 3 bars - -4 if true, 0 if false
- Broke the DC(200) lower band in the previous 3 bars - -5 if true, 0 if false
- DC(25) basis line above the DC(50) basis line - +1 if true, -1 if false
- DC(25) basis line above the DC(100) basis line - +1 if true, -1 if false
- DC(25)basis line above the DC(150) basis line - +1 if true, -1 if false
- DC(25) basis line above the DC(200) basis line - +1 if true, -1 if false
- DC(50) basis line above the DC(100) basis line - +1 if true, -1 if false
- DC(50) basis line above the DC(150) basis line - +1 if true, -1 if false
- DC(50) basis line above the DC(200) basis line - +1 if true, -1 if false
- DC(100) basis line above the DC(150) basis line - +1 if true, -1 if false
- DC(100) basis line above the DC(200) basis line - +1 if true, -1 if false
- DC(150) basis line above the DC(200) basis line - +1 if true, -1 if false
Take profit, stop loss, and trailing percentages are also included, found at the bottom of the Input tab under “TT and TTP” as well as “Stop Loss”. Make sure to understand the TP/SL ratio that you desire before use, as the desired hit rate/profitability percentage will be affected accordingly. The option for adding in a trailing stop has also been included, with options to choose between an ATR-based trail or a percentage-based trail. This strategy does NOT guarantee future returns. Apply caution in trading regardless of discretionary or algorithmic. Understand the concepts of risk/reward and the intricacies of each strategy choice before utilizing them in your personal trading.
Profitview/Pineconnector Settings:
If you wish to utilize Profitview’s automation system, find the included “Profitview Settings” under the Input tab of the strategy settings menu. If not, skip this section entirely as it can be left blank. Options will be “OPEN LONG TITLE”, “OPEN SHORT TITLE”, “CLOSE LONG TITLE”, and “CLOSE SHORT TITLE”. If you wished to trade SOL, for example, you would put “SOL LONG”, “SOL SHORT”, “SOL CLOSE LONG”, and “SOL CLOSE SHORT” in these areas. Within your Profitview extension, ensure that your Alerts all match these titles. To set an alert for use with Profitview, go to the “Alerts” tab in TradingView, then create an alert. Make sure that your desired asset and timeframe are currently displayed on your screen when creating the alert. Under the “Condition” option of the alert, select the strategy, then select the expiration time. If using TradingView Premium, this can be open-ended. Otherwise, select your desired expiration time and date. This can be updated whenever desired to ensure the strategy does not expire. Under “Alert actions”, nothing necessarily needs to be selected unless so desired. Leave the “Alert name” option empty. For the “Message”, delete the generated message and replace it with {{strategy.order.alert_message}} and nothing else. If using Pineconnector, follow the same directions for setting up an alert, but use the ",buy,,risk=" syntax as noted in the tooltips.

Ema ScalpThis is another simple strategy based on ema
Entry Buy - 1) when close crossover ema then buy and only open one trade till it not close
2) if previous buy trade is profitable open another trade and check again trade is profitable or not
3)if trade is not profitable reset and wait for sell condition...
Entry Sell -1) when close crossunder ema then sell and only open one trade till it not close
2) if previous sell trade is profitable open another trade and check again trade is profitable or not
3) if trade is not profitable reset and wait for buy condition.....
stop loss and take profit is percentage based ...

Macro Score - Dem. Fib. McGinley DynamicsA "macro score", as defined here, is created by giving various weights to different signals and adding them together to get one smooth score. Positive or negative values are assigned to each of the signals depending on if the statement is true or false (e.g. DPO > 0: +1, DPO < 0: -1). This manner of strategy allows for a subset of the available signals to be present at one time as opposed to every technical signal having to be active in order for a long/short signal to trigger.
The DFMG - Democratic Fibonacci McGinley Dynamic - is a separate indicator that we have released that takes 10 different Fibonacci McGinley Dynamics (lengths of 3 to 233, at Fibonacci intervals) and averages them to form the DFMG line. This helps by creating a consensus on the trend based on these dynamic lines alone. Crossovers of the DFMG with the various McGinley lengths as well as a cross of the price source and these lines can provide adequate long and short signals.
This strategy has the signals and weights pre-determined in the code. Heaviest weights have been given to crosses of the DFMG line/McGinley(233) as well as the crosses of the McGinley(3)/DFMG. Additionally, there are thresholds for DPO ( Detrended Price Oscillator , above or below 0), CMO ( Chande Momentum Oscillator , above or below 0), Jurik Volatility Bands (above or below 0), and Stoch RSI (above or below 50). These four signals hold a lighter weight than the McGinley cross signals.
The macro score itself is printed in an underlay as a white line that goes between -10 and 10 for this strategy. In addition to the macro score line, a green momentum line (sourced by the macro score itself) has been included. A crossover/crossunder of the macro score and the macro momentum line is included into the long/short signal syntax in addition to long and short thresholds for the macro score, defaulted to 5 and -5 respectively.
Take profit, stop loss, and trailing percentages are also included, found at the bottom of the Input tab under “TT and TTP” as well as “Stop Loss”. Make sure to understand the TP/SL ratio that you desire before use, as the desired hit rate/profitability percentage will be affected accordingly. The option for adding in a trailing stop has also been included, with options to choose between an ATR-based trail or a percentage-based trail.
This strategy does NOT guarantee future returns. Apply caution in trading regardless of discretionary or algorithmic. Understand the concepts of risk/reward and the intricacies of each strategy choice before utilizing them in your personal trading.
Profitview/Pineconnector Settings:
If you wish to utilize Profitview’s automation system, find the included “Profitview Settings” under the Input tab of the strategy settings menu. If not, skip this section entirely as it can be left blank. Options will be “OPEN LONG TITLE”, “OPEN SHORT TITLE”, “CLOSE LONG TITLE”, and “CLOSE SHORT TITLE”. If you wished to trade SOL, for example, you would put “SOL LONG”, “SOL SHORT”, “SOL CLOSE LONG”, and “SOL CLOSE SHORT” in these areas. Within your Profitview extension, ensure that your Alerts all match these titles. To set an alert for use with Profitview, go to the “Alerts” tab in TradingView, then create an alert. Make sure that your desired asset and timeframe are currently displayed on your screen when creating the alert. Under the “Condition” option of the alert, select the strategy, then select the expiration time. If using TradingView Premium, this can be open-ended. Otherwise, select your desired expiration time and date. This can be updated whenever desired to ensure the strategy does not expire. Under “Alert actions”, nothing necessarily needs to be selected unless so desired. Leave the “Alert name” option empty. For the “Message”, delete the generated message and replace it with {{strategy.order.alert_message}} and nothing else. If using Pineconnector, follow the same directions for setting up an alert, but use the " ,buy, ,risk=" syntax as noted in the tooltips.
Default Properties for AVAX 20M:
DPO - 35 , uncentered
CMO - 25, open
K/D - 3/3
RSI Stoch Length - 3
Stoch Length - 4
Stoch Source - open
JVB Length - 14
JVB Smoothing - 2
DFMG source - close
Macro Length - 14
TP % - 1.5%
TTP % - 0.005%
SL % - 1.8%, no trail

GAVAD - Selling after a Strong MovimentThis strategy search for a moment whe the market make two candles are consistently strong, and open a Sell, searching the imediactly correction, on the new candle. It`s easy to see the bars on the histogram graph. Purple Bars represent the candle variation. when on candle cross ove the Signal line the graph plot an Yellow ci, if the second bar crossover the signal a green circle is ploted and the operation start on start of the next candle.
This strategy can be used in a lot of Stocks and other graphs. many times we need a small time of graph, maybe 1 or 5 minutes because the gain shoud be planned to a midle of the second candle. You need look the stocks you will use.
Stocks > 100 dolars isnt great, markets extremly volatly not too. but, Stocks that have a consistently development are very interisting. Look to markets searching maybe 0.5% or 1%.
For this moment, I make the development of a Brasilian Real x American Dollar. In 15 Minutes.
if you use in small timeframe the results can be better.
On this time we make more than 500 trades with a small lot of contracts, without a big percent profitable, but a small profit in each operation, maybe you search more than. To present a real trading system I insert a spreed to present a correct view of the results.
Each stock, Index, or crypto there is a specific configuration?
my suggestion for new stocks
You need choice a stock and using the setup search set over than 70% gain (percent profitable), using a 1% of gain and loss between 1-2%
as the exemple (WDO)
default I prepare a Brazilian Index
6-signal (6% is variation of a candle of the last candle)
10000- multiplicator (its important to configure diferences betwen a stock and an Indice)
gain 3 (this proportion will be set looking you target, how I say, 1% can be good)
loss 8 (this proportion will be set with you bankroll management, how I say, maybe 2%, you need evaluate)
for maximize operations I use in the 1 or 5 minute graph. Timeframes more large make slowlly results,
(but not unable that you use in a 1 hour or a 1 day.)
I make this script by zero. Maybe the code doesnt so organized, but is very easy to understand. If you have any doubts . leave a comment.
I hope help you.

TradePro's 2 EMA + Stoch RSI + ATR StrategySaw TradePro's "NEW BEST HIGHEST PROFITING STRATEGY WITH CRAZY RESULTS - 2 EMA+ Stochastic RSI+ ATR", and was curious on the back testing results. This strategy is an attempt to recreate it.
This strategy uses 50 / 200 EMAs, Stochastic RSI and ATR.
Long Entry Criteria:
- 50 EMA > 200 EMA
- Price closes below 50 EMA
- Stochastic RSI has gone into oversold < 20
- Stochastic RSI crosses up while making higher low from previous cross up
Short Entry Criteria:
- 50 EMA < 200 EMA
- Price closes above 50 EMA
- Stochastic RSI has gone into overbought > 80
- Stochastic RSI crosses down while making lower high from previous cross down
Stop-loss is set to ATR stop-loss
Take Profit is 2x the risk
All parameters are configurable.
Enjoy~~

Macro Score - DFMA-BasedA "macro score", as defined here, is created by giving various weights to different signals and adding them together to get one smooth score. Positive or negative values are assigned to each of the signals depending on if the statement is true or false (e.g. DPO > 0: +1, DPO < 0: -1). This manner of strategy allows for a subset of the available signals to be present at one time as opposed to every technical signal having to be active in order for a long/short signal to trigger.
The DFMA - Democratic Fibonacci Moving Average - is a separate indicator that we have released that takes 10 different Fibonacci MAs (lengths of 3 to 233, at Fibonacci intervals) and averages them to form the DFMA line. This helps by creating a consensus on the trend based on moving averages alone. Crossovers of the DFMA with the various Fib MA lengths as well as a cross of the price source and these lines can provide adequate long and short signals.
This strategy has the signals and weights pre-determined in the code. Heaviest weights have been given to crosses of the DFMA line/Fib MA (233) as well as the crosses of the Fib MA (3)/DFMA. Additionally, there are thresholds for DPO ( Detrended Price Oscillator , above or below 0), CMO ( Chande Momentum Oscillator , above or below 0), Jurik Volatility Bands (above or below 0), and Stoch RSI (above or below 50). These foursignals hold a lighter weight than the MA cross signals.
The macro score itself is printed in an underlay as a white line that goes between -10 and 10 for this strategy. In addition to the macro score line, a blue momentum line (sourced by the macro score itself) has been included. A crossover/crossunder of the macro score and the macro momentum line is included into the long/short signal syntax in addition to a threshold for the macro score (-5/5).
Take profit, stop loss, and trailing percentages are also included, found at the bottom of the Input tab under “TT and TTP” as well as “Stop Loss”. Make sure to understand the TP/SL ratio that you desire before use, as the desired hit rate/profitability percentage will be affected accordingly. This strategy does NOT guarantee future returns. Apply caution in trading regardless of discretionary or algorithmic. Understand the concepts of risk/reward and the intricacies of each strategy choice before utilizing them in your personal trading.
Profitview Settings:
If you wish to utilize Profitview’s automation system, find the included “Profitview Settings” under the Input tab of the strategy settings menu. If not, skip this section entirely as it can be left blank. Options will be “OPEN LONG TITLE”, “OPEN SHORT TITLE”, “CLOSE LONG TITLE”, and “CLOSE SHORT TITLE”. If you wished to trade SOL, for example, you would put “SOL LONG”, “SOL SHORT”, “SOL CLOSE LONG”, and “SOL CLOSE SHORT” in these areas. Within your Profitview extension, ensure that your Alerts all match these titles. To set an alert for use with Profitview, go to the “Alerts” tab in TradingView, then create an alert. Make sure that your desired asset and timeframe are currently displayed on your screen when creating the alert. Under the “Condition” option of the alert, select the strategy, then select the expiration time. If using TradingView Premium, this can be open-ended. Otherwise, select your desired expiration time and date. This can be updated whenever desired to ensure the strategy does not expire. Under “Alert actions”, nothing necessarily needs to be selected unless so desired. Leave the “Alert name” option empty. For the “Message”, delete the generated message and replace it with {{strategy.order.alert_message}} and nothing else.
Default Properties, for AVAX 20M:
DPO - 40, uncentered
CMO - 25, open
K/D - 3/3
RSI Stoch Length - 3
Stoch Length - 4
Stoch Source - open
JVB Length - 25
JVB Smoothing - 2
DFMA source - close
Macro Length - 13
TP % - 1.5%
TTP % - 0.005%
SL % - 2%
