ProfitTrailer v2 EMAGAIN & RSI Buy SignalsUse this script to tweak and visualize your ProfitTrailer v2 EMAGAIN + RSI buy strategy. The indicator will show you when the bot will buy based on your inputs.
Inputs Available
- Fast & Slow EMA
- Buy value (0 to -10)
- Enable/Disable Buy Signals
- Enable/Disable RSI
- Set RSI Values
With this indicator you will see what a big difference RSI makes as supposed to just using EMAGAIN. I will incorporate sell signals shortly. Comments and suggestions welcome.
Cari dalam skrip untuk "profit"

Profitable Loser Model [MMT]Profitable Loser Model
Overview
The Profitable Loser Model is a powerful PineScript v6 indicator designed to enhance your trading by visualizing key price levels, session open zones, Fibonacci retracements, and premium/discount zones. This overlay indicator provides traders with a customizable toolkit to analyze market structure across any timeframe, making it ideal for intraday and swing trading strategies.
Features
Open Zone Visualization
- Plots a box based on the open and close of the first candle in a user-defined timeframe (default: 5-minute).
- Customizable box color, projection offset, and label size (Tiny, Small, Normal, Large).
- Displays a timeframe label (e.g., "5m Open Zone") for quick reference, toggleable on/off.
Session Open Lines
- Optionally draws horizontal lines at key session opens (8:30 AM, 9:30 AM, 1:30 PM, Midnight, New York time).
- Customize line color, style (Solid, Dashed, Dotted), width, and label size for each session.
- Perfect for identifying critical intraday price levels.
Premium and Discount Zones
- Highlights premium (above midpoint) and discount (below midpoint) zones based on session high/low.
- Toggleable with customizable colors and projection offsets.
- Helps traders spot overbought/oversold areas for potential mean-reversion trades.
Fibonacci Retracement Levels
- Plots user-defined Fibonacci levels (default: 0.23, 0.35, 0.5, 0.62, 0.705, 0.79, 0.886, 1, 1.1).
- Customizable line style, width, color, and labels (showing percentage and/or price).
- Dynamically adjusts based on price movement relative to the open zone.
Take Profit (TP) and Stop Loss (SL) Levels
- Highlights TP (default: 0.23) and SL (default: 1.1) Fibonacci levels with distinct colors.
- Fully customizable to align with your risk-reward strategy.
How It Works
- Session Detection : Resets daily (or per user-defined timeframe) to capture the first candle's open, high, low, and close.
- Open Zone : Draws a box between the open and close, extended forward by the projection offset.
- Session Lines : Plots lines at specified session opens with customizable styles and labels.
- Fibonacci Retracement : Adjusts levels dynamically based on session high/low and price action.
- Premium/Discount Zones : Calculated from the session range midpoint, updated in real-time.
Settings
- Open Zone :
- Timeframe (default: 5m), Calculate Timeframe (default: Daily).
- Toggle label, adjust size, box color, and projection offset.
- Session Open Lines :
- Enable/disable lines for 8:30 AM, 9:30 AM, 1:30 PM, Midnight.
- Customize color, style, width, label size, and vertical offset.
- Premium/Discount Zones :
- Toggle visibility, set colors, and adjust projection offset.
- Fibonacci Retracement :
- Toggle visibility, set custom levels, line style, width, color, and label options.
- Adjust projection offset.
- TP/SL :
- Set TP/SL Fibonacci levels and colors.
Use Cases
- Intraday Trading : Use session open lines and open zones to trade key market hours.
- Swing Trading : Leverage Fibonacci levels for potential reversal or continuation zones.
- Risk Management : Set precise TP/SL levels based on Fibonacci retracements.
- Market Structure : Identify overbought/oversold zones with premium/discount areas.
Notes
- Optimized with `dynamic_requests = true` for efficient real-time data handling.
- Visual elements (boxes, lines, labels) are cleaned up at the start of each new session.
- Session lines use New York time (`America/New_York`) for alignment with major markets.

Profitable Moving Average CrossoverHi everyone!
Introduction
A popular use for moving averages is to develop simple trading systems based on moving average crossovers. A trading system using two moving averages would give a buy signal when the shorter (faster) moving average advances above the longer (slower) moving average. A sell signal would be given when the shorter moving average crosses below the longer moving average. The speed of the systems and the number of signals generated will depend on the length of the moving averages.
There are many types of averages that are based on different techniques. Each type has its drawbacks and merits. And if we decide to choose a certain type of average for the trading system, then how do we know that our choice is optimal?
What is this tool?
This tool will help you to choose this type to create the most profitable trading system based on crossovers for the specified periods. It backtests pairs of each type throughout the whole instrument's history and shows Net Profit curves as a result. So, the type of the most profitable crossover system will be at the top of list of labels on the chart. (Click on the price scale, point to "Labels" and switch off "No Overlapping Labels" option).
Settings
The main settings are periods for each type pair of fast and slow moving averages.
Additionally, it allows to customize some multi-parametric moving averages such as JMA, ALMA, McGinley Dynamic, Adaptive Laguerre Filter etc.
1st Period (default: 14 )
2nd Period (default: 50 )
1st ALF Median Length (default: 5 )
2nd ALF Median Length (default: 5 )
1st ALMA Offset (default: 0.85 )
1st ALMA Sigma (default: 6 )
2nd ALMA Offset (default: 0.85 )
2nd ALMA Sigma (default: 6 )
1st HF Scaling Factor (default: 3 )
2nd HF Scaling Factor (default: 3 )
1st JMA Phase (default: 50 )
2nd JMA Phase (default: 50 )
1st MD Constant (default: 0.6 )
2nd MD Constant (default: 0.6 )
1st MHLMA Range (default: 10 )
2nd MHLMA Range (default: 10 )
1st PWMA Power (default: 2 )
2nd PWMA Power (default: 2 )
1st REMA Lambda (default: 0.5 )
2nd REMA Lambda (default: 0.5 )
1st RMF Median Length (default: 5 )
2nd RMF Median Length (default: 5 )
1st T3 Alpha (default: 0.7 )
2nd T3 Alpha (default: 0.7 )
MAMA & FAMA Fast Limit (default: 0.5 )
MAMA & FAMA Slow Limit (default: 0.05 )
Supported types of averages and filters (use short titles to match averages on the chart)
AHMA , Ahrens MA (by Richard D. Ahrens)
ALMA , Arnaud Legoux MA (by Arnaud Legoux and Dimitris Kouzis-Loukas)
ALF , Adaptive Laguerre Filter (by John F. Ehlers)
ARSI , Adaptive RSI
BF2 , Butterworth Filter with 2 poles
BF3 , Butterworth Filter with 3 poles
DEMA , Double Exponential MA (by Patrick G. Mulloy)
DWMA , Double Weighted (Linear) MA
EDCF , Ehlers Distance Coefficient Filter (by John F. Ehlers)
EHMA , Exponential Hull MA
EMA , Exponential MA
EVWMA , Elastic Volume Weighted MA (by Christian P. Fries)
FRAMA , Fractal Adaptive MA (by John F. Ehlers)
GF1 , Gaussian Filter with 1 pole
GF2 , Gaussian Filter with 2 poles
GF3 , Gaussian Filter with 3 poles
GF4 , Gaussian Filter with 4 poles
HFSMA , Hampel Filter on Simple Moving Average
HFEMA , Hampel Filter on Exponential Moving Average
HMA , Hull MA (by Alan Hull)
HWMA , Henderson Weighted MA (by Robert Henderson)
IDWMA , Inverse Distance Weighted MA
IIRF , Infinite Impulse Response Filter (by John F. Ehlers)
JMA , Jurik MA (by Mark Jurik, )
LF , Laguerre Filter (by John F. Ehlers)
LMA , Leo MA (by ProRealCode' user Leo)
LSMA , Least Squares MA (Moving Linear Regression)
MAMA & FAMA , (by John F. Ehlers, special case that used as a benchmark)
MD , McGinley Dynamic (by John R. McGinley)
MHLMA , Middle-High-Low MA (by Vitali Apirine)
PWMA , Parabolic Weighted MA
REMA , Regularized Exponential MA (by Chris Satchwell)
RMA , Running MA (by J. Welles Wilder)
RMF , Recursive Median Filter (by John F. Ehlers)
RMTA , Recursive Moving Trend Average (by Dennis Meyers)
SHMMA , Sharp Modified MA (by Joe Sharp)
SMA , Simple MA
SSF2 , Super Smoother Filter with 2 poles (by John F. Ehlers)
SSF3 , Super Smoother Filter with 3 poles (by John F. Ehlers)
SWMA , Sine Weighted MA
TEMA , Triple Exponential MA (by Patrick G. Mulloy)
TMA , Triangular MA (generalized by John F. Ehlers)
T3 , (by Tim Tillson)
VIDYA , Variable Index Dynamic Average (by Tushar S. Chande)
VWMA , Volume Weighted MA (by Buff P. Dormeier)
WMA , Weighted (Linear) MA
ZLEMA , Zero Lag Exponential MA (by John F. Ehlers and Ric Way)
NOTE : The results may vary on different tickers and timeframes.
If you see the preview result it doesn't mean that these crossovers will be profitable on other instruments and timeframes. This is a normal situation because time series and their characteristics differ.
I know that because I tested this tool before publishing.
NOTE 2 : You can use this tool by yourself and experiment with it, or you can order a study and I will share the spreadsheet that contains results with you.
Good luck!

PT 2.0 RSI + LOWBB + EMAGAINProfit Trailer 2 RSI, LOWBB, EMAGAIN strategy for spotting better buys. Will be adding STOCH soon.
Please leave a PM for suggestions.

Profitability IndexDisplays the percent difference from the outer Bollinger Band to the middle Bollinger Band, in addition to the Simple Moving Average of the Profitability Index itself.
Grants the trader the ability to quickly ascertain the instrument's profitability based on its current and recent percentage of movement.
Profit booking Indicatorell signal when RSI < 40, MACD crosses zero or signal line downward in negative zone, close below 50 EMA, candle bearish.
Strong sell signal confirmed on 5-minute higher timeframe with same conditions.
Square off half/full signals as defined.
Target lines drawn bold based on previous swing lows and extended as described.
Blue candle color when RSI below 30.
One sell and one full square off per cycle, blocking repeated sells until full square off.

Profitable Mondays & Losing FridaysHere's a Pine Script that marks profitable Mondays and losing Fridays for a given stock:
Explanation
Input Parameter: The script allows you to input the stock symbol, defaulting to SPX.
Daily Returns: It calculates the daily return based on the closing price.
Day Identification: It checks if the current day is Monday or Friday.
Conditions:
Profitable Mondays: Marks with a green background if Monday's return is positive.
Losing Fridays: Marks with a red background if Friday's return is negative.
Visualization: Uses bgcolor to highlight the respective days on the chart.
You can adjust the stockSymbol input to analyze different stocks.
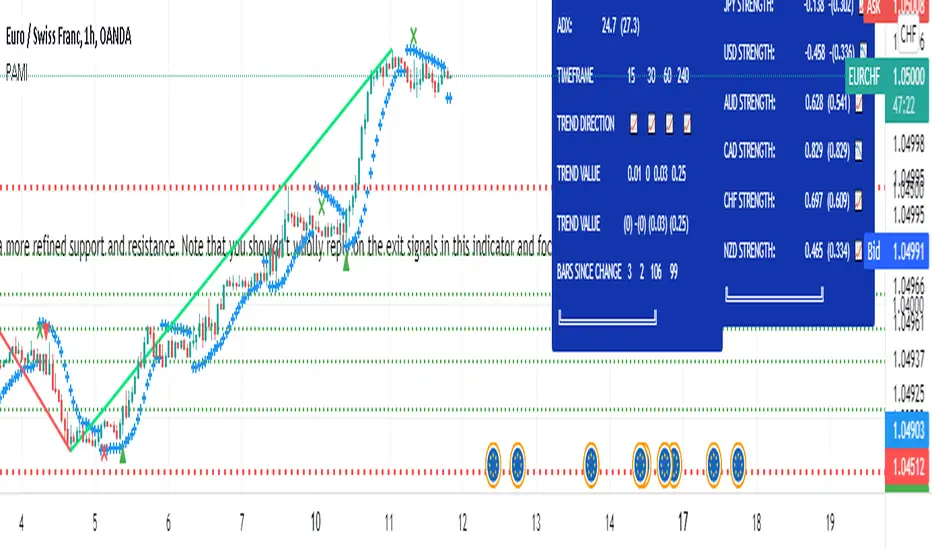
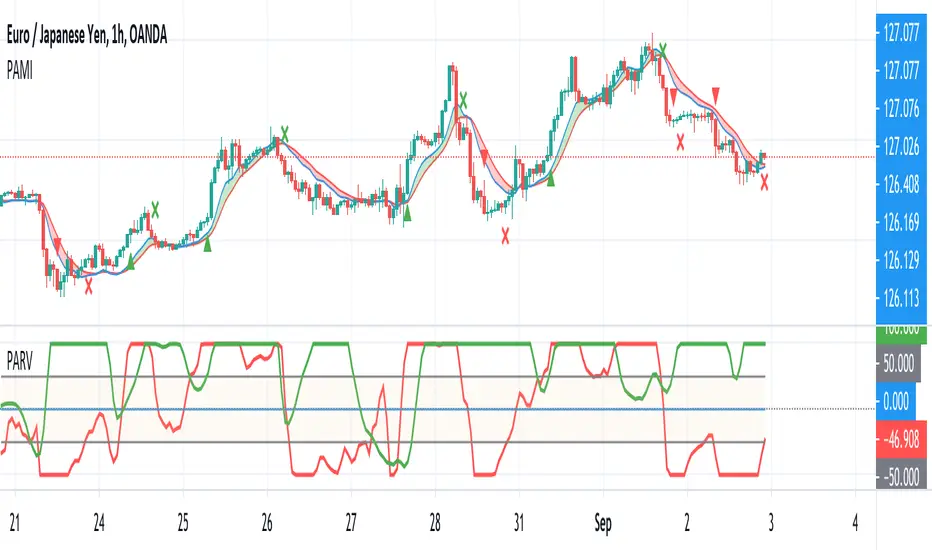
Profit Accumulator Main IndicatorMAIN INDICATOR (PAMI)
I've been using this indicator for several months now and allowed me to make some good profits as a result of this. I use this indicator in conjuntion with a number of others to allow me to make an informed decision on which trades to take and which are false signals.
The main indicator uses a number of methods including trend, momentum, volatility and volume to identify entry points into the market and exit points. The exit points are an estimate and your own target profit levels should also be used.
The following keys are used on the chart:
Green Up Arrow: Long Entry
Green Cross: Long Exit
Red Down Arrow: Short Entry
Red Cross: Short Exit
The main indicator is set up with custom alerts for when a long or short entry and exit signal is triggered.
I've been using this successfully on the one hour FX charts, but seems to work equally as well on higher or lower time frames (not less than 15min).
The main indicator has a number of tools in the settings that can be used to assist with trading. This includes
Bollinger Bands
Current Moving Averages
Multi-Timeframe Moving Averages
Chandelier Exits.
The chart is shown with the Bollinger Band overlay.
The other indicators which are part of the suite are shown on the website which is highlighted in my signature at the bottom of the page. Purchase of the main indicator gives access to the full suite of eight indicators. I use the other indicators to confirm the direction of the trade and to determine if I want to trade or not. I use it along with the 2min, 15min and 4hr timeframes to identify the best entry window and how long I'm likely to be in the trade.
Support can be provided via private message or in the comments below.
The links are provided below for access to the indicator.
9 Seasons Rainbow Multiple Time Frames Pattern DEMO [9SRDEN]The indicator discovers profitable patterns by associating Price Season of multiple time frames.
Full Name: 9 Seasons Rainbow - Multiple Time Frames Associated Price Wave Pattern Indicator
This is redefined from “9 Seasons Rainbow Indicator DEMO”, with clearer definition of 9 Seasons and user manual.
Version: DEMO
Language: English
Copyright: 2019
---------- How to use the indicator ----------
Go through the manual and related ideas underneath or follow the tutorials list. Look through the profitable patterns and related cases, wait for or set alert for specific profitable pattern.
---------- Definition: 9 Seasons ----------
A life cycle of Price Wave is divided into 9 Seasons. Each time frame, from 5 minute to 1 month, has 9 seasons, Independent of each other:
Bull (Green)
Bull Pullback (Light Green): a pullback or retracement
Resistance / Overbought (Yellow): a resistance area, may become a Top, or be broken through.
Crazy Bought (Lime): Price is going up in a high volatility, could be a valid breakout, or a Bull Trap.
Neutral (White): a wandering season without direction, evolves into Bull or Bear
Bear (Red)
Bear Bounce (Light Red): Price bounces
Support / Oversold (Blue): a support area, may become a Bottom, or be broken through.
Crazy Sold (Fuchsia): Price is going down in a high volatility, could be a valid breakdown, or a Bear Trap.
---------- Some important evolution between seasons ----------
Resistance / Overbought (Yellow) -> Crazy Bought (Lime):
Bull is breaking through a resistance.
Crazy Bought (Lime) -> Resistance / Overbought (Yellow):
This normally indicates a failed breakout, Price goes back to the resistance.
Crazy Bought (Lime) -> Bull Pullback (Light Green):
This normally indicates Price has risen to a new level
Support / Oversold (Blue) -> Crazy Sold (Fuchsia):
Bear is breaking through a support.
Crazy Sold (Fuchsia) -> Support / Oversold (Blue):
This normally indicates a failed breakdown, Price recovers to the support.
Crazy Sold (Fuchsia) -> Bear Bounce (Light Red):
This normally indicates price has dropped to a new level
---------- Rainbow Ribbons for Multiple Time Frames ----------
Each ribbon of a rainbow represents a time frame.
The uppermost ribbon represents the shortest-term time frame - current time period of the chart, which is the time frame for trading.
The lowermost ribbon represent longest-term time frame, which work as environment, together with the other medium-term and long-term time frames.
The difference between two frames is 1.4142 fold (square root of 2), if level 1 is 15 minute, level 2 is 15 minute * (square root of 2) .
Examples of time frames in a rainbow:
For STANDARD in 15M: 15M - 21M - 30M - 42M - 60M(1H) - 85M - 120M(2H) - 170M
For PRO in 15M: 15M - 21M - 30M - 42M - 60M(1H) - 85M - 120M(2H) - 170M - 240M(4H) - 339M - 480M(8H) - 679M
---------- Trading Methods ----------
How to open a Long position?
When a profitable Long pattern appears, open small position first based on signal on shortest-term time frame; after retesting and confirming the support, open 2nd position; when it breaks through the resistance, pullbacks and confirms the breakout, open 3rd position.
How to exit a Long position?
Lift the Stop to a confirmed higher low, so that to take advantages of the bull run as possible.
How to open a Short position?
When a profitable Short pattern appears, open small position first based on signal on shortest-term time frame; after retesting and confirming the resistance, open 2nd position; when it breaks through the support, bounces and confirms the breakdown, add 3rd position.
How to exit a Short position?
Lower the Stop to a confirmed lower high, so that to take advantages of the bear run as possible.
---------- Versions Description ----------
The features may change later without advance notice.
PRO:
Invite-Only, with the following advanced features:
12 Ribbons Rainbow displays 9 Seasons of 12 time frames on a chart.
Advanced alert sets allows set alerts on short-term, medium-term, and long-term time frames.
Capability to input different trading instrument to compare with the current ticker.
Full time periods access allows apply it to broadest time periods, from 1 minute to 1 week (if history data is enough)
More new features in updates.
STANDARD:
Invite-Only, with the following advanced features:
8 Ribbons Rainbow displays 9 Seasons of 8 time frames on a chart.
Advanced alert sets allows set alerts on upper and lower frames.
Broad time periods access allows apply it to the most popular time periods, from 15 minute to 1 week (if history data is enough)
More new features in updates.
DEMO:
DEMO version is for trial purpose, having most of the features.
It is applicable to a list of trading instruments and specific time periods (1 hour to 1 day), which may change later without advance notice.
---------- Access to Indicators ----------
Please use DEMO version for Trial
Asking access to Invite-Only PRO and STANDARD versions:
9seasonsrainbowindicator.blogspot.com
Or contact the author.
---------- Install Invite Only: STANDARD & PRO Version----------
Ask access to STANDARD or PRO version
Open the chart -> Indicators (On the Top) -> Invite-Only Scripts (2nd button of the left bar)
Like/Favorite the indicator
Click to install on the chart
---------- About Loading Time ----------
It may take up to 2 minutes for your browser to load a new setting, depending on the your computer and network speed.
---------- List of the author's Indicators ----------
www.tradingview.com
---------- Disclaimer ----------
By using or requesting access to the indicator, you acknowledge that you have read and accepted that the indicator and any related content, including but not limited to: user manual, tutorials, ideas, videos, chats, emails, blog, are for the purpose of trading strategies studying and paper trading.
If a customer or user uses the indicator or related content mentioned above for live trading or investment, she/he should take all risks and be responsible for her/his own trading and investment activities.
---------- Updates ----------
The latest updates override the previous description.
To activate a update: Close the browser, Reopen the chart and apply the indicator.

Profit Hunter @DaviddTechProfit Hunter @DaviddTech is an advanced multi-strategy indicator designed to give traders a significant edge in identifying high-probability trading opportunities across all market conditions. By combining the power of T3 adaptive moving averages, ADX-based trend strength analysis, SuperTrend trailing stops, and dynamic support/resistance detection, this indicator delivers a complete trading system in one powerful package.
## 📊 Recommended Usage
Timeframes: Most effective on 1H, 4H, and Daily charts for swing trading; 5M and 15M for day trading
Markets: Works across all markets including Forex, Crypto, Indices, and Stocks
Setup Guidelines: Look for T3 crossovers with strong ADX readings (>25) coinciding with breakout signals (yellow dots/red crosses) near key support/resistance levels for highest probability entries
## 🔥 Key Features:
### T3 Adaptive Trend Detection:
Utilizes premium T3 adaptive indicators instead of standard EMAs for superior smoothing and accuracy
Dynamic color-shifting cloud formation between fast and slow T3 lines reveals immediate trend direction
Proprietary transparency algorithm intensifies cloud colors during strong trends based on real-time ADX readings
### Advanced Support & Resistance Mapping:
Automatically identifies and marks key market structure levels during T3 crossovers
Dynamic horizontal level plotting with optional extension for monitoring future price interactions
Intelligent level validation - converts to dotted lines when price breaks through, maintaining visual clarity
### SuperTrend Trailing Stoploss System:
Professional-grade white trailing stop indicator adapts to market volatility using ATR calculations
Generates precise entry and exit signals with optional buy/sell labels at critical reversal points
Visual trend state highlighting for immediate assessment of current market position
### Breakout Detection & Confirmation:
Sophisticated dual-algorithm breakout system combining Bollinger Bands and Keltner Channels
Visual breakout alerts with yellow dots (bullish) and red crosses (bearish) for instant pattern recognition
Validates breakouts against T3 trend direction to minimize false signals
### Alpha Edge Color System:
Utilizes DaviddTech's signature color scheme with bullish green and bearish pink
Revolutionary transparency algorithm translates ADX readings into precise visual intensity
Higher ADX values produce more vivid colors, instantly communicating trend strength without additional indicators
## 💰 Trading Applications:
Alpha Discovery: Identify emerging trends before the majority of market participants
Precision Entry/Exit: Use SuperTrend signals combined with support/resistance levels for optimal trade execution
Risk Management: Set stops based on the white trailing stoploss line for mathematically-optimized protection
Trend Confirmation: Validate setups using the T3 cloud direction and ADX-based intensity
Breakout Trading: Capture explosive moves with confirmed Bollinger/Keltner breakout signals
Swing Position Management: Monitor extended support/resistance levels for multi-day positioning
## ✨ Strategy Example
As shown in the chart image, ideal entries occur when:
The T3 cloud turns bullish (green) or bearish (pink) with strong color intensity
A yellow dot (bullish) or red cross (bearish) breakout signal appears
Price respects the white SuperTrend line as support/resistance
The trade aligns with key horizontal support/resistance levels identified by the indicator
## 📝 Attribution
This indicator builds upon and enhances concepts from:
Market Trend Levels Detector by BigBeluga (support/resistance detection framework)
T3 indicator implementation by DaviddTech (adaptive moving average system)
Average Directional Index (ADX) methodology for trend strength measurement
Profit Hunter @DaviddTech represents the culmination of advanced technical analysis methodologies in one seamless system.

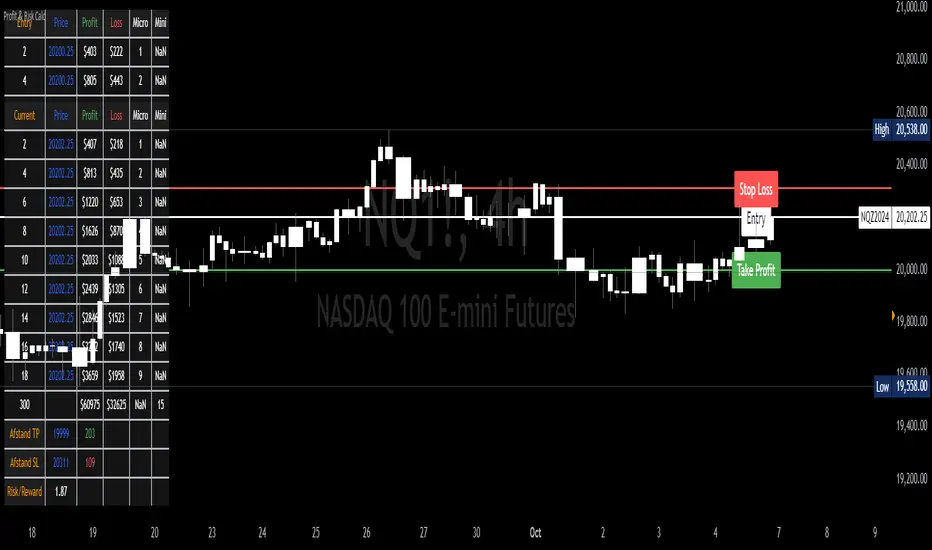
Profit & Risk CalculatorThe "Profit & Risk Calculator" script in Pine Script (TradingView) is designed to help users calculate potential profit and risk when trading, and to provide alerts when specific price levels are reached (such as entry price, take profit, or stop loss). It includes several components as described below:
1. Input Fields:
The user can manually input various prices: entry price, stop loss price, and take profit price, with steps of 0.25.
There is also an option to input a custom value (e.g., for personal lot sizing) and a total investment amount.
2. Dynamic Lines:
The script draws dynamic horizontal lines for the input prices: entry line (white), stop loss line (red), and take profit line (green).
These lines are automatically updated based on the entered price levels.
3. Labels for the Lines:
Labels are added to the lines to visually indicate the entry, stop loss, and take profit levels on the chart.
4. Long and Short Position Calculations:
The script calculates potential profit and loss for both long (profit if the price goes up) and short (profit if the price goes down) positions.
It also calculates the distance between entry and take profit, and distance between entry and stop loss, along with the risk/reward ratio (RR).
5. Alerts:
The script generates alerts when one of the following conditions is met:
Entry Condition: The price touches or exceeds the entry price (high >= entryPrice).
Stop Loss Condition: The price touches or drops below the stop loss price (low <= stopLossPrice).
Take Profit Condition: The price touches or exceeds the take profit price (high >= takeProfitPrice).
6. Lot Calculations:
The script calculates both micro and mini lot sizes based on a preset table and the custom value.
The results are displayed in a table on the chart.
7. Profit/Risk Table:
The script shows two tables:
One table calculates the profit, loss, and risk/reward ratio based on the input entry price.
A second table shows the same calculations based on the current price.
8. Chart Display:
The script places tables and other visual data on the chart, such as preset values, profit and loss calculations, and the distance from take profit and stop loss to the entry price.
English Explanation of Each Part of the Script
1. Input Fields
The script starts with several input fields where the user can specify the entry price, stop loss price, take profit price, custom value, and investment amount. These values help define the parameters for risk/reward calculations.
2. Dynamic Horizontal Lines
Three horizontal lines are drawn on the chart, representing the entry price, stop loss price, and take profit price. These lines update dynamically based on user input.
3. Dynamic Line Updates
As the user adjusts their inputs, the position of the lines is updated in real-time to match the new price levels. This keeps the chart visually accurate.
4. Labels for Lines
Labels are placed on the chart next to each price line, allowing the user to clearly see which line represents which price level.
5. Long and Short Position Calculations
The script calculates the potential profit or loss for both long (prices go up) and short (prices go down) positions, providing users with an idea of their potential gains or losses.
6. **6. Risk/Reward Ratio Calculation
This calculates the Risk/Reward Ratio (RR) by dividing the distance between the take profit and entry price by the distance between the entry and stop loss price. This gives the trader an idea of how much risk they're taking relative to the potential reward.
7. Alert Conditions
The alert conditions are defined based on the price hitting the set levels:
Entry Condition: If the price goes up and touches the entry level, the alert is triggered.
Stop Loss Condition: If the price drops and hits the stop loss level, the alert is triggered.
Take Profit Condition: If the price rises and reaches the take profit level, the alert is triggered.
8. Alert Configuration
Each condition is linked to an alert that sends a message when the specific price level is touched. The alerts notify the user when the entry, stop loss, or take profit levels are hit.
9. Lot Calculations
The script includes a function that calculates micro and mini lot sizes based on a preset table and a custom value input by the user. This is useful for adjusting lot sizes to the desired amount and determining position sizes for trades.
10. Entry Price-Based Profit & Loss Table
A table is generated on the chart that displays detailed information about the profit, loss, and risk/reward ratio based on the entry price. It helps traders see the potential outcomes for different lot sizes.
11. Current Price-Based Profit & Loss Table
This second table provides similar information as the first but calculates profit, loss, and risk/reward based on the current price. This allows the trader to see how their position performs as the market price changes in real time.
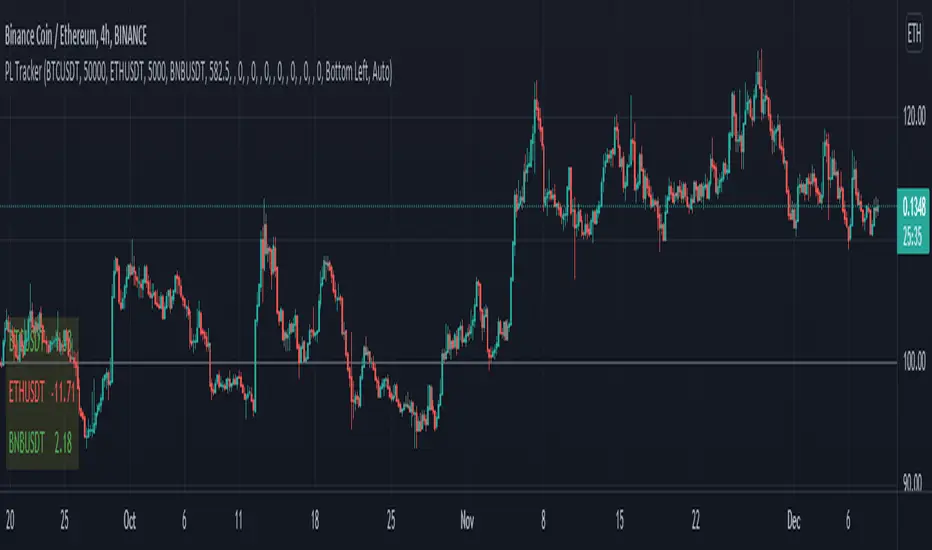
Profit Loss TrackerIt's a simple profit loss tracker for up to 10 symbols. A concise panel displays all your positions, whether if they're in profit or loss, and what percentage.
Text size and box position can be adjustable.
Profit Accumulator Bollinger Band TrendHi everyone,
I've been playing with the idea of trying to trend bollinger band movement of various currencies. What I've got here is the result of that. In its very basic form its a tool to identify the start and end of both long and short term trends.
The thick line (red/green) indicates whether this is a bullish (green) or bearish (red) movement and generally governs the longer term trend. The thinner, black line indicates the movements within the market. Anything above the zero line indicates positive movement where trades could be placed (along with the main trend line). When this line moves below the zero line, it appears to highlight uncertainty and the potential trend coming to an end.
If anyone would like alerts adding to this indicator then please let me know.
Thanks
Mike

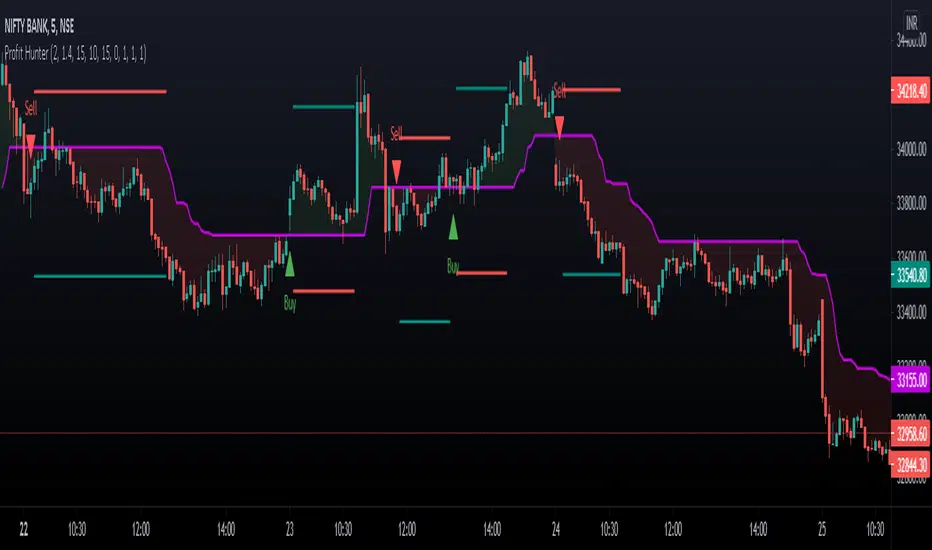
Profit HunterThis is a simple indicator working on the basis of trend optimized method, when price crosses and goes up the trendline it goes for long signal and when it crosses down the trendline it goes for short signal. The risk reward ratio plays a significant role in the succcess rate. Intraday square off timing is also given in the settings.
In indicator settings you will have access to
Entry Time Flexibility
Exit Time Flexibility
Take Profit Value
Stop Loss Value
Trailing Stop Losses
Contact us using the link given below to obtain access to this indicator.
This is for charting purpose and following an indicator bliendly involves risk. The historical results don't imply its future success.
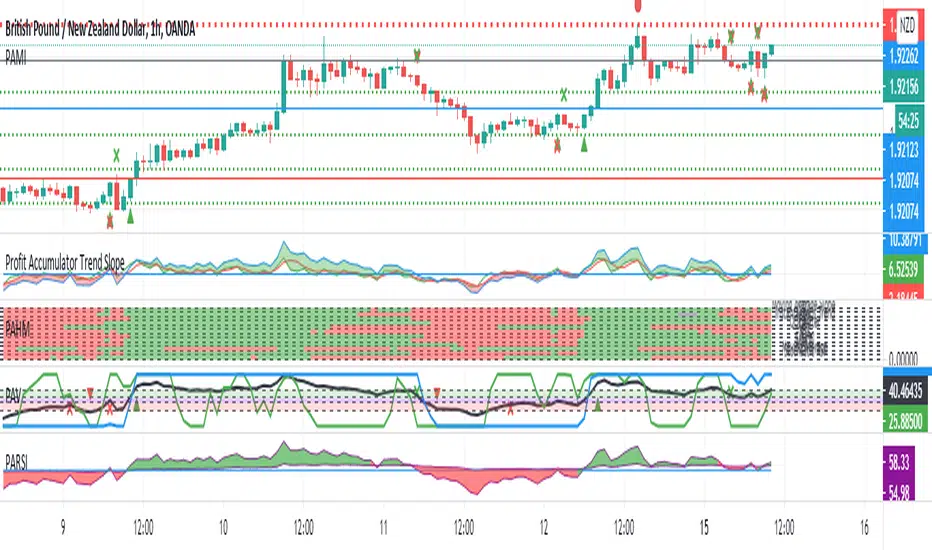
Profit Accumulator Trend SlopeI've been getting very good results with this indicator, using it in conjunction with the Profit Accumulator Main Indicator.
This indicator uses a number of methods for detecting reversals and the start of new trends.
The basis is simple in that when the trend lines cross above the zero line, it indicates a possible long entry and crossing below the zero line, indicates a possible short entry.
The strongest signal is when they all cross the zero line in one timeframe.
In terms of options/settings, I've included the following:
Multiple Timeframe
Changing the lengths.
I've also added an alert option for when the lines cross the zero line.
Profit Maximizer PMaxPMax is a brand new indicator developed by KivancOzbilgic in earlier 2020.
It's a combination of two trailing stop loss indicators;
One is Anıl Özekşi's MOST (Moving Stop Loss) Indicator
and the other one is well known ATR based SuperTrend.
Both MOST and SuperTrend Indicators are very good at trend following systems but conversely their performance is not bright in sideways market conditions like most of the other indicators.
Profit Maximizer - PMax tries to solve this problem. PMax combines the powerful sides of MOST (Moving Average Trend Changer) and SuperTrend (ATR price detection) in one indicator.
Backtest and optimization results of PMax are far better when compared to its ancestors MOST and SuperTrend. It reduces the number of false signals in sideways and give more reliable trade signals.
PMax is easy to determine the trend and can be used in any type of markets and instruments. It does not repaint.
The first parameter in the PMax indicator set by the three parameters is the period/length of ATR.
The second Parameter is the Multiplier of ATR which would be useful to set the value of distance from the built in Moving Average.
I personally think the most important parameter is the Moving Average Length and type.
PMax will be much sensitive to trend movements if Moving Average Length is smaller. And vice versa, will be less sensitive when it is longer.
As the period increases it will become less sensitive to little trends and price actions.
In this way, your choice of period, will be closely related to which of the sort of trends you are interested in.
We are under the effect of the uptrend in cases where the Moving Average is above PMax;
conversely under the influence of a downward trend, when the Moving Average is below PMax.
Built in Moving Average type defaultly set as EMA but users can choose from 8 different Moving Average types like:
SMA : Simple Moving Average
EMA : Exponential Movin Average
WMA : Weighted Moving Average
TMA : Triangular Moving Average
VAR : Variable Index Dynamic Moving Average aka VIDYA
WWMA : Welles Wilder's Moving Average
ZLEMA : Zero Lag Exponential Moving Average
TSF : True Strength Force
Tip: In sideways VAR would be a good choice
You can use PMax default alarms and Buy Sell signals like:
1-
BUY when Moving Average crosses above PMax
SELL when Moving Average crosses under PMax
2-
BUY when prices jumps over PMax line.
SELL when prices go under PMax line.

Profit Accumulator Relative VolatilityRelative Volatility Indicator
This is a support indicator to the Main Indicator which has also been published.
This indicator uses volatility to determine if the market is quiet, or trading sideways or if there is money in the market and the opportunity for a long or short signal. There is an adjustable bottom line (in this case 0.15) and anything near or below that would indicate that no trades should be taking place. Similarly, if the trend line is declining, this is another indication that any trades should not be taken.
The trend line as an adjustable maximum setting of 0.5 and an increasing trend line is indicative of volatility in the market and a long or short position should be considered. This indicator should be used with the other suite of indicators to provide confluence of the trade.
Whilst an actual alert function is not set for the indicator, the TradingView alert function can be used to trigger a message when the line crosses above 0.15.
I've been using this successfully on the one hour FX charts, but seems to work equally as well on higher or lower time frames (not less than 15min).
The other indicators which are part of the suite are shown on the website which is highlighted in my signature at the bottom of the page. Purchase of the main indicator gives access to the full suite of eight indicators. I use the other indicators to confirm the direction of the trade and to determine if I want to trade or not. I use it along with the 2min, 15min and 4hr timeframes to identify the best entry window and how long I'm likely to be in the trade.
Support can be provided via private message or in the comments below.
The links are provided below for access to the indicator.
Profit Accumulator Trend IndicatorTREND INDICATOR (PATC)
This is a support indicator to the Main Indicator which has also been published.
This indicator uses a number of tools to assess for trend direction and where to place Take Profit and Stop Loss points. There are no alerts with this indicator.
I've been using this successfully on the one hour FX charts, but seems to work equally as well on higher or lower time frames (not less than 15min).
This indicator has a number of tools in the settings that can be used to assist with trading. This includes
Multi-Timeframe Support and Resistance points. The thicker the line is, the greater the timeframe that youre dealing with. In the 1hr chart on this script, the S&R is set at 1hr, 4hr and 1D time periods.
Trend Direction points. Note that these have a massive tendency to repaint, however when used with something like Bollinger Bands (as in the Main Indicator) you can identify turning points (i.e. when the close of the candle is at the upper or lower boundary levels).
Risk Management provides a high level tool for managing money based on relative ATR multiplier points.
The other indicators which are part of the suite are shown on the website which is highlighted in my signature at the bottom of the page. Purchase of the main indicator gives access to the full suite of eight indicators. I use the other indicators to confirm the direction of the trade and to determine if I want to trade or not. I use it along with the 2min, 15min and 4hr timeframes to identify the best entry window and how long I'm likely to be in the trade.
Support can be provided via private message or in the comments below.
The links are provided below for access to the indicator.

PS ATR VariantProfit Sniper ATR Variant v0.1 is completely new but based off of the Profit Sniper 3.0 you know and love :
The original SNIPER operates off two timeframes in parallel, your Trend Timeframe (Higher Timeframe concerned with identifying market up & down trends), and your Trade Timeframe (Lower Timeframe to actually trade Longs & Shorts in).
Within each timeframe, you can tailor your preference for waiting for either Stochastic Ribbon cross only, or Ribbon Cross followed by Chande Confirmation for that additional market structure confidence. Flags & Alerts will then provide you with numerous trading Long & Short trading opportunities per day.
You also have the option to trade with trend so the indicator will automatically flag & alert only Shorts in a Short trend, and Longs in a Long Trend.
This version has the ATR (Average True Range) Indicator incorporated, to give trend direction (only tke longs in long trend and vice versa) and some additional safety features using ATR values.
For access please send a DM
With some extra features. such as ATR ( Average True Range ) trade entry which measures market volatility by analysing the range of asset price during a specified period.

PROFIT+ V3 ALERTThis is an alert indicator for PROFIT+ V3 strategy .
Add it to your chart with the strategy and create alerts to
receive notifications when Buy and Sell signals are generated.
To receive access for the strategy and this indicator, please pm me or contact
me at telegram from the link below.
----------------------------------------------------------------------------
Это алерт индикатор к стратегии PROFIT+ V3 .
Используйте индикатор со стратегией и создавайте алерты
для получения уведомлений когда генерируются сигналы
на покупку и продажу.
Для получения доступа к стратегии и к данному индикатору,
пожалуйста, напишите мне в лс или в телеграм через ссылку ниже.

PROFIT + ALERTS V2This is an Alert indicator for PROFIT + strategy.
Use it with the strategy to create and receive notifications when the strategy generates buy / sell signals.
To get access to the indicator and its strategy pm me.
------------------------------------------------------
Это алерт индикатор для стратегии PROFIT +
для получения уведомлений когда стратегия генерирует buy / sell сигналы.
Для получения доступа к индикатору и стратегии пишите в личные сообщения.

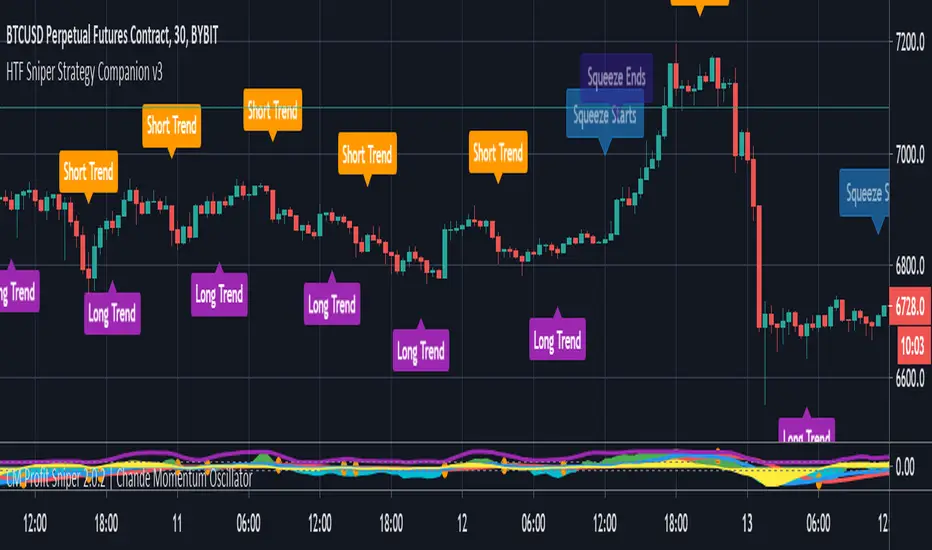
HTF Sniper Strategy CompanionProfit Sniper companion indicator to use ideally on higher timeframes (HTF) to alert on trend changes and Bollinger Band Squeeze Conditions.
To be used as a visual tool alongside "Profit Sniper 2.0" Indicator to allow you to identify market changing between trending & ranging state and trade Long or Short accordingly, example use is on the 30 minute Heiken Ashi to identify bullish or bearish trends to guide lower timeframe trading plays.
Profit and Stoploss CalculatorThis script is designed to display three stop loss areas to assist either with automation of risk management or identify and alert when price is in a range of a trade for risk to reward ratio.
In this version there are three stop losses and 1 PT. Mainly because i will most likely only be using 1 of the SL to pair with the PT.
Stoploss areas are displayed on both sides of the price for long and short calculations along with the two profit factors but the settings in the indicator it self apply to both sides in terms of percentage.
