[EDU] Close Open Estimation Signals (COE Signals)EN:
Close Open Estimation ( aka COE ) is a very simple swing-trading indicator based on even simpler idea. This indicator is from my educational series, which means that I just want to share with another way to look at the market in order to broaden your knowledge .
Idea :
Let's take n previous bars and make a sum a of close - open -values of each bar. Knowledgeable of you may already see the similarity to RSI calculation idea . Now let's plot this sum and see what we have now.
We can see, that whenever COE crosses over 0-level, uptrend begins, and if COE crosses under 0-level, downtrend begins. The speed of such signals can be adjusted by changing lookback period: the lower the lookback, the faster signals you get, but high-quality ones can be obtained only via not-so-fast lookback as when the market is consolidating or volatility is to high, there can be many garbage signals, like 95+% of other indicators have.
Let's explore more and calculate volatility of COE(v_coe in the code): current COE - previous CEO .
Now it appears that when v_coe crosses over 0-level, it's a signal, that this is a new low and soon the uptrend will follow. Analogically for crossing under 0-level .
I guess now you understood what these all are about: COE crossings show global trend signals , while Volatility COE ( v_coe or VCOE ) crossings show reversal points .
For signals I further calculated volatility of VCOE(VVCOE) and then volatility of VVCOE(VVVCOE). Why? Because for me they seem to be more accurate, but you are welcome to experiment and figure best setups for yourself and by yourself, I just share my opinion and experience .
COE can be helpful only in high liquidity markets with good trend or wide sideways .
If you want to experiment with COE, just copy the code and play with it. Curious of you will probably find it helpful eventhough the idea is way too simple.
By it's perfomance COE can probably beat QQE at open price settings.
(use open of the price at indicator to get zero repaint! )
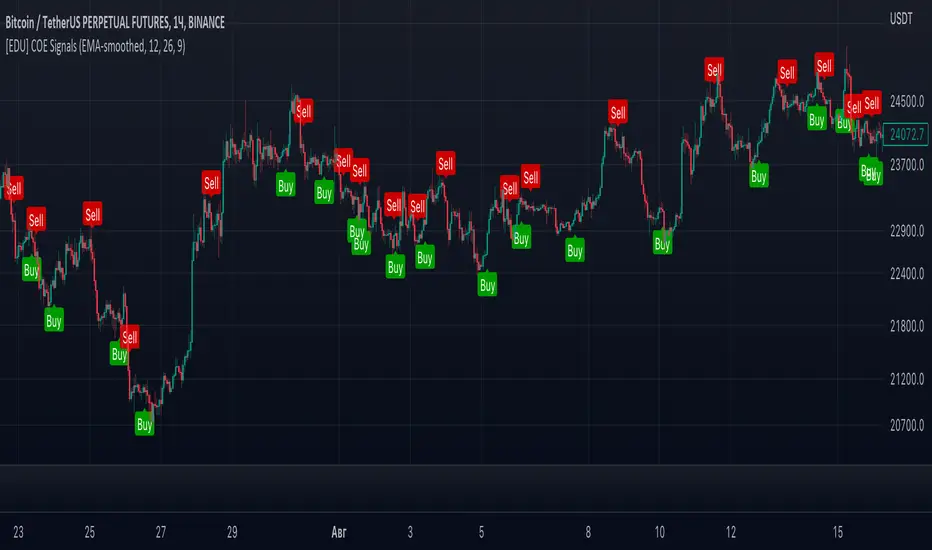
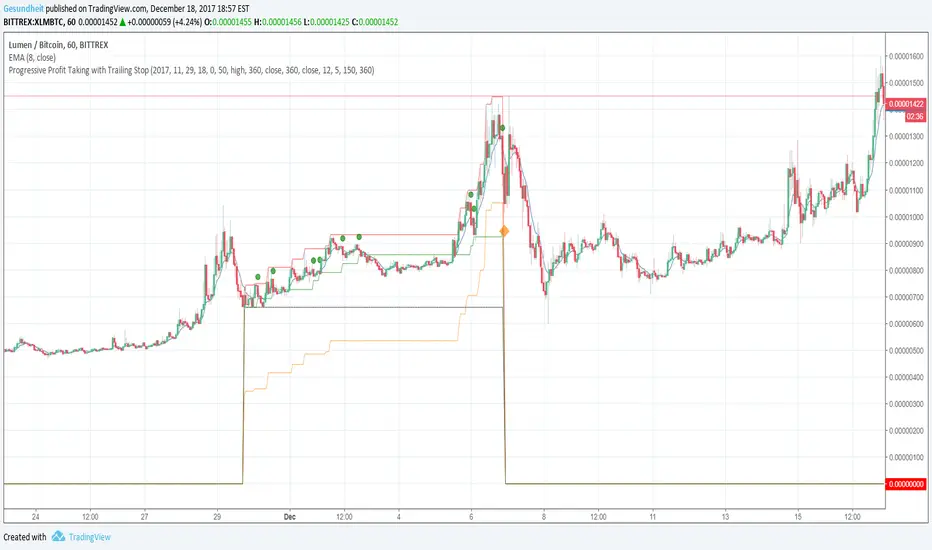
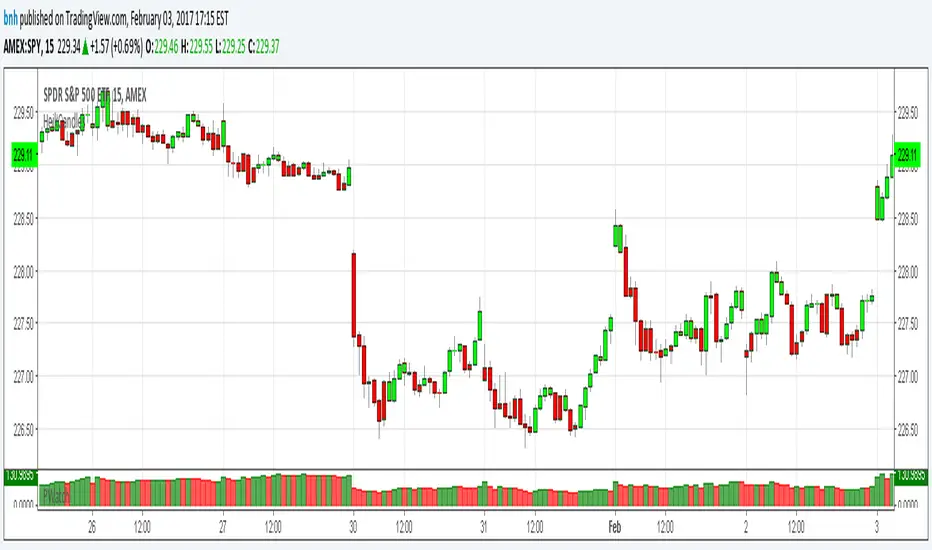
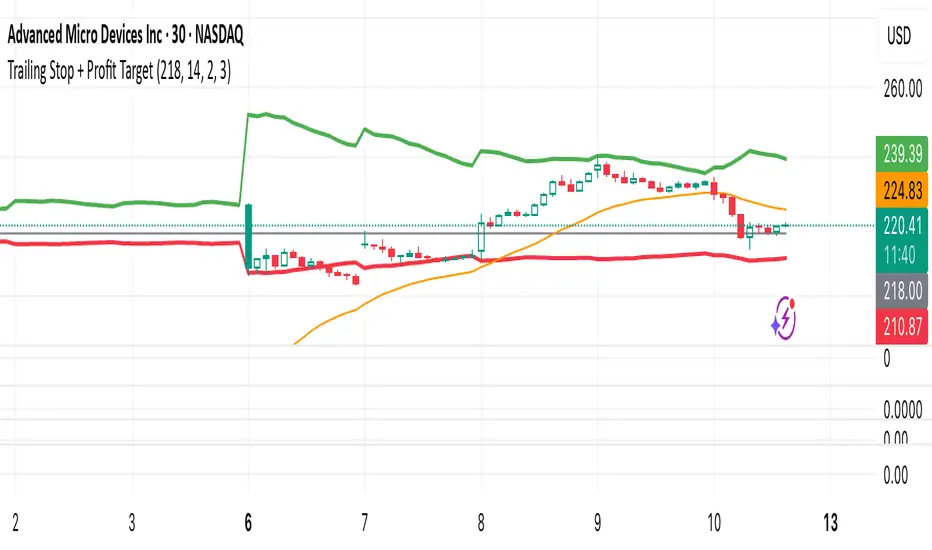
Examples :
If you any questions, feel free to DM me or leave comments.
Good luck and take your profits!
- Fyodor Tarasenko
RU:
Close Open Estimation ( aka COE ) — это очень простой индикатор свинг-трейдинга, основанный на еще более простой идее. Этот индикатор из моей образовательной серии, а это значит, что я просто хочу поделиться с другим взглядом на рынок , чтобы расширить ваши знания .
Идея :
Возьмем n предыдущих баров и составим сумму a из close - open -значений каждого бара. Знающие люди могут уже заметить сходство с идеей расчета RSI . Теперь давайте построим эту сумму и посмотрим, что у нас сейчас есть.
Мы видим, что всякий раз, когда COE пересекает выше 0-уровня, начинается восходящий тренд , а если COE пересекает ниже 0-уровня, начинается нисходящий тренд. Скорость таких сигналов можно регулировать изменением ретроспективы: чем меньше ретроспектива, тем быстрее вы получаете сигналы, но качественные можно получить только через не- такой быстрый взгляд назад, как когда рынок консолидируется или волатильность слишком высока, может быть много мусорных сигналов, как у 95+% других индикаторов.
Давайте рассмотрим больше и рассчитаем волатильность COE(v_coe в коде): текущий COE - предыдущий CEO .
Теперь кажется, что когда v_coe пересекает уровень 0, это сигнал о том, что это новый минимум и вскоре последует восходящий тренд . Аналогично для пересечения под 0-уровнем .
Думаю, теперь вы поняли, о чем все это: COE пересечения показывают глобальные сигналы тренда , а пересечения Volatility COE ( v_coe или VCOE ) показывают точки разворота .
Для сигналов я дополнительно рассчитал волатильность VCOE(VVCOE), а затем волатильность VVCOE(VVVCOE). Почему? Потому что для меня они кажутся более точными, но вы можете поэкспериментировать и подобрать оптимальные настройки для себя и для себя, я просто делюсь своим мнением и опытом .
COE может быть полезен только на рынках с высокой ликвидностью и хорошим трендом или широким боковиком .
Если вы хотите поэкспериментировать с COE, просто скопируйте код и поэкспериментируйте с ним. Любознательные из вас, вероятно, сочтут это полезным, хотя идея слишком проста.
По своей результативности СОЕ может составить конкуренцию широко известному QQE, используя open цены.
(используйте open цены на индикаторе, чтобы получить нулевую перерисовку! )
Примеры :
Если у вас есть вопросы, пишите мне в личные сообщения или оставляйте комментарии.
Удачи и профита всем!
- Федор Тарасенко
Penunjuk Pine Script®