Lorentzian Classification - Advanced Trading DashboardLorentzian Classification - Relativistic Market Analysis
A Journey from Theory to Trading Reality
What began as fascination with Einstein's relativity and Lorentzian geometry has evolved into a practical trading tool that bridges theoretical physics and market dynamics. This indicator represents months of wrestling with complex mathematical concepts, debugging intricate algorithms, and transforming abstract theory into actionable trading signals.
The Theoretical Foundation
Lorentzian Distance in Market Space
Traditional Euclidean distance treats all feature differences equally, but markets don't behave uniformly. Lorentzian distance, borrowed from spacetime geometry, provides a more nuanced similarity measure:
d(x,y) = Σ ln(1 + |xi - yi|)
This logarithmic formulation naturally handles:
Scale invariance: Large price moves don't overwhelm small but significant patterns
Outlier robustness: Extreme values are dampened rather than dominating
Non-linear relationships: Captures market behavior better than linear metrics
K-Nearest Neighbors with Relativistic Weighting
The algorithm searches historical market states for patterns similar to current conditions. Each neighbor receives weight inversely proportional to its Lorentzian distance:
w = 1 / (1 + distance)
This creates a "gravitational" effect where closer patterns have stronger influence on predictions.
The Implementation Challenge
Creating meaningful market features required extensive experimentation:
Price Features: Multi-timeframe momentum (1, 2, 3, 5, 8 bar lookbacks) Volume Features: Relative volume analysis against 20-period average
Volatility Features: ATR and Bollinger Band width normalization Momentum Features: RSI deviation from neutral and MACD/price ratio
Each feature undergoes min-max normalization to ensure equal weighting in distance calculations.
The Prediction Mechanism
For each current market state:
Feature Vector Construction: 12-dimensional representation of market conditions
Historical Search: Scan lookback period for similar patterns using Lorentzian distance
Neighbor Selection: Identify K nearest historical matches
Outcome Analysis: Examine what happened N bars after each match
Weighted Prediction: Combine outcomes using distance-based weights
Confidence Calculation: Measure agreement between neighbors
Technical Hurdles Overcome
Array Management: Complex indexing to prevent look-ahead bias
Distance Calculations: Optimizing nested loops for performance
Memory Constraints: Balancing lookback depth with computational limits
Signal Filtering: Preventing clustering of identical signals
Advanced Dashboard System
Main Control Panel
The primary dashboard provides real-time market intelligence:
Signal Status: Current prediction with confidence percentage
Neighbor Analysis: How many historical patterns match current conditions
Market Regime: Trend strength, volatility, and volume analysis
Temporal Context: Real-time updates with timestamp
Performance Analytics
Comprehensive tracking system monitors:
Win Rate: Percentage of successful predictions
Signal Count: Total predictions generated
Streak Analysis: Current winning/losing sequence
Drawdown Monitoring: Maximum equity decline
Sharpe Approximation: Risk-adjusted performance estimate
Risk Assessment Panel
Multi-dimensional risk analysis:
RSI Positioning: Overbought/oversold conditions
ATR Percentage: Current volatility relative to price
Bollinger Position: Price location within volatility bands
MACD Alignment: Momentum confirmation
Confidence Heatmap
Visual representation of prediction reliability:
Historical Confidence: Last 10 periods of prediction certainty
Strength Analysis: Magnitude of prediction values over time
Pattern Recognition: Color-coded confidence levels for quick assessment
Input Parameters Deep Dive
Core Algorithm Settings
K Nearest Neighbors (1-20): More neighbors create smoother but less responsive signals. Optimal range 5-8 for most markets.
Historical Lookback (50-500): Deeper history improves pattern recognition but reduces adaptability. 100-200 bars optimal for most timeframes.
Feature Window (5-30): Longer windows capture more context but reduce sensitivity. Match to your trading timeframe.
Feature Selection
Price Changes: Essential for momentum and reversal detection Volume Profile: Critical for institutional activity recognition Volatility Measures: Key for regime change detection Momentum Indicators: Vital for trend confirmation
Signal Generation
Prediction Horizon (1-20): How far ahead to predict. Shorter horizons for scalping, longer for swing trading.
Signal Threshold (0.5-0.9): Confidence required for signal generation. Higher values reduce false signals but may miss opportunities.
Smoothing (1-10): EMA applied to raw predictions. More smoothing reduces noise but increases lag.
Visual Design Philosophy
Color Themes
Professional: Corporate blue/red for institutional environments Neon: Cyberpunk cyan/magenta for modern aesthetics
Matrix: Green/red hacker-inspired palette Classic: Traditional trading colors
Information Hierarchy
The dashboard system prioritizes information by importance:
Primary Signals: Largest, most prominent display
Confidence Metrics: Secondary but clearly visible
Supporting Data: Detailed but unobtrusive
Historical Context: Available but not distracting
Trading Applications
Signal Interpretation
Long Signals: Prediction > threshold with high confidence
Look for volume confirmation
- Check trend alignment
- Verify support levels
Short Signals: Prediction < -threshold with high confidence
Confirm with resistance levels
- Check for distribution patterns
- Verify momentum divergence
- Market Regime Adaptation
Trending Markets: Higher confidence in directional signals
Ranging Markets: Focus on reversal signals at extremes
Volatile Markets: Require higher confidence thresholds
Low Volume: Reduce position sizes, increase caution
Risk Management Integration
Confidence-Based Sizing: Larger positions for higher confidence signals
Regime-Aware Stops: Wider stops in volatile regimes
Multi-Timeframe Confirmation: Align signals across timeframes
Volume Confirmation: Require volume support for major signals
Originality and Innovation
This indicator represents genuine innovation in several areas:
Mathematical Approach
First application of Lorentzian geometry to market pattern recognition. Unlike Euclidean-based systems, this naturally handles market non-linearities.
Feature Engineering
Sophisticated multi-dimensional feature space combining price, volume, volatility, and momentum in normalized form.
Visualization System
Professional-grade dashboard system providing comprehensive market intelligence in intuitive format.
Performance Tracking
Real-time performance analytics typically found only in institutional trading systems.
Development Journey
Creating this indicator involved overcoming numerous technical challenges:
Mathematical Complexity: Translating theoretical concepts into practical code
Performance Optimization: Balancing accuracy with computational efficiency
User Interface Design: Making complex data accessible and actionable
Signal Quality: Filtering noise while maintaining responsiveness
The result is a tool that brings institutional-grade analytics to individual traders while maintaining the theoretical rigor of its mathematical foundation.
Best Practices
- Parameter Optimization
- Start with default settings and adjust based on:
Market Characteristics: Volatile vs. stable
Trading Timeframe: Scalping vs. swing trading
Risk Tolerance: Conservative vs. aggressive
Signal Confirmation
Never trade on Lorentzian signals alone:
Price Action: Confirm with support/resistance
Volume: Verify with volume analysis
Multiple Timeframes: Check higher timeframe alignment
Market Context: Consider overall market conditions
Risk Management
Position Sizing: Scale with confidence levels
Stop Losses: Adapt to market volatility
Profit Targets: Based on historical performance
Maximum Risk: Never exceed 2-3% per trade
Disclaimer
This indicator is for educational and research purposes only. It does not constitute financial advice or guarantee profitable trading results. The Lorentzian classification system reveals market patterns but cannot predict future price movements with certainty. Always use proper risk management, conduct your own analysis, and never risk more than you can afford to lose.
Market dynamics are inherently uncertain, and past performance does not guarantee future results. This tool should be used as part of a comprehensive trading strategy, not as a standalone solution.
Bringing the elegance of relativistic geometry to market analysis through sophisticated pattern recognition and intuitive visualization.
Thank you for sharing the idea. You're more than a follower, you're a leader!
@vasanthgautham1221
Trade with precision. Trade with insight.
— Dskyz , for DAFE Trading Systems
Cari dalam skrip untuk "profitable"

SMA Backtest Optimizer [Mr_Rakun]The SMA Backtest Optimizer is a powerful Pine Script tool designed to systematically analyze and compare various Simple Moving Average (SMA) periods to identify the most profitable configuration for trading strategies. This indicator tests multiple SMA periods (from 10 to 100) using a crossover strategy where buys occur when price crosses above the SMA and sells when price crosses below it.
Key Features:
Tests 10 different SMA periods to determine optimal settings
Calculates profit/loss based on a defined starting capital
Tracks total profit and number of trades for each period
Visually highlights the best performing SMA on your chart
Displays comprehensive results in an easy-to-read table
Labels the chart with key performance metrics
This code serves as a core framework that traders can customize for their specific needs. You can easily modify the strategy parameters, test different technical indicators, adjust capital settings, or implement more complex entry/exit rules. The optimization methodology can be applied to virtually any trading approach you wish to evaluate.
Feel free to adapt this framework to test your own trading ideas and discover which parameters work best in different market conditions.

Dynamic and ATR Supertrend**Dynamic and ATR Supertrend Indicator**
The Dynamic and ATR Supertrend indicator is a powerful tool for traders who want to identify trends and make informed decisions about their investments. This indicator combines the benefits of the Supertrend indicator with the dynamic multiplier adjustment and ATR (Average True Range) calculation to provide a more accurate and reliable trend identification system.
**Key Features:**
* **Dynamic Multiplier Adjustment:** The indicator uses a dynamic multiplier adjustment to adapt to changing market conditions. This ensures that the indicator remains sensitive to trend changes and provides accurate signals.
* **ATR Calculation:** The indicator uses the ATR (Average True Range) calculation to determine the volatility of the market. This helps to identify the optimal multiplier value for the Supertrend calculation.
* **Supertrend Calculation:** The indicator uses the Supertrend calculation to identify trends and provide buy and sell signals.
* **Higher Timeframe Analysis:** The indicator allows for higher timeframe analysis, which enables traders to identify trends and make decisions based on a broader market perspective.
* **Alert System:** The indicator includes an alert system that notifies traders of trend changes and price crosses, allowing them to make timely and informed decisions.
**How it Works:**
1. The indicator calculates the ATR (Average True Range) of the market to determine the volatility.
2. The indicator uses the dynamic multiplier adjustment to adapt to changing market conditions.
3. The indicator calculates the Supertrend value using the ATR and dynamic multiplier.
4. The indicator identifies trends and provides buy and sell signals based on the Supertrend value.
5. The indicator includes an alert system that notifies traders of trend changes and price crosses.
**Benefits:**
* **Improved Trend Identification:** The indicator provides a more accurate and reliable trend identification system, allowing traders to make informed decisions.
* **Adaptability:** The indicator adapts to changing market conditions, ensuring that it remains sensitive to trend changes and provides accurate signals.
* **Flexibility:** The indicator allows for higher timeframe analysis, enabling traders to identify trends and make decisions based on a broader market perspective.
* **Alert System:** The indicator includes an alert system that notifies traders of trend changes and price crosses, allowing them to make timely and informed decisions.
**Conclusion:**
The Dynamic and ATR Supertrend indicator is a powerful tool for traders who want to identify trends and make informed decisions about their investments. With its dynamic multiplier adjustment, ATR calculation, and Supertrend calculation, this indicator provides a more accurate and reliable trend identification system. The indicator's adaptability, flexibility, and alert system make it an essential tool for traders who want to stay ahead of the market and make profitable trades.

ABC Market stage judgmentABC Stage Judgment Indicators · Introduction
Core ideology
The market situation is divided into three stages:
Zone B (Low Volatility Accumulation): Extremely low volatility, no trend, institutions accumulate chips.
Zone A (oscillation zone): The volatility has rebounded but there is no unilateral trend, suitable for short-term high selling and low buying.
Zone C (Trend Explosion): The volatility has significantly expanded and the trend is strong, making it profitable to follow the position.
Core Indicators
Volatility measurement
Bollinger Bands Width (BBWidth): 20 cycle moving average ± 2 σ bandwidth, reflecting relative volatility compression/release;
ATR (Average True Volatility): measures the absolute intensity of price volatility.
Trend Strength
ADX (Average Trend Index): measures the strength of a trend (without distinguishing direction),
ADX<20 → No trend (Zone B/A)
ADX>25 → Significant trend (Zone C)
Stage division logic
Zone B: Both BWidth and ATR are less than the set multiple of their respective historical means, and ADX is less than the threshold → "quiet bottoming out";
Zone C: ADX>threshold, and BBWidth or ATR>set multiple of their respective historical means, trading volume amplification → "trend takeoff";
Zone A: Time periods that do not belong to B/C are all classified as oscillation zones.
Optional enhanced filtering
Direction confirmation (+DI/- DI): avoid going against the trend;
Multi cycle verification (4H): in line with the trend of large-scale;
Momentum filtering (ROC/MACD/RSI): ensuring kinetic energy support;
ATR slope: Confirm the release of fluctuations;
Breakthrough Confirmation: Enter only after the breakthrough is confirmed at the closing level.
These filters are turned off by default and can be selected with one click for different scenarios such as "high-level oscillation", "low-level bottoming", "planting trees in the middle", etc.
usage
Multi cycle switching: Built in "5-minute/1-hour" two main cycles for free switching;
Visualization: The background color and labels display the current Zone at a glance;
Alarm: Stage switching automatically triggers an Alert, which can be pushed through mobile phones/Telegram.

BTC/ETH Lot Size for Dexin - V1.0
█ Overview - This tool is specifically tailored for Delta Exchange India’s users.
I use this interactive tool before taking a position in the BTC’s futures perpetual market . With only 3 mouse clicks, I see all the necessary information, whether a Long or Short position.
A visual of Liquidation Price Level, Stop Loss Price Level, Entry Price Level, Break-even Price Level, and Take Profit Price Level can be immediately seen.
On the top right corner of the chart, which Leverage is to be used, No. of Lots to be taken, expected Profit amount, Loss amount, Brokerage Fees, Risk to Reward Ratios, and Return on Investment are shown, excluding brokerage travel. To get the correct answer in the table that suits your account and risk-taking appetite, the user needs to enter the account balance and Risk per trade.
It also does live tracking of the position, and alerts can be configured too.
█ How to Use
Load the indicator on an active chart.
In the Trading View, ensure that the Magnets is enabled (on the left panel). This will precisely select the price levels you want to choose from OHLC for a candle.
When you first load the tool on the bottom of the chart, you will see a blue box with text in white color guiding you on what you need to do.
Before the first click, the box shall prompt “On the signal candle, set the entry level, where the position would be executed”.
Once the entry price level is selected, the next prompt in the blue box shall be “Set the stop loss level where the position would be exited”. Thus, you need to click the stop loss price level.
Now that the two clicks of Entry and Stop Loss are already done, the last remaining is for the take profit. The last prompt shall be “Set the profit level where the position would be exited”. Therefore, you need to select your take-profit level
Finally, when all three points are selected, the tool shall draw trade zones.
The tool automatically determines whether it is a Long Position or Short Position from the Stop loss and take-profit price levels concerning the entry price level
If the take profit level is above the entry price, the stop must be below, and vice versa; otherwise, an error occurs.
You can change levels by dragging the handles that appear when you select the indicator, or by entering new values in the settings.
Once the position tool is on a chart, it will appear at the same levels on all symbols you use.
If you select the position tool on your chart and delete it, this will also delete the indicator from the chart. You will need to re-add it if you want to draw another position tool. You can add multiple instances of the indicator if you need a position tool on more than one of your charts.
█ Features
Display
The tool displays the following information as graphical visuals
The Liquidation to Stop Loss, Stop Loss to Entry, Entry to Break-even, and Entry to Take Profit zones shall be initiated from the entry candle point.
If you want to be from the candle that crossed the level at a different time from the entry candle, you may go to the settings and adjust the time accordingly. Please note that the time interval is 15 minutes, so at times you may not be able to see the graphical display; however, once the 15-minute time interval is over, you will see the graphical display on the chart.
The tool displays the following information in a tabulated manner
The first row indicates the Leverage that is best suited. The leverage selection by default is greater than or equal to the risk distance.
The second row indicates the number of lots that is computed in relation to the account balance, Risk appetite, Entry price, and Stop Loss price.
The third row indicates estimated profit considering taker's fees and is computed in relation to the number of Lots, Entry price, and Take-Profit price.
The fourth row indicates estimated loss considering taker's fees and is computed in relation to the number of Lots, Entry price, and Stop Loss price.
The fifth row indicates the actual Risk to Reward Ratio, ignoring the travel that pertains to fees.
The sixth row indicates actual Return on Investment, ignoring the travel that pertains to fees.
The intent is to allow the user to make an informed decision prior to taking a position by seeing “$/Rs.” or “% of R O I” or “R : R”.
In case the user wants to know beforehand what the expected charges are that need to be borne before taking a position, that too is made available in the seventh and eighth rows. Both sides' charges are made available for ready reference, irrespective of the outcome of the trade, the user knows the consequences beforehand.
█ Settings
'Trade Sizing'
The tool's input menu is divided into various parts. The first part is 'Trade Sizing'. The user needs to key in the exact number that appears in the Delta Exchange India account against 'Account Balance ($)'. The second thing the user needs to do is key in the 'Risk per Trade'. By default,t it is set to 0.25 and has a default stop change of 0.25. Alternatively, the user can key in any number (Whole number or Rational number) within 100 if that suits their risk management criterion.
'Trade Levels'
Allows users to manually set the Entry, Time, Stop Loss, and Take Profit Price Levels.
'Aggressive Mode Selection'
As the Liquidation zone is shown on the chart, if the user feels that the liquidation price level is too far from the stop loss, this option of 'Use Aggressive Leverage?' allows to increase the leverage, thus reducing the investment amount and in return increasing the Return on Investment %.
The second option in this category is 'Compute Lots based on invested Margin?' itself is self-explanatory, and thus the tabulated data shall be populating the data based on the number entered by the user against 'Margin to be invested ($)'. It is for the user to ensure that the estimated outcomes are within their risk management criterion.
'Conversion & Charges'
If the user wants to see the Profit, Loss, and Fees amount in 'Rs.', all that needs to be done is simply enable the 'Show P&L in Rs.?' The conversion shall take place considering 1 USD = 85 Rs. Same as that carried out by Delta Exchange India.
If the user wants to see the Brokerage Fees, all that needs to be done is simply enable the 'Show Brokerage Fees?'. On enabling this, the table shall show Profitable Trade's (PT) Fees and Lost Trade's (LT) Fees irrespective of the outcome of the trade. The intent is to allow the user to make informed decisions to avoid regrets or surprises at the end of the trade.
'Table'
The division of the input section is related to table position, font size and colors for text and background.
█ Alerts
Alerts can be configured by clicking 'More' (the three dots that appear when you place the cursor on the indicator title that appears on the top left corner of the chart). Alternatively, one can configure alerts by right-clicking on either of the two price levels - Stop Loss price level or Take Profit Price level. Upon right clicking, a window shall appear and the topmost line on that window shall display 'Add alert on ……….' The user can thus put alerts on either of the key levels, such as Stop Loss, Take Profit, and Break Even, or on all of them one by one.

Enigma Sniper 369The "Enigma Sniper 369" is a custom-built Pine Script indicator designed for TradingView, tailored specifically for forex traders seeking high-probability entries during high-volatility market sessions.
Unlike generic trend-following or scalping tools, this indicator uniquely combines session-based "kill zones" (London and US sessions), momentum-based candle analysis, and an optional EMA trend filter to pinpoint liquidity grabs and reversal opportunities.
Its originality lies in its focus on liquidity hunting—identifying levels where stop losses are likely clustered (around swing highs/lows and wick midpoints)—and providing visual entry zones that are dynamically removed once price breaches them, reducing clutter and focusing on actionable signals.
The name "369" reflects the structured approach of three key components (session timing, candle logic, and trend filter) working in harmony to snipe precise entries.
What It Does
"Enigma Sniper 369" identifies potential buy and sell opportunities by drawing two types of horizontal lines on the chart during user-defined London and US
session kill zones:
Solid Lines: Mark the swing low (for buys) or swing high (for sells) of a trigger candle, indicating a potential entry point where stop losses might be clustered.
Dotted Lines: Mark the 50% level of the candle’s wick (lower wick for buys, upper wick for sells), serving as a secondary confirmation zone for entries or tighter stop-loss placement.
These lines are plotted only when specific candle conditions are met within the kill zones, and they are automatically deleted once the price crosses them, signaling that the liquidity at that level has likely been grabbed. The indicator also includes an optional EMA filter to ensure trades align with the broader trend, reducing false signals in choppy markets.
How It Works
The indicator’s logic is built on a multi-layered approach:
Kill Zone Timing: Trades are only considered during user-defined London and US session hours (e.g., London from 02:00 to 12:00 UTC, as seen in the screenshots). These sessions are known for high volatility and liquidity, making them ideal for capturing institutional moves.
Candle-Based Momentum Logic:
Buy Signal: A candle must close above its midpoint (indicating bullish momentum) and have a lower low than the previous candle (suggesting a potential liquidity grab below the previous swing low). This is expressed as close > (high + low) / 2 and low < low .
Sell Signal: A candle must close below its midpoint (bearish momentum) and have a higher high than the previous candle (indicating a potential liquidity grab above the previous swing high), expressed as close < (high + low) / 2 and high > high .
These conditions ensure the indicator targets candles that break recent structure to hunt stop losses while showing directional momentum.
Optional EMA Filter: A 50-period EMA (customizable) can be enabled to filter signals based on trend direction.
Buy signals are only generated if the EMA is trending upward (ema_value > ema_value ), and sell signals require a downward EMA trend (ema_value < ema_value ). This reduces noise by aligning entries with the broader market trend.
Liquidity Levels and Deletion Logic:
For a buy signal, a solid green line is drawn at the candle’s low, and a dotted green line at the 50% level of the lower wick (from the candle body’s bottom to the low).
For a sell signal, a solid red line is drawn at the candle’s high, and a dotted red line at the 50% level of the upper wick (from the body’s top to the high).
These lines extend to the right until the price crosses them, at which point they are deleted, indicating the liquidity at that level has been taken (e.g., stop losses triggered).
Alerts: The indicator includes alert conditions for buy and sell signals, notifying traders when a new setup is identified.
Underlying Concepts
The indicator is grounded in the concept of liquidity hunting, a strategy often employed by institutional traders. Markets frequently move to levels where stop losses are clustered—typically just beyond swing highs or lows—before reversing in the opposite direction. The "Enigma Sniper 369" targets these moves by identifying candles that break structure (e.g., a lower low or higher high) during high-volatility sessions, suggesting a potential sweep of stop losses. The 50% wick level acts as a secondary confirmation, as this midpoint often represents a zone where tighter stop losses are placed by retail traders. The optional EMA filter adds a trend-following element, ensuring entries are taken in the direction of the broader market momentum, which is particularly useful on lower timeframes like the 15-minute chart shown in the screenshots.
How to Use It
Here’s a step-by-step guide based on the provided usage example on the GBP/USD 15-minute chart:
Setup the Indicator: Add "Enigma Sniper 369" to your TradingView chart. Adjust the London and US session hours to match your timezone (e.g., London from 02:00 to 12:00 UTC, US from 13:00 to 22:00 UTC). Customize the EMA period (default 50) and line styles/colors if desired.
Identify Kill Zones: The indicator highlights the London session in light green and the US session in light purple, as seen in the screenshots. Focus on these periods for signals, as they are the most volatile and likely to produce liquidity grabs.
Wait for a Signal: Look for solid and dotted lines to appear during the kill zones:
Buy Setup: A solid green line at the swing low and a dotted green line at the 50% lower wick level indicate a potential buy. This suggests the market may have grabbed liquidity below the swing low and is now poised to move higher.
Sell Setup: A solid red line at the swing high and a dotted red line at the 50% upper wick level indicate a potential sell, suggesting liquidity was taken above the swing high.
Place Your Trade:
For a buy, set a buy limit order at the dotted green line (50% wick level), as this is a more conservative entry point. Place your stop loss just below the solid green line (swing low) to cover the full swing. For example, in the screenshots, the market retraces to the dotted line at 1.32980 after a liquidity grab below the swing low, triggering a buy limit order.
For a sell, set a sell limit order at the dotted red line, with a stop loss just above the solid red line.
Monitor Price Action: Once the price crosses a line, it is deleted, indicating the liquidity at that level has been taken. In the screenshots, after the buy limit is triggered, the market moves higher, confirming the setup. The caption notes, “The market returns and tags us in long with a buy limit,” highlighting this retracement strategy.
Additional Context: Use the indicator to identify liquidity levels that may be targeted later. For example, the screenshot notes, “If a new session is about to open I will wait for the grab liquidity to go long,” showing how the indicator can be used to anticipate future moves at session opens (e.g., London open at 1.32980).
Risk Management: Always set a stop loss below the swing low (for buys) or above the swing high (for sells) to protect against adverse moves. The 50% wick level helps tighten entries, improving the risk-reward ratio.
Practical Example
On the GBP/USD 15-minute chart, during the London session (02:00 UTC), the indicator identifies a buy setup with a solid green line at 1.32901 (swing low) and a dotted green line at 1.32980 (50% wick level). The market initially dips below the swing low, grabbing liquidity, then retraces to the dotted line, triggering a buy limit order. The price subsequently rises to 1.33404, yielding a profitable trade. The user notes, “The logic is in the last candle it provides new level to go long,” emphasizing the indicator’s ability to identify fresh levels after a liquidity sweep.
Customization Tips
Adjust the EMA period to suit your timeframe (e.g., a shorter period like 20 for faster signals on lower timeframes).
Modify the session hours to align with your broker’s timezone or specific market conditions.
Use the alert feature to get notified of new setups without constantly monitoring the chart.
Why It’s Useful for Traders
The "Enigma Sniper 369" stands out by combining session timing, momentum-based candle analysis, and liquidity hunting into a single tool. It provides clear, actionable levels for entries and stop losses, removes invalid signals dynamically, and aligns trades with high-probability market conditions. Whether you’re a scalper looking for quick moves during London open or a swing trader targeting session-based reversals, this indicator offers a structured, data-driven approach to trading.

Elliott Wave Noise FilterElliott Wave Noise Filter
Overview
The Elliott Wave Noise Filter is a specialized indicator for TradingView, designed to solve one of the biggest challenges in Elliott Wave analysis on lower timeframes: the identification of market noise. By combining multiple advanced filtering techniques, this indicator helps distinguish meaningful price action from random fluctuations.
The Problem
On lower timeframes—especially below 15 minutes—Elliott Wave analysis is significantly impacted by excessive market noise. This noise can lead to misinterpretation of wave structures, making it difficult to execute reliable trading decisions.
The Solution
The Elliott Wave Noise Filter utilizes four powerful methods to detect and filter noise:
ATR-Based Volatility Analysis: Identifies price movements too small to be structurally meaningful
Volume Confirmation: Filters out price moves that occur with insufficient volume
Trend Strength Measurement (ADX): Detects periods of weak trend activity, where noise tends to dominate
Fractal Pattern Recognition: Marks significant turning points that could be relevant for Elliott Wave analysis
Features
Visual Indicators
Background Coloring: Red indicates noise; green signifies a clear signal
Hull Moving Average: Smooths price action and highlights the prevailing trend
Fractal Markers: Triangles mark significant highs and lows
Status Panel: Displays current noise status and ADX value
Customization Options
ATR Period: Adjust the lookback period for ATR calculations
Noise Threshold: Defines the percentage of ATR below which a movement is considered noise
Volume Filter: Can be enabled or disabled
Volume Threshold: Sets the ratio to average volume for a move to be deemed significant
Hull MA Display and Length: Configure the moving average settings
ADX Parameters: Adjust trend strength sensitivity
Use Cases
For Elliott Wave Analysis
Eliminate noise to identify cleaner wave structures
Use fractal markers as potential wave endpoints
Reference the Hull MA for determining the broader trend
For General Trading
Identify high-noise periods to avoid low-quality setups
Spot clearer market phases for better entries
Assess price action quality through visual cues
Multi-Timeframe Approach
Apply the indicator across different timeframes for a comprehensive view
Prefer trading when both higher and lower timeframes align with consistent signals
Optimal Settings
For Very Short Timeframes (1–5 minutes)
Higher Noise Threshold (0.4–0.5)
Longer ATR Period (20–30)
Higher Volume Threshold (1.0–1.2)
For Medium Timeframes (15–60 minutes)
Medium Noise Threshold (0.2–0.3)
Standard ATR Period (14)
Standard Volume Threshold (0.8)
For Higher Timeframes (4h and above)
Lower Noise Threshold (0.1–0.2)
Shorter ATR Period (10)
Lower Volume Threshold (0.6–0.7)
Conclusion
The Elliott Wave Noise Filter is an essential tool for any Elliott Wave analyst or trader working on lower timeframes. By reducing noise and emphasizing significant market movements, it enables more precise analysis and potentially more profitable trading decisions.
Note: As with any technical indicator, the Elliott Wave Noise Filter should be used as part of a broader trading strategy and not as a standalone signal for trade execution.

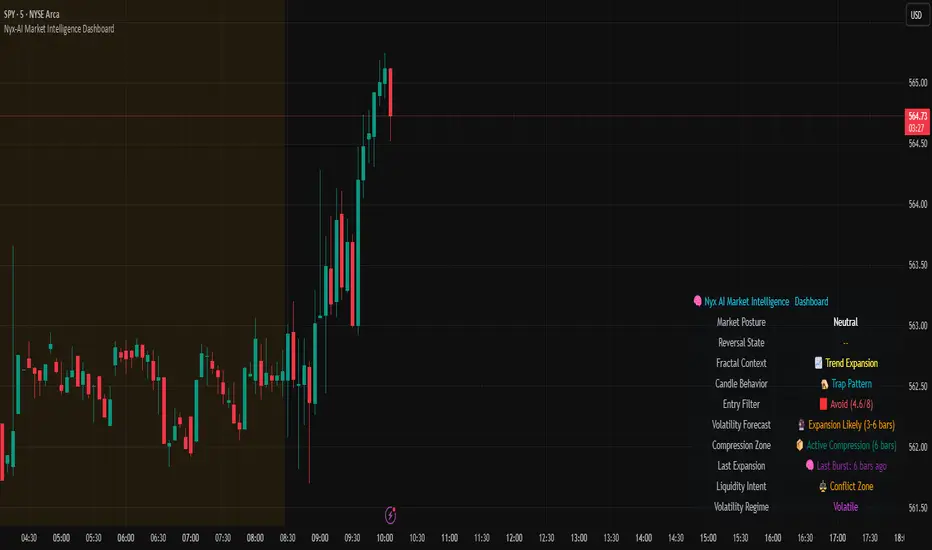
Nyx-AI Market Intelligence DashboardNyx AI Market Intelligence Dashboard is a non-signal-based environmental analysis tool that provides real-time insight into short-term market behavior. It is designed to help traders understand the quality of current price action, volume dynamics, volatility conditions, and structural behavior. It informs the trader whether the current market environment is supportive or hostile to trading and whether any active signal (from other tools) should be trusted, filtered, or avoided altogether.
Nyx is composed of seven intelligent modules. Each module operates independently but is visually unified through a floating dashboard panel on the chart. This panel renders live diagnostics every few bars, maintaining a low visual footprint without drawing overlays or modifying price.
Market Posture Engine
This module reads individual candlesticks using real-time candle anatomy to interpret directional bias and sentiment. It examines body-to-range ratio, wick imbalances, and compares them to prior bars. If the current candle is a large momentum body with minimal wick, it is interpreted as a directional thrust. If it is a small body with equal wicks, it is considered indecision. Engulfing patterns are used to detect potential liquidity tests. The system outputs a plain-text posture signal such as Building Bullish Intent, Bearish Momentum, Indecision Zone, Testing Liquidity (Up or Down), or Neutral.
Flow Reversal Engine
This module monitors short-term structural shifts and volume contraction to detect early signs of reversal or exhaustion. It looks for lower highs or higher lows paired with weakening volume and closing behavior that implies loss of momentum. It also monitors divergence between price and volume, as well as bar-to-bar momentum stalls (where highs and lows stop expanding). When these conditions are met, it outputs one of several states including Top Forming, Bottom Forming, Flow Divergence, Momentum Stall, or Neutral. This is useful for detecting inflection points before they manifest on trend indicators.
Fractal Context Engine
This engine compares the current bar’s range to its surrounding structural context. It uses a dynamic lookback length based on volatility. It determines whether the market is in expansion (strong directional trend), compression (shrinking range), or a transitional phase. A special case called Flip In Progress is triggered when the current high and low exceed the entire recent range, which often precedes sharp reversals or volatility expansion. The result is one of the following: Trend Expansion, Trend Breakdown, Sideways or Coil, Flip In Progress, or Expansion to Coil.
Candle Behavior Analyzer
This module analyzes the last five candles as a set to detect behavioral traits that a single candle may not reveal. It calculates average body and wick size, and counts how many recent candles show thrust (large body dominance), trap behavior (price returns inside wicks), or weakness (small bodies with high wick ratios). The module outputs one of the following behaviors: Aggressive Buying, Aggressive Selling, Trap Pattern, Trap During Coil, Low Participation, Low Energy, or Fakeout Candle. This helps the trader assess sentiment quality and the reliability of price movement.
Volatility Forecast and Compression Memory
This module predicts whether a breakout is likely based on recent compression behavior. It tracks how many of the last 10 bars had significantly reduced range compared to average. If a certain threshold is met without any recent large expansion bar, the system forecasts that a volatility expansion is likely in the near future. It also records how many bars ago the last high volatility impulse occurred and classifies whether current conditions are compressing. The outputs are Expansion Likely, Active Compression, and Last Burst memory, which provide breakout timing and energy insights.
Entry Filter
This module scores the current bar based on four adaptive criteria: body size relative to range, volume strength relative to average, current volatility versus historical volatility, and price position relative to a 20-period moving average. Each factor is scored as either 1 or 2. The total score is adjusted by a behavioral modifier that adds or subtracts a point if recent candles show aggression or trap behavior. Final scores range from 4 to 8 and are classified into Optimal, Mixed, or Avoid categories. This module is not a trade signal. It is a confluence filter that evaluates whether conditions are favorable for entry. It is particularly effective when layered with other indicators to improve precision.
Liquidity Intent Engine
This engine checks for price behavior around recent swing highs and lows. It uses adaptive pivots based on volatility to determine if price has swept above a recent high or below a recent low. This behavior is often associated with institutional liquidity hunts. If a sweep is detected and price has moved away from the sweep level, the engine infers directional intent and compares current distance to the high and low to determine which liquidity pool is more dominant. The output is Magnet Above, Magnet Below, or Conflict Zone. This is useful for anticipating directional bias driven by smart money activity.
Sticky Memory Tracking
To avoid flickering between states on low volatility or noisy price action, Nyx includes a sticky memory system. Each module’s output is preserved until a meaningful change is detected. For example, if Market Posture is Neutral and remains so for several bars, the previous non-neutral value is retained. This makes the dashboard more stable and easier to interpret without misleading noise.
Dashboard Rendering
All module outputs are displayed in a clean two-column panel anchored to any corner of the chart. Text values are color-coded, tooltips are added for context, and the data refreshes every few bars to maintain speed. The dashboard avoids clutter and blends seamlessly with other chart tools.
This tool is intended for informational and educational purposes only. It does not provide financial advice or trading signals. Nyx analyzes price, volume, structure, and volatility to offer context about the current market environment. It is not designed to predict future price movements or guarantee profitable outcomes. Traders should always use independent judgment and risk management. Past performance of any analysis logic does not guarantee future results.
BTC vs ALT Lag Detector [MEXC Overlay]This indicator monitors the price movement of Bitcoin (BTC) and compares it in real time to a customizable list of major altcoins on the MEXC exchange.
It helps you identify lagging altcoins — tokens that are underperforming or overperforming BTC’s price action over a selected timeframe. These temporary deviations can offer profitable entry or rotation opportunities, especially for scalpers, day traders, and arbitrage-style strategies.
Key Features:
- Real-time deviation detection between BTC and altcoins
- Customizable comparison timeframe: 1m, 6m, 12m, 30m, 1h, 4h, or 1d
- Deviation threshold alert: Highlights coins that lag BTC by more than 0.5%, 1%, 2%, or 3%
- Compact stats table embedded in the price chart
- Fully adjustable layout: Table position (Top/Bottom/Center + Left/Right), Font size (Tiny, Small, Medium)
- Built-in alert system when deviation exceeds your chosen threshold
How to Use It:
Set your desired timeframe for comparison (e.g., 1 hour).
Select a deviation threshold (e.g., 1.0%).
The table will show:
Each altcoin’s % change
BTC’s % change
The delta (deviation) vs BTC
Red highlights indicate alts whose deviation exceeded the threshold.
When at least one alt lags beyond your threshold, the indicator can trigger an alert — helping you capitalize on potential catch-up trades.
Please provide any feedback on it.

Another EMA trend indicator"Another EMA Trend Indicator" is a dynamic trend-following tool. Blending customizable Moving Averages (EMA or SMA) with an automated, visualized trade management system. It identifies bullish and bearish trend shifts based on short- and long-term MA crossovers, dynamically calculates optimal entry points, stop-losses, and take-profits, and visually manages trades on the chart with optional clouds, lines, and labels.
Main Features:
Moving Average Trend Detection:
Choice between EMA (Exponential Moving Average) or SMA (Simple Moving Average).
Two customizable lengths: a short MA and a long MA.
Detects bullish and bearish switches based on MA crossover events.
Entry, SL, and TP Calculation:
Entries are calculated dynamically after a signal using a combination of historical candle high/low analysis and a risk divider.
Stop-loss and take-profit levels are automatically set based on the trend's recent volatility and user-defined risk parameters.
Supports fixed or dynamic profit targets.
Risk Management Settings:
Define minimum and maximum acceptable profit percentages.
Set maximum stop-loss distance and apply a stop-loss multiplier for added flexibility.
Limit maximum trade duration to avoid endless open trades.
Trade Visualization:
Optional debug mode to display:
Entry, stop-loss, and take-profit lines.
Buy/sell signals via shapes on the chart.
Trend cloud between short and long MAs.
Historical trend levels for better visualization.
Dynamic Statistics Panel:
Real-time display of:
First trade date.
Total number of trades.
Number of profitable and losing trades.
Average and maximum trade duration.
Win rate and average profit/loss percentages.
Inputs:
MA Type: Choose between "EMA" or "SMA."
Short/Long MA Length: Customize lengths to control sensitivity.
Source: Apply to typical price values like hl2.
Risk Settings:
Minimum, maximum, and fixed profit percentages.
Stop-loss settings and risk dividers.
Trade Behavior Settings:
Max trade length.
Visualization Toggles:
Show/hide debug labels, lines, clouds.
Use Case:
This indicator is ideal for trend-following traders who prefer a semi-automated trading framework. It helps maintain consistency in entries and exits while visualizing important trend dynamics and trade health directly on the chart.
Best suited for swing trading crypto coins.

SMC Entry Signals MTF v2📘 User Guide for the SMC Entry Signals MTF v2 Indicator
🎯 Purpose of the Indicator
This indicator is designed to identify reversal entry points based on Smart Money Concepts (SMC) and candlestick confirmation. It’s especially useful for traders who use:
Imbalance zones, order blocks, breaker blocks
Liquidity grabs
Multi-timeframe confirmation (MTF)
📈 How to Use the Signals on the Chart
✅ LONG Signal (green triangle below the candle):
Conditions:
Price is in a discount zone (below the FIB 50% level)
A bullish engulfing candle appears
A bullish Order Block (OB) or Breaker Block is detected
There’s an upward imbalance
A bullish OB is confirmed on the higher timeframe
➡️ How to act:
Consider entering long on the current or next candle.
Place your stop-loss below the OB or the nearest swing low.
Take profit at the nearest liquidity zone or premium area (above FIB 50%).
🔻 SHORT Signal (red triangle above the candle):
Conditions:
Price is in a premium zone (above FIB 50%)
A bearish engulfing candle appears
A bearish OB or Breaker Block is detected
There’s a downward imbalance
A bearish OB is confirmed on the higher timeframe
➡️ How to act:
Consider short entry after the signal.
Place your stop-loss above the OB or swing high.
Target the discount zone or the next liquidity pocket.
⚙️ Recommended Settings by Trading Style
Trading Style Suggested Settings Notes
Intraday (1–15m) fibLookback = 20–50, obLookback = 5–10, htf_tf = 1H/4H Fast signals. Use Discount/Premium + Engulfing.
Swing/Position (1H–1D) fibLookback = 50–100, obLookback = 10–20, htf_tf = 1D/1W Higher trust in MTF confirmation. Ideal with fundamentals.
Scalping (1m) fibLookback = 10–20, obLookback = 3–5, htf_tf = 15m/1H Remove Breaker and MTF for quick reaction trades.
🧠 Best Practices for Traders
Trend Filtering:
Use EMAs or volume to confirm the current trend.
Take longs only in uptrends, shorts in downtrends.
Liquidity Zones:
Use this indicator after liquidity grabs.
OBs and Breakers often appear right after stop hunts.
Combine with Manual Zones:
This works best when paired with manually drawn OBs and key levels.
Backtest the Signals:
Use Bar Replay mode on TradingView to test past signals.
🧪 Example Trade Setup
Example on BTCUSDT 15m:
Price drops into the discount zone.
A green triangle appears (bullish engulfing + OB + imbalance + HTF OB).
You enter long, stop below the OB, target the premium zone.
🎯 This type of setup often gives a risk/reward ratio of 1:2 or better — profitable even with a 40% win rate.
⏰ Alerts & Automation
Enable alerts:
"SMC Long Entry" — fires when a long signal appears.
"SMC Short Entry" — fires when a short signal appears.
You can integrate this with bots via webhook, like:
TradingConnector, 3Commas, Alertatron, etc.
✅ What This Indicator Gives You
High-probability entries using SMC logic
Customizable filters for entry logic
Multi-timeframe confirmation for stronger setups
Suitable for both intraday and swing trading

Trader Affirmation Stream – Animated + Styling(TraderKessy)The Trader Affirmation Stream is a minimalist overlay indicator designed to keep you focused, motivated, and mentally sharp during your trading sessions. It displays a rotating series of positive trading affirmations—gently animated with a fading effect—right on your chart to help reinforce discipline, patience, and consistency.
Key Features:
Sequential Affirmations
A curated list of motivational trading affirmations that update every N bars, helping you stay grounded and intentional throughout your trading day.
Smooth Fade Animation
Subtle pulse-like fade-in and fade-out transitions give the affirmations a calm, professional feel without disrupting your analysis.
Custom Styling Options
Choose your preferred text size (small, normal, large, or huge) and set the base transparency to match your chart's aesthetic.
Clean Chart Placement
Displayed at the top center of your chart for maximum visibility without interfering with price action or indicators.
Why Use This?
Trading isn’t just technical—it’s deeply psychological. This tool acts like a gentle mental coach, reminding you of your best trading behaviors:
Follow your plan.
Wait for quality setups.
Focus on process, not outcome.
Trust your edge.
A simple, powerful tool to help you develop the mindset of a consistently profitable trader.

Advanced Volatility Activator [AlgoFuego]🔵 Advanced Volatility Activator (AVA)
The Advanced Volatility Activator (AVA) is an innovative technical analysis indicator designed to help traders identify and react to market volatility.
By blending adaptive volatility metrics with a refined moving‑average algorithm, the indicator offers traders a dynamically responsive framework for trend identification.
🔸Dynamic Volatility Analysis
The indicator examines the high and low prices of each candle to evaluate market movements.
It categorizes price movements into different states (e.g., outside bars, inside bars, higher highs, lower lows) to provide insight into market conditions, then calculates price averages for bars that make a new high or low price.
This moving average serves as a baseline for volatility adjustments, aligning the tool with well-established technical indicators.
🔸 Customizable Sensitivity
Through the input, users can fine‑tune how responsive the moving average is to price fluctuations.
A higher sensitivity setting makes the moving average less responsive to rapid market changes, enabling the indicator to adapt to different market environments and trading styles.
🔸Integrated Multi-Timeframe Table
A distinctive feature of this indicator is its integrated table display, which provides a summary signal across multiple time frames.
This table serves as a quick reference guide for traders to compare market trends across different time periods.
This at‑a‑glance view empowers traders to confirm trend direction from intraday to higher‑timeframe perspectives without switching charts.
🔹 How It Works
1. Initial Setup
The indicator defines two baseline values: the current high and the current low.
These serve as reference points for all subsequent price comparisons and moving‑average calculations.
2. Volatility Smoothing
The indicator calculates the smoothed volatility range using an exponential moving average (EMA) of the absolute differences between successive prices.
This helps smooth out the erratic price movements of the simple moving average and improves the measurement of volatility.
3. Trend Probability Calculation
A Simple Moving Average (SMA) of the combined high‑low series is calculated.
That SMA is then compared against the smoothed volatility range from step 2 to estimate how likely it is that a genuine trend is forming.
4. Directional Counters
Two counters: bullish and bearish, track consecutive moves up or down.
Whichever counter increases more rapidly signals the prevailing market bias.
5. Drawing the Trend Line
Finally, the code generates a trend line that dynamically adapts to real‑time volatility.
The result is a clear, responsive visual that mirrors actual market behavior.
🔹 Visual & Table Customization
Color Coding
Upward and downward trends are easily distinguished by customizable color settings, enhancing visual clarity for decision-making.
Upward Movements
A lighter blue hue indicates an upward trend.
Downward Movements
An orange hue indicates a downward trend.
Candlestick Highlighting
The indicator plots candlesticks with the same trendline color so that the chart maintains a consistent visual theme, thus reinforcing the signal's clarity.
Table Configuration and Customization
This additional layer of information helps traders compare signals between different time horizons, which is essential for a comprehensive multi-timeframe strategy.
The code supports multiple user-defined timeframes (e.g., 15, 60, 240, and 480 minutes).
For each timeframe, the indicator queries the market data to determine if the signal is Bullish, Bearish, or No signal.
Visibility and Positioning
The table can be toggled on or off via a user input. Its position on the chart is also customizable, ranging from top-right to bottom-left, allowing flexibility based on personal chart layouts.
Color Settings
The table cells are populated with both the timeframe labels and the corresponding market signal text (e.g., "Bullish", "Bearish", "No signal"). Background colors for each signal cell change dynamically depending on the current state, making it easy for traders to assess market sentiment at a glance.
Users can adjust colors for the background, borders, and text of the table itself.
Moreover, specific colors are set to denote bullish signals (blue), bearish signals (orange), or no signal (default dark theme).
🔹 How to use
Before entering long trades, ensure that prices are above the Advanced Volatility Activator Line and the line indicates an upward movement.
🔹 Practical Benefits
Enhanced Market Awareness
By highlighting periods of low volatility, the indicator can serve as an early warning system for potential market reversals or breakouts.
The supplementary table offers a high-level overview of these signals across multiple timeframes, which aids in confirming trends or reversals.
Customizable and Versatile
Both the indicator and the table are highly customizable. Traders can fine-tune the sensitivity, adjust periods for the moving average, select color schemes, and choose their preferred timeframes, all allowing for a tool that adapts to various trading styles and market conditions.
Intuitive Visualization
The clearly defined color-coded trendline provides an immediate visual cue, making it easier for traders to interpret market trends at a glance.
Whether you are a short-term trader needing precise entry and exit points or a multi-timeframe analyst looking for broader trend confirmation, this indicator provides valuable insights on both a micro- and macro-level.
🔹 Disclosure
While this indicator is useful and ideally suited for active traders who require precise, customizable signals to navigate rapidly changing markets, it's critical to understand that past performance is not necessarily indicative of future results, and there are many more factors that go into being a profitable trader.

Crosby Ratio | QuantumResearch ⚖️ Crosby Ratio | QuantumResearch
A Heikin-Ashi Smoothed Momentum Oscillator for Trend Strength & Market Rotation
Inspired by the Original Work of Bitcoin Magazine Pro
🔗 www.bitcoinmagazinepro.com
📘 Overview
The Crosby Ratio, as originally conceptualized by Bitcoin Magazine Pro, is a powerful tool used to evaluate the momentum and directional strength of price movement by analyzing the slope of market trends in degrees.
This enhanced implementation by QuantumResearch builds on the original concept with a Pine Script version tailored for trading charts, integrating Heikin-Ashi smoothing, ATR scaling, and customizable visual modes to fit traders' unique styles.
🧠 What Is the Crosby Ratio?
At its core, the Crosby Ratio uses angular measurement to quantify price movement — translating price trend strength into degrees. This approach allows traders to:
📈 Identify when the market is exhibiting strong upward or downward pressure
🚨 Spot overextended or overheated trend conditions
⚖ Filter out short-term noise and focus on macro momentum
🔍 1. Key Innovations by QuantumResearch
✅ Heikin-Ashi Smoothing: Reduces noise and stabilizes price action before computing momentum angles
✅ Custom atan2() Angular Function: Measures the directional angle between smoothed price changes and ATR-based scaling
✅ Dynamic Threshold Bands: Color-coded zones highlight overbought/oversold momentum regions
✅ Fully Customizable Palette: Choose from 8 visual themes with automatic color adaptation
📊 2. Interpretation Guide
Crosby Value Interpretation
> +18° 🚀 Strong bullish trend acceleration
+13° to +18° 📈 Moderate upward momentum
-9° to +13° ⚖ Neutral/transition phase
-15° to -9° 📉 Moderate bearish pressure
< -15° 🛑 Strong bearish acceleration
The indicator also features background shading when values exceed key thresholds, improving visual clarity during trend inflection points.
📌 Ideal Use Cases
🔄 Rotational Momentum Strategies: Spot the strongest assets during rapid shifts
⚡ Breakout Filtering: Confirm whether breakouts have directional strength
🧘 Noise Reduction: Heikin-Ashi smoothing filters chaotic wicks, especially in crypto
📉 Bearish Exhaustion Detection: Quickly identify when bearish momentum might be overdone
🔗 Original Inspiration & Acknowledgment
This indicator draws its core idea and naming convention from the original Crosby Ratio developed and introduced by Bitcoin Magazine Pro in their excellent write-up:
🔗 The Crosby Ratio – Bitcoin Magazine Pro
Their work on quantifying market sentiment via angle-based momentum inspired this script adaptation for TradingView with added visual features, smoothing techniques, and alerts.
⚠️ Disclaimer
This indicator is a momentum oscillator and should be used in conjunction with other confirmation tools. Market dynamics can vary, and no single metric ensures profitable trades. Always apply proper risk management.

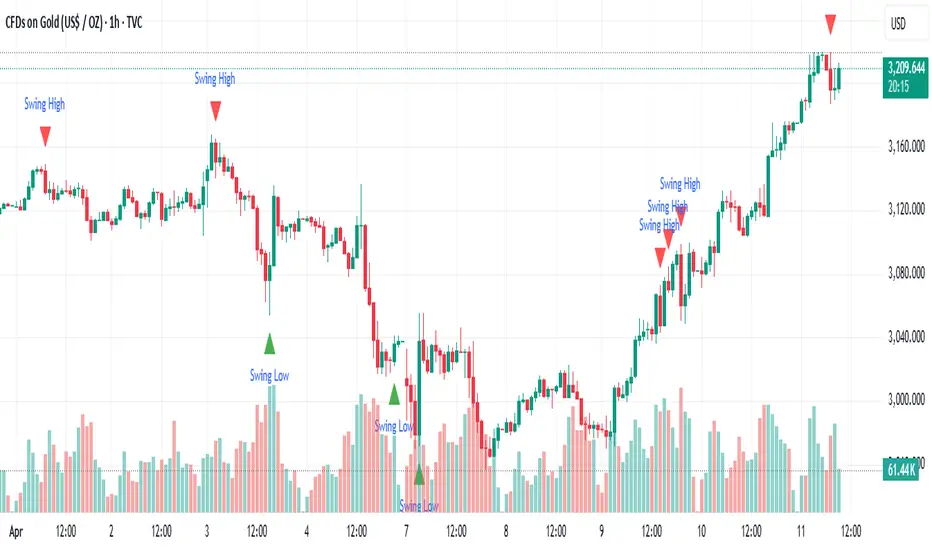
Rendon1 Swing Market Turns**Swing Market Turns Indicator**
This indicator identifies potential swing highs and swing lows by integrating Relative Strength Index (RSI), volume confirmation, and higher timeframe (HTF) levels to accurately detect market reversals and turning points. Specifically optimized for swing traders, this tool aims to pinpoint moments when price momentum is shifting, providing clear signals for trade entries and exits.
### How It Works:
- **RSI Divergence:** Detects momentum shifts through RSI overbought and oversold conditions.
- **Higher Timeframe Levels:** Confirms reversals using support and resistance levels from higher timeframes.
- **Volume Confirmation:** Ensures stronger validity of signals by checking if current volume exceeds the moving average of recent volume.
### Key Features:
- Visual labels on chart clearly indicating potential swing highs and lows.
- Customizable RSI period, RSI overbought/oversold thresholds, volume moving average length, and higher timeframe selections.
- Built-in alert conditions for immediate notifications when swing opportunities are detected.
### Recommended Use:
- Ideal for traders focusing on swing trading strategies, particularly those looking for high-probability turning points.
- Effective across multiple assets including forex, stocks, commodities, and crypto.
- Suitable for various intraday and higher timeframes, with customization options available.
### Settings:
- **RSI Period:** Adjust the sensitivity of RSI calculation.
- **Higher Timeframe:** Select the timeframe used for support/resistance reference.
- **RSI Overbought/Oversold:** Customize thresholds defining extreme RSI values.
- **Volume MA Length:** Specify the length for volume moving average calculation.
Feel free to customize the parameters to best fit your trading style and asset of choice.
**Disclaimer:**
This indicator does not guarantee profitable trades and should be used in conjunction with proper risk management and additional analysis methods.
Trend Confirmation StrategyComprehensive Trend Confirmation System
Indicator Features (Professional Description):
Comprehensive Trend Confirmation System is a versatile indicator meticulously designed to identify and confirm trend-based trading opportunities with exceptional efficiency. By seamlessly integrating analysis from a suite of leading technical tools, it aims to provide superior accuracy and reliability for informed trading decisions.
Key Features:
Intelligent Trend Identification: A robust trend analysis system that considers:
Adjustable Moving Averages: Utilizes three customizable moving average periods (fast, medium, slow) with user-selectable lengths and types (SMA, EMA, WMA, VWMA) to accurately determine the prevailing trend across different timeframes.
In-depth Price Action Analysis: Examines the formation of Higher Highs/Higher Lows (uptrend) and Lower Highs/Lower Lows (downtrend) to validate price direction.
Average Directional Index (ADX) with Adjustable Threshold: Measures the strength of a trend and employs the comparison between +DI and -DI to pinpoint the dominant momentum, featuring a customizable threshold to filter out weak signals.
Multi-Factor Signal Confirmation System: Enhances the reliability of trading signals through verification from four distinct confirmation tools:
Volume Analysis with Average Reference: Assesses whether trading volume supports price movements by comparing it to historical averages.
Relative Strength Index (RSI) with Reference Levels: Measures price momentum and identifies overbought/oversold conditions to confirm trend strength.
Moving Average Convergence Divergence (MACD) Divergence and Crossovers: Detects shifts in momentum and potential trend changes through the relationship between the MACD line and the Signal line.
Stochastic Oscillator with Reference Levels: Measures the current price's position relative to its historical range to evaluate overbought/oversold conditions and potential reversal opportunities.
Intelligent Signal Generation Logic:
Buy Signal: Triggered when a strong uptrend is identified (meeting defined criteria) and confirmed by at least three out of the four confirmation tools.
Sell Signal: Triggered when a strong downtrend is identified (meeting defined criteria) and confirmed by at least three out of the four confirmation tools.
User-Friendly Visualizations:
Moving Averages (MA): Displays three MA lines on the chart with user-configurable colors (default: fast-blue, medium-orange, slow-red) for easy visual trend analysis.
Clear Buy and Sell Signal Symbols: Presents distinct green upward-pointing triangles for buy signals and red downward-pointing triangles for sell signals at the corresponding candlestick.
Dynamic Candlestick Color Coding: Candlesticks are dynamically colored green upon a buy signal and red upon a sell signal for quick identification of trading opportunities.
Highly Customizable Parameters: Users have extensive control over the indicator's parameters, including:
Lengths and types of Moving Averages.
Length and Threshold of the ADX.
Length of the RSI.
Parameters for the MACD (Fast Length, Slow Length, Signal Length).
Parameters for the Stochastic Oscillator (%K Length, %D Length, Smoothing).
Ideal For:
Traders seeking a robust tool to accurately identify and confirm market trends.
Individuals aiming to reduce false signals and enhance the precision of their trading decisions.
Traders employing trend-following strategies in markets with clear directional movement.
Important Note:
While Comprehensive Trend Confirmation System is engineered to improve trading accuracy, no indicator can guarantee 100% profitable trades. Users are advised to utilize this indicator in conjunction with relevant fundamental analysis and sound risk management practices for optimal trading outcomes.

Quantify [Trading Model] | FractalystNote: In this description, "TM" refers to Trading Model (not trademark) and "EM" refers to Entry Model
What’s the indicator’s purpose and functionality?
You know how to identify market bias but always struggle with figuring out the best exit method, or even hesitating to take your trades?
I've been there. That's why I built this solution—once and for all—to help traders who know the market bias but need a systematic and quantitative approach for their entries and trade management.
A model that shows you real-time market probabilities and insights, so you can focus on execution with confidence—not doubt or FOMO.
How does this Quantify differentiate from Quantify ?
Have you managed to code or even found an indicator that identifies the market bias for you, so you don’t have to manually spend time analyzing the market and trend?
Then that’s exactly why you might need the Quantify Trading Model.
With the Trading Model (TM) version, the script automatically uses your given bias identification method to determine the trend (bull vs bear and neutral), detect the bias, and provide instant insight into the trades you could’ve taken.
To avoid complications from consecutive signals, it uses a kNN machine learning algorithm that processes market structure and probabilities to predict the best future patterns.
(You don’t have to deal with any complexity—it’s all taken care of for you.)
Quantify TM uses the k-Nearest Neighbors (kNN) machine learning algorithm to learn from historical market patterns and adapt to changing market structures. This means it can recognize similar market conditions from the past and apply those lessons to current trading decisions.
On the other hand, Quantify EM requires you to manually select your directional bias. It then focuses solely on generating entry signals based on that pre-determined bias.
While the entry model version (EM) uses your manual bias selection to determine the trend, it then provides insights into trades you could’ve taken and should be taking.
Trading Model (TM)
- Uses `input.source()` to incorporate your personal methodology for identifying market bias
- Automates everything—from bias detection to entry and exit decisions
- Adapts to market bias changes through kNN machine learning optimization
- Reduces human intervention in trading decisions, limiting emotional interference
Entry Model (EM)
- Focuses specifically on optimizing entry points within your pre-selected directional bias
- Requires manual input for determining market bias
- Provides entry signals without automating alerts or bias rules
Can the indicator be applied to any market approach/trading strategy?
Yes, if you have clear rules for identifying the market bias, then you can code your bias detection and then use the input.source() user input to retrieve the direction from your own indicator, then the Quantify uses machine-learning identify the best setups for you.
Here's an example:
//@version=6
indicator('Moving Averages Bias', overlay = true)
// Input lengths for moving averages
ma10_length = input.int(10, title = 'MA 10 Length')
ma20_length = input.int(20, title = 'MA 20 Length')
ma50_length = input.int(50, title = 'MA 50 Length')
// Calculate moving averages
ma10 = ta.sma(close, ma10_length)
ma20 = ta.sma(close, ma20_length)
ma50 = ta.sma(close, ma50_length)
// Identify bias
var bias = 0
if close > ma10 and close > ma20 and close > ma50 and ma10 > ma20 and ma20 > ma50
bias := 1 // Bullish
bias
else if close < ma10 and close < ma20 and close < ma50 and ma10 < ma20 and ma20 < ma50
bias := -1 // Bearish
bias
else
bias := 0 // Neutral
bias
// Plot the bias
plot(bias, title = 'Identified Bias', color = color.blue,display = display.none)
Once you've created your custom bias indicator, you can integrate it with Quantify :
- Add your bias indicator to your chart
- Open the Quantify settings
- Set the Bias option to "Auto"
- Select your custom indicator as the bias source
The machine learning algorithms will then analyze historical price action and identify optimal setups based on your defined bias parameters. Performance statistics are displayed in summary tables, allowing you to evaluate effectiveness across different timeframes.
Can the indicator be used for different timeframes or trading styles?
Yes, regardless of the timeframe you’d like to take your entries, the indicator adapts to your trading style.
Whether you’re a swing trader, scalper, or even a position trader, the algorithm dynamically evaluates market conditions across your chosen timeframe.
How Quantify Helps You Trade Profitably?
The Quantify Trading Model offers several powerful features that can significantly improve your trading profitability when used correctly:
Real-Time Edge Assessment
It displays real-time probability of price moving in your favor versus hitting your stoploss
This gives you immediate insight into risk/reward dynamics before entering trades
You can make more informed decisions by knowing the statistical likelihood of success
Historical Edge Validation
Instantly shows whether your trading approach has demonstrated an edge in historical data
Prevents you from trading setups that historically haven't performed well
Gives confidence when entering trades that have proven statistical advantages
Optimized Position Sizing
Analyzes each setup's success rate to determine the adjusted Kelly criterion formula
Customizes position sizing based on your selected maximum drawdown tolerance
Helps prevent account-destroying losses while maximizing growth potential
Advanced Exit Management
Utilizes market structure-based trailing stop-loss mechanisms
Maximizes the average risk-reward ratio profit per winning trade
Helps capture larger moves while protecting gains during market reversals
Emotional Discipline Enforcement
Eliminates emotional bias by adhering to your pre-defined rules for market direction
Prevents impulsive decisions by providing objective entry and exit signals
Creates psychological distance between your emotions and trading decisions
Overtrading Prevention
Highlights only setups that demonstrate positive expectancy
Reduces frequency of low-probability trades
Conserves capital for higher-quality opportunities
Systematic Approach Benefits
By combining machine learning algorithms with your personal bias identification methods, Quantify helps transform discretionary trading approaches into more systematic, probability-based strategies.
What Entry Models are used in Quantify Trading Model version?
The Quantify Trading Model utilizes two primary entry models to identify high-probability trade setups:
Breakout Entry Model
- Identifies potential trade entries when price breaks through significant swing highs and swing lows
- Captures momentum as price moves beyond established trading ranges
- Particularly effective in trending markets when combined with the appropriate bias detection
- Optimized by machine learning to filter false breakouts based on historical performance
Fractals Entry Model
- Utilizes fractal patterns to identify potential reversal or continuation points
- Also uses swing levels to determine optimal entry locations
- Based on the concept that market structure repeats across different timeframes
- Identifies local highs and lows that form natural entry points
- Enhanced by machine learning to recognize the most profitable fractal formations
- These entry models work in conjunction with your custom bias indicator to ensure trades are taken in the direction of the overall market trend. The machine learning component analyzes historical performance of these entry types across different market conditions to optimize entry timing and signal quality.
How Does This Indicator Identify Market Structure?
1. Swing Detection
• The indicator identifies key swing points on the chart. These are local highs or lows where the price reverses direction, forming the foundation of market structure.
2. Structural Break Validation
• A structural break is flagged when a candle closes above a previous swing high (bullish) or below a previous swing low (bearish).
• Break Confirmation Process:
To confirm the break, the indicator applies the following rules:
• Valid Swing Preceding the Break: There must be at least one valid swing point before the break.
3. Numeric Labeling
• Each confirmed structural break is assigned a unique numeric ID starting from 1.
• This helps traders track breaks sequentially and analyze how the market structure evolves over time.
4. Liquidity and Invalidation Zones
• For every confirmed structural break, the indicator highlights two critical zones:
1. Liquidity Zone (LIQ): Represents the structural liquidity level.
2. Invalidation Zone (INV): Acts as Invalidation point if the structure fails to hold.
How does the trailing stop-loss work? what are the underlying calculations?
A trailing stoploss is a dynamic risk management tool that moves with the price as the market trend continues in the trader’s favor. Unlike a fixed take profit, which stays at a set level, the trailing stoploss automatically adjusts itself as the market moves, locking in profits as the price advances.
In Quantify, the trailing stoploss is enhanced by incorporating market structure liquidity levels (explain above). This ensures that the stoploss adjusts intelligently based on key price levels, allowing the trader to stay in the trade as long as the trend remains intact, while also protecting profits if the market reverses.
What is the Kelly Criterion, and how does it work in Quantify?
The Kelly Criterion is a mathematical formula used to determine the optimal position size for each trade, maximizing long-term growth while minimizing the risk of large drawdowns. It calculates the percentage of your portfolio to risk on a trade based on the probability of winning and the expected payoff.
Quantify integrates this with user-defined inputs to dynamically calculate the most effective position size in percentage, aligning with the trader’s risk tolerance and desired exposure.
How does Quantify use the Kelly Criterion in practice?
Quantify uses the Kelly Criterion to optimize position sizing based on the following factors:
1. Confidence Level: The model assesses the confidence level in the trade setup based on historical data and sample size. A higher confidence level increases the suggested position size because the trade has a higher probability of success.
2. Max Allowed Drawdown (User-Defined): Traders can set their preferred maximum allowed drawdown, which dictates how much loss is acceptable before reducing position size or stopping trading. Quantify uses this input to ensure that risk exposure aligns with the trader’s risk tolerance.
3. Probabilities: Quantify calculates the probabilities of success for each trade setup. The higher the probability of a successful trade (based on historical price action and liquidity levels), the larger the position size suggested by the Kelly Criterion.
How can I get started to use the indicator?
1. Set Your Market Bias
• Choose Auto.
• Select the source you want Quantify to use as for bias identification method (explained above)
2. Choose Your Entry Timeframes
• Specify the timeframes you want to focus on for trade entries.
• The indicator will dynamically analyze these timeframes to provide optimal setups.
3. Choose Your Entry Model and BE/TP Levels
• Choose a model that suits your personality
• Choose a level where you'd like the script to take profit or move stop-loss to BE
4. Set and activate the alerts
What tables are used in the Quantify?
• Quarterly
• Monthly
• Weekly
Terms and Conditions | Disclaimer
Our charting tools are provided for informational and educational purposes only and should not be construed as financial, investment, or trading advice. They are not intended to forecast market movements or offer specific recommendations. Users should understand that past performance does not guarantee future results and should not base financial decisions solely on historical data.
Built-in components, features, and functionalities of our charting tools are the intellectual property of @Fractalyst Unauthorized use, reproduction, or distribution of these proprietary elements is prohibited.
- By continuing to use our charting tools, the user acknowledges and accepts the Terms and Conditions outlined in this legal disclaimer and agrees to respect our intellectual property rights and comply with all applicable laws and regulations.
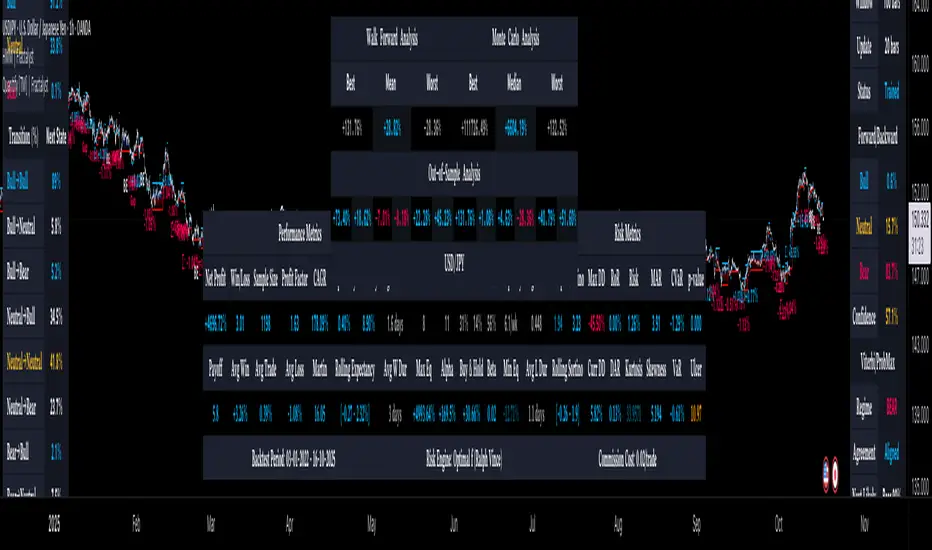
Breaking Structures (javieresfeliz)This TradingView script is designed to identify market structure changes, using a break of highs and lows approach, as well as technical indicators such as ATR, RSI, and EMAs (Exponential Moving Averages). It is aimed at detecting bullish and bearish trends, signaling possible entry and exit points based on various factors. It also offers additional confirmations to avoid false signals and provides a clear visualization of buy and sell signals.
Main Features:
Indicators Used:
ATR (Average True Range): Used to calculate a volatility range, which helps set stop-loss levels and price targets based on the current market volatility.
EMAs (50 and 200): Exponential Moving Averages (EMAs) are used to determine the short-term and long-term trends. The 50-period EMA is used to identify the short-term trend, while the 200-period EMA is used to identify the long-term trend.
RSI (Relative Strength Index): Used to identify overbought or oversold conditions in the market, providing additional buy or sell signals.
Volume: Used to confirm the validity of a signal. An increase in volume can confirm a structure break and provide more reliability to the signal.
Break of Structure Detection (BOS):
Bullish Break: Generated when the price surpasses previous highs.
Bearish Break: Generated when the price falls below previous lows.
Change of Character (CHOCH):
Bullish Trend: Defined by a close above the open and above the 50 EMA.
Bearish Trend: Defined by a close below the open and below the 50 EMA.
Buy and Sell Conditions:
Buy (Long): Activated when several conditions are met, including a bullish change of character, a bullish structure break, the price closing above the previous value plus a multiple of the ATR, and additional confirmations from RSI and volume.
Sell (Short): Activated when several conditions are met, including a bearish change of character, a bearish structure break, the price closing below the previous value minus a multiple of the ATR, with additional confirmations from RSI and volume.
Entry and Exit Signals:
Long Entry (Buy): Executed when the buy conditions are met.
Short Entry (Sell): Executed when the sell conditions are met.
Position Close: Positions are closed when the price crosses below (for long positions) or above (for short positions) the 50 EMA.
Historical Highs and Lows Lines:
The script draws lines of historical highs and lows from the last 288 and 60 periods to show key support and resistance levels on the chart.
Signal Table Across Multiple Timeframes:
The script displays a table in the top-right corner of the chart with indicators like the EMA trend, RSI value, and MACD histogram for timeframes of 1 minute, 5 minutes, 30 minutes, 1 hour, 4 hours, daily, and weekly.
Precautions:
Does not guarantee profits: Although the script is designed to detect structure breaks and possible trend changes, it does not guarantee 100% profitable signals. The market is always subject to risk and unpredictable volatility.
Requires adjustments for each asset: Parameters such as ATR length and EMA lengths should be adjusted according to the asset being analyzed and market conditions.
Use of additional confirmations: To reduce false signals, the script uses additional confirmations like RSI and volume, but it is always recommended to perform additional analysis before making trading decisions.
Changing trends: The change of character (CHOCH) can be a useful indicator, but it can give false signals in highly volatile markets or during prolonged consolidations.
Relies on historical data: This script relies on historical data to identify highs and lows. It does not consider fundamental events that may significantly impact the market.
Requires constant monitoring: Although the signals are automated, it is important to monitor open positions and make adjustments if market conditions change.
Risk of false signals: In low liquidity markets or consolidations, structure breaks can be false, so it’s recommended to pay attention to any additional confirmation signals or use a proper risk management strategy.

Multi-MA Strategy Analyzer with BacktestMulti-MA Strategy Analyzer with Backtest
This TradingView Pine Script indicator is designed to analyze multiple moving averages (SMA or EMA) dynamically and identify the most profitable one based on historical performance.
Features
Dynamic MA Range:
Specify a minLength, maxLength, and step size.
Automatically calculates up to 20 MAs.
Custom MA Calculation:
Uses custom SMA and EMA implementations to support dynamic length values.
Buy/Sell Logic:
Buy when price crosses above a MA.
Sell when price crosses below.
Supports both long and short trades.
Performance Tracking:
Tracks PnL, number of trades, win rate, average profit, and drawdown.
Maintains individual stats for each MA.
Best MA Detection:
Automatically highlights the best-performing MA.
Optional showBestOnly toggle to focus only on the best line and its stats.
Visualization:
Up to 20 plot() calls (static) for MAs.
Green highlight for the best MA.
Color-coded result table and chart.
Table View
When showBestOnly = false, the table displays all MAs with stats.
When showBestOnly = true, the table displays only the best MA with a summary row.
Includes:
Best MA length
Total PnL
Number of trades
Win rate
Avg PnL per trade
Max Drawdown
Configuration
minLength (default: 10)
maxLength (default: 200)
step (default: 10)
useEMA: Toggle between EMA and SMA
showBestOnly: Focus on best-performing MA only
Notes
MA plotting is static, limited to 20 total.
Table supports highlighting and is optimized for performance.
Script is structured to run efficiently using arrays and simple int where required.
Potential Extensions
Add visual buy/sell arrows
Export stats to CSV
Strategy tester conversion
Custom date range filtering for backtesting
Author: Muhammad Wasim
Version: 1.0

MTF TRIX Divergence Pro: Hidden & Regular Pattern DetectionTRIX Divergence Pro: Multi-Timeframe Analysis with Hidden & Regular Pattern Detection
📊 This TRIX indicator with extended features enables you to analyze price action across multiple timeframes with divergence detection capabilities.
🔍 Multi-Timeframe Analysis
View TRIX simultaneously across three timeframes:
• Current Timeframe - For primary analysis
• Higher Timeframe - To identify the overall market trend
• Lower Timeframe - For precise entry timing
🔮 Divergence Detection
This indicator identifies four types of divergences:
• Regular Bullish Divergence (Yellow) ⬆️
Price makes lower lows but TRIX makes higher lows
Indication: Potential end of downtrend
• Regular Bearish Divergence (Blue) ⬇️
Price makes higher highs but TRIX makes lower highs
Indication: Potential end of uptrend
• Hidden Bullish Divergence (Green) ↗️
Price makes higher lows but TRIX makes lower lows
Indication: Potential buying opportunity during price correction
• Hidden Bearish Divergence (Red) ↘️
Price makes lower highs but TRIX makes higher highs
Indication: Potential selling opportunity during temporary price recovery
⚙️ Advanced Features
• Smart scoring system to filter out weak signals
• Customizable timeframe display (current, higher, lower, or all)
• Divergence detection on TRIX signal line
• Option to show only the last divergence to reduce chart clutter
• Adjustable divergence line thickness and style
• Minimum price and oscillator deviation filters to reduce noise
📈 Trading Strategies
“Trend Surfing” Strategy 🌊
• Use higher timeframe TRIX to identify the main trend
• Wait for a price correction in the trend direction
• Look for hidden divergence on the current timeframe
• Enter when price may resume in the main trend direction
“Trend Reversal Hunter” Strategy 🔄
• Identify regular divergence on the current timeframe
• Confirm it with regular divergence on the higher timeframe
• Wait for TRIX to cross its signal line
• Consider a counter-trend position with proper risk management
⚡ Recommended Settings
Balanced Profile 🔋
• TRIX Length: 17
• Signal Length: 14
• Pivot Period: 5
• TRIX Display: CURRENT+UPPER
• TRIX Divergence: CURRENT+UPPER
• Min Bars Between Divs: 10
• Min Div Strength: 1.5
• Use Scoring System: yes
• Min Score: 3.5
Trend Following Profile 🧭
• TRIX Length: 21
• Signal Length: 17
• Pivot Period: 6
• TRIX Display: CURRENT+UPPER
• TRIX Divergence: CURRENT+UPPER
• Min Bars Between Divs: 8
• Min Div Strength: 1.2
• Use Scoring System: yes
• Min Score: 3.0
Scalping Profile 🔍
• TRIX Length: 9
• Signal Length: 6
• Pivot Period: 3
• TRIX Display: CURRENT+LOWER
• TRIX Divergence: CURRENT+LOWER
• Min Bars Between Divs: 5
• Min Div Strength: 0.8
• Use Scoring System: no
• Last Divergence: yes
💡 Practical Tips
• “Stacked” divergences across multiple timeframes may provide stronger potential signals
• Consider using hidden divergences for trend trades and regular divergences for reversals
• When TRIX crosses zero in the higher timeframe, it may suggest a significant trend change
• Thicker divergence lines = potentially stronger signals (automatically displayed)
• In choppy markets, increase the minimum divergence strength to help filter out false signals
• Always combine indicator signals with other forms of analysis and confirmation
⚠️ Risk Disclaimer
Trading involves risk. This indicator provides analysis tools but cannot guarantee profitable trades. Past performance is not indicative of future results. Users should combine this indicator with proper risk management and their own analysis. Financial markets lack certainty, and each user is responsible for their trading decisions.
Trade responsibly.

Majors Sync | QuantEdgeBIntroducing MajorsSyn c by QuantEdgeB
🔹 Overview
🚀 Dynamic Rotation System for BTC, ETH & SOL
MajorsSync is a powerful, rotation-based strategy designed to systematically identify the leading cryptocurrency among the top three majors: Bitcoin (BTC), Ethereum (ETH), and Solana (SOL).
By analyzing inter-market strength, pairwise trend dominance, and individual trend quality, MajorsSync dynamically shifts exposure toward the asset with the highest potential for outperformance, while de-risking during unfavorable conditions.
✨ Core Objective
📌 To allocate capital to the strongest-performing major—BTC, ETH, or SOL—while avoiding underperformers and unnecessary exposure during uncertain market phases.
🧠 How It Works
Majors Sync uses a multi-tiered decision structure:
🔹 1. Individual Asset Trend Evaluation
Each asset is scored using a Trend Performance Index (TPI). These are proprietary models capturing medium-term momentum and structure for:
• BTC
• ETH
• SOL
🔹 2. Pairwise Relative Strength Matrix
Compute TPI values between the asset pairs:
• ETHBTC → Is ETH stronger than BTC?
• SOLETH → Is SOL stronger than ETH?
• SOLBTC → Is SOL stronger than BTC?
These relative TPI readings help construct a score matrix to rank assets 0–2.
🔹 3. Signal Confirmation
Only when the top-ranked asset has a positive TPI, a Long signal is triggered on that asset.
Otherwise, if no asset meets the threshold, the system remains in Cash/Neutral mode to protect capital.
🧮 Capital Allocation Logic
📊 Allocation always rotates to:
• ✅ The strongest asset with a positive trend
• 🛑 Otherwise, goes neutral/cash (no trade)
This ensures capital is placed in high-probability zones only.
💼 Equity System
🧮 An internal equity engine simulates dynamic capital rotation by reallocating to the top-performing major (BTC, ETH, or SOL) at each bar. This allows for transparent tracking of historical strategy performance.
• 💡 If BTC is the top asset → System follows BTC's price change
• 💡 If ETH becomes dominant → It reallocates to ETH
• 💡 If SOL takes over → Position shifts to SOL
• 📉 No asset qualified? → Strategy holds cash
You also get a Buy & Hold BTC benchmark for direct comparison.
⚠️ This simulation reflects past behavior and is not indicative of future results.
📊 Dashboard & Visuals
The built-in dashboard table displays:
• 🧠 Asset Trends (BTC, ETH, SOL)
• 🧩 Matrix values (e.g., ETH vs BTC, SOL vs ETH)
• 🏁 Final Signal Output (which asset is selected)
• 🔁 Real-time Strategy Equity vs Buy & Hold
💪 Why It Works
Majors Sync blends:
• ✅ Inter-market structure (pairwise dominance)
• ✅ Intra-asset momentum (standalone TPI)
• ✅ Position filtering (only acts on positive signals)
• ✅ Capital efficiency (rotates rather than overtrades)
This design reduces drawdowns, avoids stagnation, and seeks to capture medium-term leadership shifts among the top crypto majors.
📊 MajorSync Backtest Metrics
🔹 Sharpe Ratio
Shows the risk-adjusted return by comparing the strategy's return to its overall volatility. Higher is better — it means you're getting more reward per unit of risk.
🔹 Sortino Ratio
Similar to Sharpe, but focuses only on downside volatility (the bad kind). This makes it a better reflection of how the system handles losses specifically.
🔹 Omega Ratio (Ω)
Measures how often the system generates profitable returns versus unprofitable ones. A value above 1 means it wins more than it loses — and the higher it goes, the better.
🔹 Equity Max Drawdown (Eq.Max DD)
This is the deepest decline from peak equity during the test. Lower drawdown means less risk of big losses.
📌 Disclaimer: Backtest results are based on historical data and past market behavior. Performance is not indicative of future results and should not be considered financial advice. Always conduct your own backtests and research before making any investment decisions. 🚀
🚀 Key Benefits
✔️ Trend-Following + Relative Strength Hybrid
✔️ Rotational Capital Efficiency
✔️ De-risking in Weak Conditions
✔️ Optimized for Swing and Medium-Term Positioning
✔️ Visual Clarity + Smart Allocation
🔧 Settings Overview
• Color Mode – Switch visual palette for the base Trend
• Trend Color – Toggle trend-based bar coloring
• Enable Backtest Table – Show historical performance metrics
• Start Date – Control backtest window
🏁 Conclusion
Majors Sync is your intelligent rotation engine for crypto majors.
Instead of guessing which coin to hold, let the system rotate for you—objectively, consistently, and visually.
📈 Be in BTC when it leads. Switch to ETH or SOL when strength shifts. Sit in cash when needed.
📌 Master the market with precision and confidence | QuantEdgeB
🔹 Disclaimer: Past performance is not indicative of future results. No trading strategy can guarantee success in financial markets.
🔹 Strategic Advice: Always backtest, optimize, and align parameters with your trading objectives and risk tolerance before live trading.
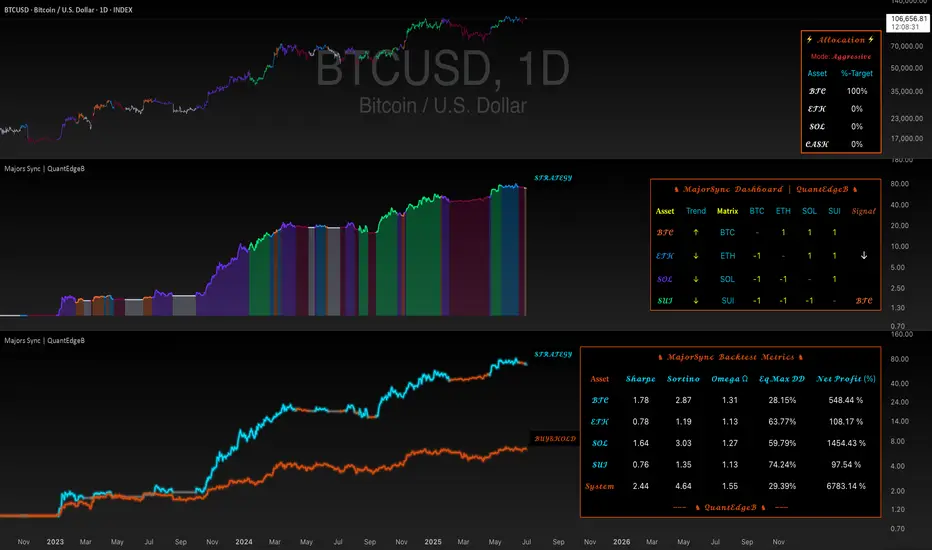
9 by 21(high & low) GSK-VIZAG-AP-INDIA21 EMA High & Low + 9 EMA Crossover with Volume & Wick Confirmation
🔹 What Does This Indicator Do?
This indicator is designed for momentum-based trend trading by combining exponential moving averages (EMAs), price action filters, and volume analysis. It provides traders with high-probability buy and sell signals while filtering out weak trends and false breakouts.
🔹 How Is It Different from Other Indicators?
Unlike traditional EMA crossover strategies that rely only on moving averages, this indicator enhances reliability by incorporating custom volume conditions, price action validation, and wick-based filtering.
Key Features That Make It Unique:
Dynamic EMA Bands for Trend Identification
Uses 21 EMA High & 21 EMA Low as dynamic support & resistance levels, creating a flexible trading range.
Helps traders identify trend strength and potential reversals without relying on static levels.
Enhanced EMA Crossover System
Includes a 9 EMA crossover signal to detect momentum shifts before traditional EMAs react.
Avoids lagging signals often seen in standard moving average crossovers.
Smart Volume-Based Confirmation
Uses a custom volume multiplier to detect significant market participation.
Filters out low-volume breakouts that may lead to false signals.
Wick-Based Filtering for Precision
Identifies candles with no lower wick (for buy signals) and no upper wick (for sell signals) to confirm strong price movements.
Helps traders avoid weak reversals and focus only on strong momentum shifts.
🔹 How to Use This Indicator in Trading?
Buy Conditions:
Bullish candle (green) with no lower wick, confirming strong buying pressure.
Price is above the 21 EMA High and remains above 21 EMA Low.
Volume shows an increase, confirming market participation.
Sell Conditions:
Bearish candle (red) with no upper wick, signaling strong selling pressure.
Price is below the 21 EMA Low and remains under the 21 EMA High.
Volume confirms strong momentum in the downward direction.
Bonus: The indicator also highlights 9 EMA & 21 EMA crossovers to provideearly trend confirmations.
Who Should Use This Indicator?
✅ Intraday Traders – Looking for quick entry and exit signals based on price momentum.
✅ Swing Traders – Who want to identify medium-term trend shifts with volume confirmation.
✅ Trend Followers – Seeking a robust moving average system to avoid false breakouts.
✅ Momentum Traders – Who need price-action-based confirmation before taking a trade.
Why This Indicator Stands Out?
Unlike standard EMA-based indicators that often generate false breakouts, this tool:
✔️ Filters low-quality signals using smart volume analysis.
✔️ Enhances trend confirmation with wick-based filtering.
✔️ Detects momentum early using a unique EMA crossover combination.
This makes it more reliable than traditional moving average-based systems and highly adaptable for different market conditions.
Note: The logic behind this indicator is proprietary and non-repainting, making it a powerful tool for traders who rely on EMA-based trend strategies.
Try it out and see how it improves your trading decisions!
Why This Description Works?
✔ No code exposure – The logic is explained in concept but not in detail.
✔ Clear differentiation – Shows why this is better than other indicators.
✔ Compliant with TradingView rules – No vague claims, but precise explanations.
Would you like to add any specific trading examples or screenshots to further enhance it? Let me know!
Share Your Experience!
Your feedback is valuable! If you find this indicator useful, leave a comment with your experience—how it worked for you, any improvements you suggest, or the best settings you discovered.
Let’s build a community of traders refining strategies together!
Disclaimer:
This indicator is for educational and informational purposes only. It does not guarantee profitable trades and should be used with proper risk management. Always conduct your own research before making trading decisions.
Original Gann Swing Chart Rules [AlgoFuego]🔵 Original Gann Swing Chart Rules
An advanced indicator built on W.D. Gann’s original rules, enhanced with innovative mechanical trend-following methods.
🔹 Description
This indicator functions by balancing short-term adaptability with long-term trend analysis.
The indicator incorporates Gann’s principles alongside mechanical trend-following techniques to offer a structured method for analyzing trends and detecting potential market reversals.
Golden Rule: Non-trend bars are excluded from analysis, and each new bar is compared with the previous trend bar, it highlights significant swing points with greater clarity.
🔸 The core concept behind the golden rule on which this indicator is built.
The person watching the tide coming, wanting to pinpoint the exact spot that signals the high tide, places a stick in the sand at the points where the incoming waves reach until the stick reaches a position where the waves no longer rise, and eventually recedes enough to show that the tide has shifted.
This method is effective for monitoring and identifying tides and floods in the stock market.
🔸Rule 1: The trend bar is everything.
→It is a bar that forms a new high, low, or both.
🔸Rule 2: The professional traders track new highs and lows.
🔸Rule 3: The hidden bar is nothing.
→It is a bar that does not form a new high, low, or both.
🔸Rule 4: The sea has a wavy nature, and the market as well.
🔸Rule 5: The slope is the immediate direction of the swing.
Downward slope
→The downslope is the descending slope of a swing, shows a decline, reflecting a bearish price trend.
Upward slope
→The upslope is the ascending slope of a swing, shows an incline, reflecting a bullish price trend.
🔸Rule 6: The start and end of the movement are the swing points.
→The lowest or highest price of the last bar in the direction of the slope represents the swing point after the slopes direction changes.
Valley
→It is the lowest price of the last bar in a downslope before the market turns to a upslope.
End=> Downward slope and Start=> Upward slope
Peak
→It is the highest price of the last bar in a upslope before the market turns to an downslope.
End=> Upward slope and Start=> Downward slope
🔸Rule 7: The Golden Rule: Ignore all no-trend bars and compare the new bar with the previous trend bar.
→Applying the golden rule in upward slope
→Applying the golden rule in downward slope
🔸 Related content: Personal words of W.D Gann from the book Wall Street Stock Selector.
→"This was only one month's reaction the same as March 1925. The market held in a dull narrow range for about 2 months while accumulation was taking place and in June the main trend turned up again."
→The beginning of the main trend and the formation of the Valley.
→The beginning of the main trend and the formation of the Peak.
🔸 Rule 8: The Closing Price of the Bar to Understand Movement Direction.
Sequence is important
→ Downward bar
→ Upward bar
🔸 Outside Bar Rules
→Explanation of rules and calculations.
🔸 How does a trend start?
Upward trend
Trend change from Downward to Upward.
Prices must take out the nearest 'Peak' and the Trend was previously Downward.
A breakout above the previous peak signals a bullish reversal.
→ Model 1 - Dropping Valley Reversal
The market forms a dropping valley, followed by a breakout above the previous peak.
→ Model 2 - Equal Valley Reversal
The market forms an equal valley, followed by a breakout above the previous peak.
→ Model 3 - Rising Valley Reversal
The market forms a rising valley, followed by a breakout above the previous peak.
Downward trend
Trend change from Upward to Downward.
Prices must take out the nearest ‘Valley' and the Trend was previously Upward.
A breakdown below the previous valley signals a bearish reversal.
→ Model 1 - Rising Peak Reversal
The market forms a rising peak, followed by a breakdown below the previous valley.
→ Model 2 - Equal Peak Reversal
The market forms an equal peak, followed by a breakdown below the previous valley.
→ Model 3 - Dropping Peak Reversal
The market forms a dropping peak, followed by a breakdown below the previous valley.
🔸 The fractal nature of markets
Rising wave
→ The rising wave is the entire bull market between turning points
High point : When the Main trend turns from upward to downward, the peak of the primary trend is formed.
Dropping wave
→ The Dropping wave is the entire bear market between turning points.
Low point : When the Main trend turns from downward to upward, the primary trend valley is formed.
Fractal nature application.
Everything in one picture.
🔹 Features
Strict adherence to the rules: Follows the Original Gann Swing Chart Rules to detect swing points.
Fractal analysis: Uses trend bars and fractal analysis to identify swing points.
Robust functionality: Engineered to handle complex market conditions with advanced logic.
Custom alerts: Alerts for peak/valley completion, main and primary trend reversals & continuations.
Golden rule application: Filters out non-trend bars by comparing only with the last trend bar.
Reversal & trend detection: Applies eight outside bar rules to detect trend reversals and continuations.
Dynamic customization: Fully customizable settings.
🔹 Settings overview
Fine-tune the indicator to match your unique trading strategy by adjusting trend settings, customizing alerts, and modifying visualization options.
1. Main trend settings
Hide/Show Main trend options: Instantly hide all main trend options (alerts remain separate).
Main trendline display & alerts: Toggle trendline visibility and set alerts for peaks and valleys.
Trendline customization: Adjust styles, colors, and slopes for upward/downward trends.
Peaks & Valleys markers: Show/hide points and customize their color and size.
Opposite Main trend turning points: Enable alerts and modify style, width, color, and offset.
Breakout/Breakdown points: Set alerts and customize their appearance.
2. Primary trend settings
Hide/Show primary trend options: Instantly hide all primary trend options (alerts remain separate).
Primary trendline display & alerts: Toggle trendline visibility and set alerts for peaks and valleys.
Trendline customization: Adjust styles, colors, and slopes for upward/downward trends.
Peaks & Valleys markers: Show/hide points and customize their color and size.
Opposite primary trend turning points: Enable alerts and modify style, width, color, and offset.
Breakout/Breakdown points: Set alerts and customize their appearance.
3. Additional options
Tooltips display: Control tooltip visibility for labels and languages.
Candle/Bar coloring: Customize candle and bar colors based on algorithm-selected trends.
🔸 Additional features
🔹Custom reading of bars.
The arrow represents the direction of the slope, the dot is the type of trend, and the line is the closing price.
🔹 Advanced Moving Average Activator
The Advanced Moving Average Activator, this setting calculates the average closing prices of trend bars only, which are the only bars considered by Gann.
The advantage of this method is that it helps avoid hidden bars that are not accounted for, making the difference more evident in a ranging market. The values are updated only when new highs or lows occur.
Additionally, you can set alerts when the price closes above or below the moving average.
🔹 Bar Counter
After a trend change, you can see exactly when the shift occurred and customize the type of trend you want to track.
For example, by conducting your own research on the assets you trade, based on historical data, you might discover valuable insights, such as the primary trend possibly lasting longer than 20 bars!
You can use these insights to refine your trading strategy and make more data-driven decisions.
🔹 How to use
Step 1: Configure the settings and choose your trading approach
Adjust the indicator settings to match your trading style and market conditions.
Effectively using the indicator starts with selecting your preferred trading style.
You can trade in alignment with the primary trend, capitalize on market reversals, or take advantage of breakouts.
Trading with the primary trend: Best for traders who prefer longer-term positions with higher stability.
Trading reversals: Ideal for those looking to enter at potential turning points but requires additional confirmation.
Trading breakouts: Suitable for traders targeting strong price movements after key level breakouts.
Adapting to market volatility: Monitor changing volatility and adjust your strategy accordingly for optimal results.
Step 2: Analyze the chart
Apply the indicator to your TradingView chart and interpret swing signals for informed decisions.
Carefully study the chart patterns to detect subtle signals.
Check if similar signals worked well in past market conditions.
Use multi-timeframe analysis for a broader perspective.
Step 3: Trade with the primary trend
Utilize trend direction to align trades with prevailing market movements.
Always trade in the direction of the primary trend.
Confirm the trend direction using multiple indicators or by relying on the primary trend as confirmation!.
Avoid trading against strong market momentum.
Step 4: Identify entry signals
Use indicator signals to identify ideal trade entry points.
Look for confirmation before entering a trade.
Wait for clear signals to avoid false entries.
Practice on a demo account to build confidence in your entry strategy.
Step 5: Apply risk management
Define stop-loss and take-profit levels to protect your capital effectively.
Set stop-loss orders at strategic levels to limit potential losses.
Risk only a small percentage of your capital per trade.
Adjust risk levels based on your overall portfolio performance.
Step 6: Confirm with trend analysis
Validate trends using additional indicators for a higher probability of success.
Use complementary tools to confirm trend direction.
Monitor trend changes to adjust your strategy promptly.
Keep an eye on volume indicators for added confirmation.
Step 7: Execute the trade
Enter trades based on confirmed signals and predefined strategy rules.
Ensure all your criteria are met before executing a trade.
Stay disciplined and stick to your strategy.
Review market conditions right before execution.
Step 8: Monitor the trade
Track trade performance and make adjustments as necessary.
Keep an eye on market conditions throughout the trade.
Be ready to adjust your strategy if unexpected events occur.
Use trailing stops to secure profits while allowing for gains.
Step 9: Implement exit strategy
Close trades strategically based on your pre-established exit plan.
Plan your exit strategy in advance and adhere to it.
Consider partial exits to secure profits along the way.
Avoid emotional decisions when closing trades.
Step 10: Review performance
Analyze past trades to continuously refine and improve your strategy.
Regularly review and document your trades for insights.
Identify patterns in both your successes and mistakes.
Update your strategy based on comprehensive performance reviews.
🔹 Disclosure
While this script is useful and provides insight into market tops, bottoms, and trend trading, it's critical to understand that past performance is not necessarily indicative of future results and there are many more factors that go into being a profitable trader.
