SSL Backtester With ATR SL TP and Money ManagementSimilar to other SSL Channel scripts, but this one allows you to set an ATR-derived stop loss and adds the option to risk a % of the equity or used a fixed lot.
Enters upon a long or short SSL crossover.
FIXED LOTS
For 0.01 "lots" use 1000
For 1 standard lot, use 100,000
FOR MONEY MANAGEMENT
For 1% risk, enter 0.01
For 10% risk, enter 0.1
etc
You should be able to adapt this to any other indicator by just changing the entry conditions and adding your own indicator values.
It is not meant to be a profitable script, just a template to begin adding money management ideas to existing scripts which currently just enter and exit on an event.
Cari dalam skrip untuk "profitable"

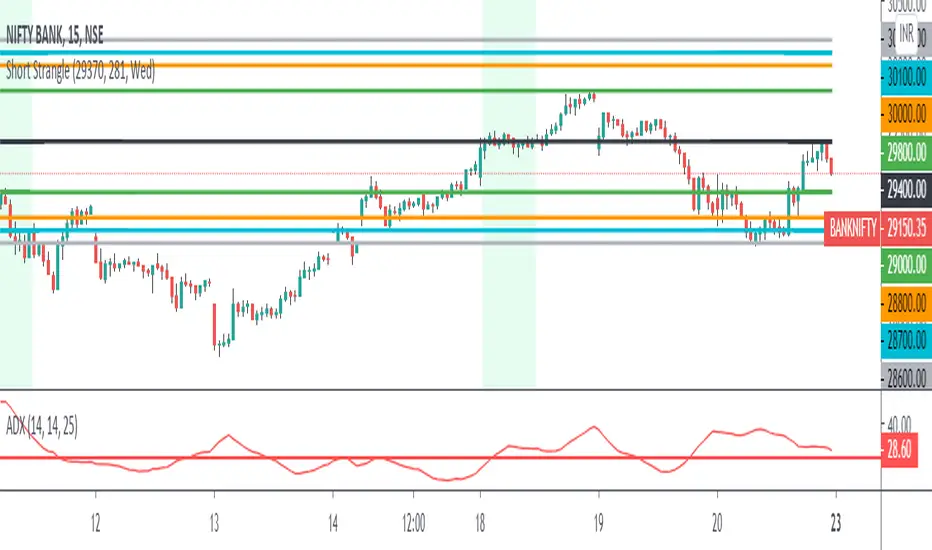
3 Leg Short Strangle BandsDraws 3 leg bands along with safe zone(green lines) based on input
1) Input ATR, Week Day, Current Market Close
2) Input ATR - Previous day 1H Max ATR
3) ADX < 25
4) Input Current Market Close
5) Trading Day - Mon/Tue/Wed/Thu/Fri - Bands distance calculated based on day M/Tu/F 2*(Max ATR), W/Th 1.5(ATR)
6) Safe zone green lines - CMPCls +/- (1.5 * Max ATR)
7) Leg 1 Upper Lower Legs - M/Tu/F - CMPCls +/-(2 * Max ATR), W/Th - CMPCls +/-(1.5 * ATR)
8) Leg 2 & 3 Calculates based on Leg 2 = Leg 1 +/- 100 pts distance, Leg 3 = Leg 2 +/- 100 pts distance'
9) All figures rounded to nearest 100's
10) Safe zone broken exit all positions
This is a popular technic used by Profitable traders on sideway markets for Intraday
One can keep 3K as SL per 1 set of 3 legs for better R:R
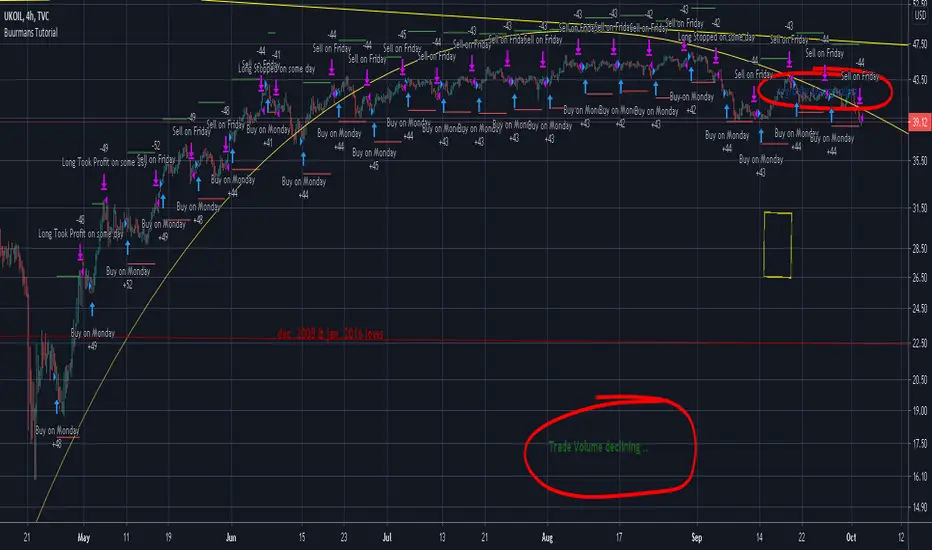
Buurmans TutorialA little Script as part of a Tutorial using Monday as entries and Friday as exits/shorts, with option to Long-Only and a rudimentary Stoploss.
outlined in detail here
can't find a better fitting Category, so bear with me
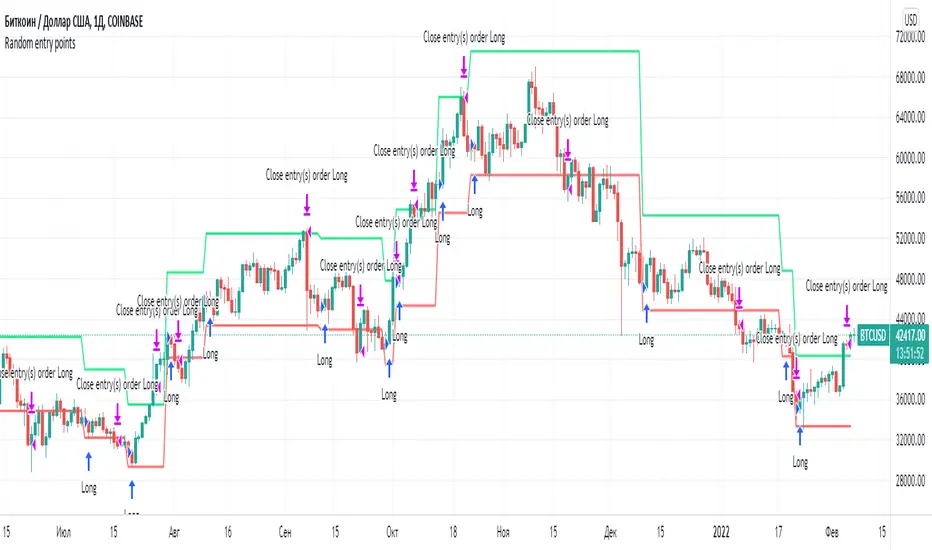
Random entry pointsIt is profitable strategy with random entry points.
A simple strategy involving random opening of trades. But such a strategy on large samples will demonstrate profit. Because the strategy adheres to the golden rule of trading: "Let profits rise and quickly stop losses."
Remember, exit points are very important. Many traders make the mistake of focusing all their attention on entry points.
Mean recursion envelopeFree for public consumption
There is very little original here, the idea is discussed in the underground traders alliance, (google em), and was apparently the basis of what was at one time myfxbooks most profitable strategy.
I can't find the original video that was floating around on youtube, but if i find it again, i'll link it here.
This is bascially just the TV default envelope code copied and modified.
The idea is to have an envelope based on a low length, exponential basis. Then to manually "tune" the percent input so that the envelopes engulf most bars. Whenever price goes outside the envelopes (especially at key levels), look for a change to enter a reversion back to the ema.
This manual tuning when switching between time-frames and symbols of the percentage input, becomes arduous.
Instead this script uses the TV envelope code, but gets a setting based on the average of true range and "autotunes" with this.
Anything that protrudes beyond that level, especially at key levels, is likely to revert back to the ema. Bear in mind, a run away trend will also push past the envelopes and continue running for several (3-5) bars so, use it mindfully and thoughtfully with all the usual cautions about risk management.

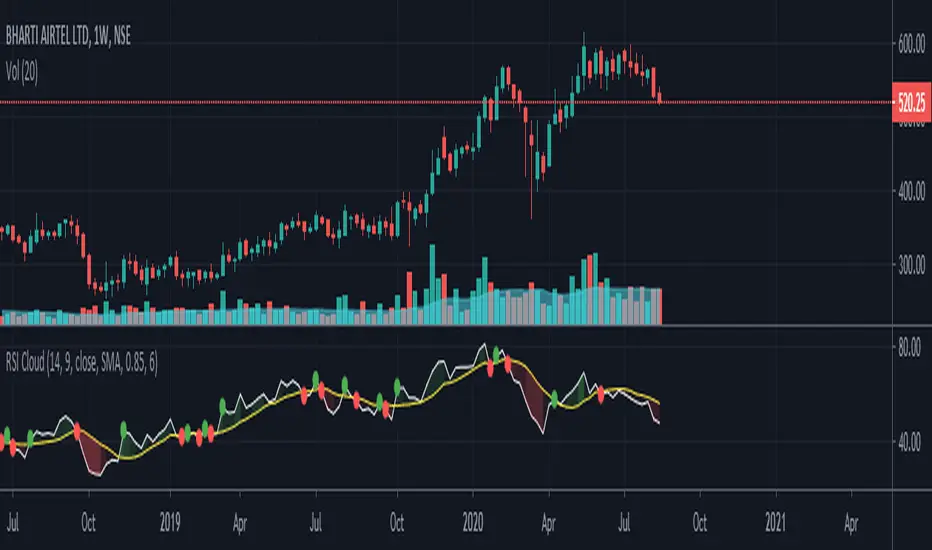
RSI Plus v1.0 by WilsonThis is a modified version of my RSI Cloud indicator. I have included the option to plot 2 moving averages. Type of moving averages included in the script are SMA, EMA, WMA, VWMA, Hull MA and ALMA. Option to fill colors and to add alerts are included. I shall be including more options in a future update.
Anyone is free to copy and modify the script. Wishing everyone happy and profitable trading.

RSI+ by WilsonThis is a modified version of my RSI Cloud indicator. You can plot 2 moving averages over RSI. You have the option to plot moving average types like SMA, EMA, WMA, VWMA, HullMA, and ALMA. You also have the option to plot histograms based on any of the moving averages. You can fill colors between RSI and moving averages. Option to add alerts, crossover and crossunder signals are also included. I have also included a band to show the position of RSI using three colors. Green color is shown when RSI is above both the plotted moving averages. Red color is shown when RSI is below both the plotted moving averages. And Yellow color is shown when RSI is between the two plotted moving averages. Anyone is free to use the script. Wishing everyone happy and profitable trading.

RSI Cloud by WilsonThis indicator will help you to be on the right side of the trend always. Wishing you a happy and profitable trading experience.
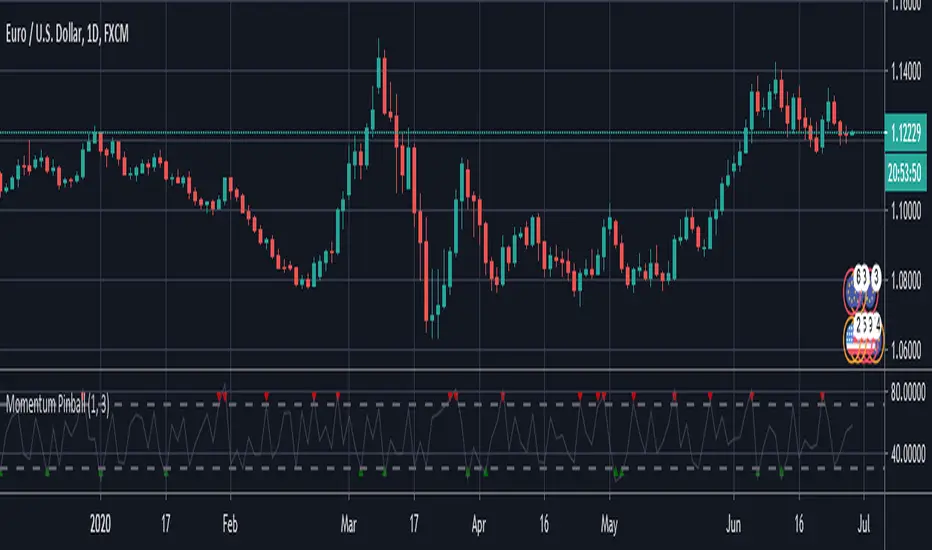
Momentum PinballMomentum Pinball, when you get a buy/sell signal, wait for the next day
enter on the high or low of the first hour and place a stop in the low/high
of the first hour. If the day you get filled closes profitable you can decide to close
the trade buy the end of the day or hold overnight and exit the following morning
Mean Deviation Detector - Throw Out All Other IndicatorsI set out this morning to create a script that searches out price moves that went too far too fast relative to historical pricing, given that such situations often result in the most profitable trading opportunities. I came up with the mean deviation detector. This script should be used as a means of judging how far a price is trading, in percent terms, from it's "average trading zone".
This is extremely helpful in a couple scenarios.
First, it can be used to judge a move's volatility relative to it's previous volatility. Put simply, a 5% move in the stock of Coca Cola is a lot more meaningful than a 5% move in the stock of Tesla, and the detector puts moves into historical (visual) perspective.
Second, the indicator can be used in real time as a means of determining when the chances of mean reversion are high or low. Extreme values are unsustainable and often lead to EITHER A.) price mean reversion or B.) time mean reversion. Put simply, prices either went too far and are due to fall back to a historical mean, or they need more time to digest a potentially new pricing zone.
Without getting too deep into volume profile analysis, the MDD can be a simple way of telling that a stock has moved into an "air pocket", where prices will either come back to the previous volume node (price mean reversion) or set up shop in a new, uncharted area (time mean reversion).
An extreme value doesn't always mean a trading opportunity, but it means that something interesting is happening in the stock / instrument.
I use this indicator to help me trade covered calls. Lots of high yielding weekly opportunities are stocks that have moved too far too fast, and I like to use this indicator as a means of either a.) scooping up stocks that have gotten beat up from a historical mean perspective & have likely seen the risk already "beaten" out of them, or to b.) stay away from stocks that have a very high chance of price correcting lower. In situations where I say that the risk has been "beaten" out of something, it doesn't mean that the stock won't continue to fall, it simply means that the degree and acceleration of the fall has peaked and that risk premiums in selling options will / should easily pay for continued losses. In the event that it's a price correction and not a time correction, you also increase your bat rate because you get auto-liquidated at a max profit. It's a really valuable tool in my kit.
You can also feel free to put a Keltner Chanel overlay onto the MDD to filter out noise, identify "extreme" values, and place mean reversion trades if you expect price mean reversion is likely, if you want to use this as the basis of a proper trading strategy. For a high extreme value, you could sell short term OTM call spreads, for example.
The MDD is adaptable to your own trading style & preferences.

MM testerYou can test a two ema / sma strategy changing type of MM and length on settings.
If you get a profitable combination you can share it in the comments :)

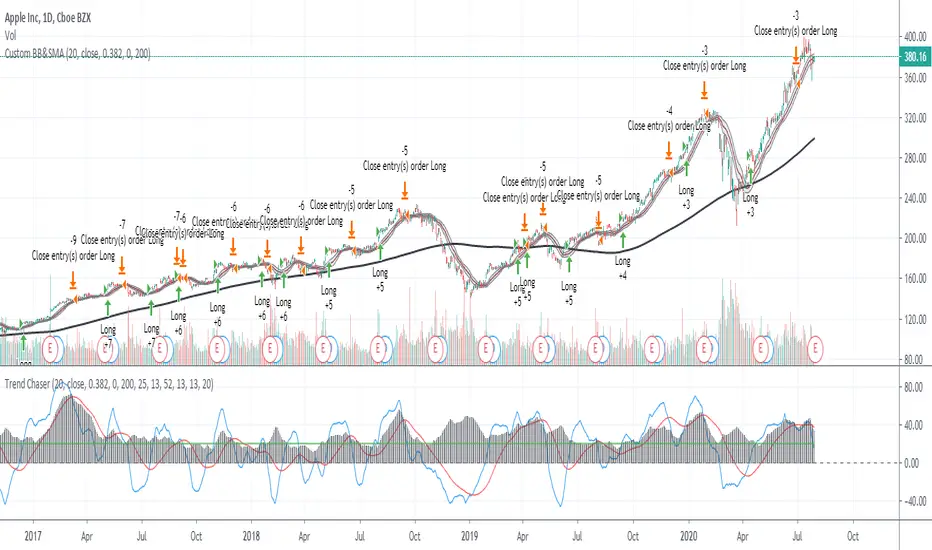
ADX_TSI_Bol Band Trend ChaserThe idea of this script is to be a low risk strategy on trending stocks (or any other trending market), aiming to achieve minimal draw down (e.g. at time of writing AAPL only had ~1.36% draw down, FB ~1.93% draw down and the SPY was 0.80% draw down and all remained profitable).
Testing proved it shouldn't be used in choppy stocks and best period was on daily charts. The back test filter goes back until 2010 so you can obtain 10 years of data.
The strategy utilizes the 200 Moving Average, a Custom Bollinger Band, a TSI with 52 period weighted moving average and ADX strength.
Although back test dates are set to 2010 - 2020, all other filters (moving average, ADX, TSI , Bollinger Band) are not locked so they can be user amended if desired. However the current settings have been tested with manual trading for quite some time to get this combination correct.
Buy signal is given when trading above the 200 moving average + 5 candles have closed above the upper custom Bollinger + the TSI is positive + ADX is above 20.
As back testing proved that this traded better only in tends then some Sell/Short conditions have been removed from the script and this only takes Long orders.
Only requires 2 additional lines of code to add shorting order and then remove the "buy" condition and this could be used for a downward trending stock instead.
Close for either long or short trades is signaled once the TSI crosses in the opposite direction indicating change in trend strength.
Further optimization could be achieved by adding a stop loss, which I may do in the future.
NOTE: This only shows the lower indicators however for visualization you can use my script "CUSTOM BOLLINGER WITH SMA", which is the upper indicators in this strategy.
This is my first attempt at coding a strategy so I'm happy to receive any feedback or hints on how this could be written better from any experienced coders!
NASDAQ:AAPL AMEX:SPY
Best strategy for TradingView (fake)Hello everyone! I want to show you this strategy so you don't fall for the tricks of scammers. On TradingView, you can write an algorithm (probably more than one) that will show any profit you want: from 1% to 100,000% in one year (maybe more)! This can be done, for example, using the built-in linebreak () function and several conditions for opening long and short.
I am sure that sometimes scammers show up on TradingView showing their incredible strategies. Will a smart person sell a profitable quick strategy? When a lot of people start using the quick strategy, it stops working. Therefore, no smart person would sell you a quick strategy. It is acceptable to sell slow strategies: several transactions per month - this does not greatly affect the market.
So, don't fall for the tricks of scammers, write quick strategies yourself.
About this strategy, I can say that the linebreak () function does not work correctly in it. Accordingly, the lines are not drawn correctly on the chart. They are drawn in such a way as to show the maximum profit. I watched this algorithm on a 1m timeframe - no lines are drawn in real time. This is a fake!
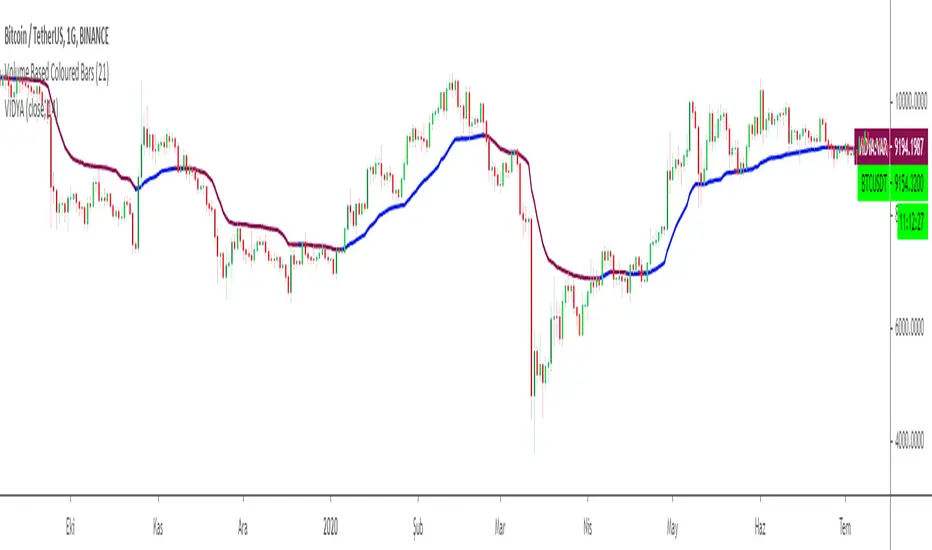
Variable Index Dynamic Average VIDYAChande's Variable Index Dynamic Average (VIDYA) is similar to the Exponential Moving Average (EMA), but automatically adjusts the smoothing weight based on price volatility.
VIDYA was developed by Tushar Chande and presented in Technical Analysis of Stocks & Commodities magazine in March 1992.
In the first version, a standard deviation was used as the Volatility Index
Chande modified VIDYA in October 1995 to use a new Chande Momentum Oscillator (CMO) as the Volatility Index.
So I decided to add an option for the users to change the calculation method.
Default calculation is by using Chande's Momentum Oscillator
Users can change the calculation method to Standart Deviation by unchecking the box on the settings menu.
Another option is to fix the CMO length parameter to 9 to make VIDYA more sensitive to price movements.
CMO parameter is defaultly fixed to 9 but users can change the length of the parameter to the VIDYA length by unchecking the relevant box.
As a moving average, VIDYA smooths the market noises and shows the market trends more clearly.
To achieve the goals, the indicator filters out the market fluctuations (noises) by averaging the price values of the periods, over which it is calculated. In the process, some extra value (weight) is added to the average prices, as it is done during calculations of all weighted indicators, such as EMA, LWMA, and SMMA. But during the VIDIYA indicator's calculation, every period's price receives a weight increment adapted to the current market's volatility.
Note that the value of the smoothing factor (k) is calculated with the help of the period's EMA, and increasing or decreasing of the value is achieved by using CMO Chande Momentum Oscillator as a measure of the market's volatility. As a result, the indicator slows down and does not react to the market's volatility when it increases and, on the contrary, speeds up when a strong steady trend takes place.
Note:
Alarm added for color changes.
Hope you use this one at profitable trades.
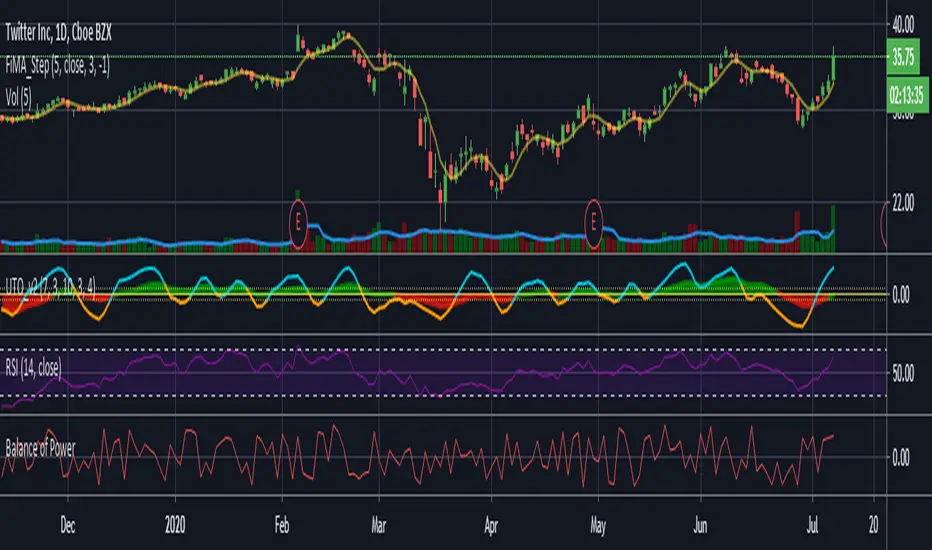
Ultimate Trader Oscillator - UTO v1Note; this is experimental / learning work -- has nothing to do with the existing "Ultimate Oscillator" -- i call this project UTOpia :)
This is based on some research work i was doing around the Balance Of Power - which i posted about in the past
the conclusion form there was a questions of, what would we get if we create an indicator that takes into consideration other factors that may be affecting momentum - so while the classic Balance of Power formula looks at where the open and close of a bar are compared to the full bar range, this is only a small part of the insight we need - when we visually inspect a price chart, we also look at many other factors. for example, how the bar closes compared to previous bar(s), how much did the bulls (or bears) managed to move the high (or low) of the bar compared to previous one, how much volume, how is the price spread ...etc
so i wanted to build an indicator that does exactly that - we will give a score of +100 / -100 to each bar based on these factors (some were identified in the linked post) -- imagine here that we are a judge in a tug of war contest (or a beauty contest if you would :)) and we give a score to the participating teams - the scores are given in different "categories" as these teams make effort to win the game (each bar) - to be totally fair, in some scoring categories, we choose to take the average of 3 points for a fair assessment - the final score is calculated based on the average from all judges - and then and average over the desired length is calculated. this score should be very fair and represents the true effort from all angles, right? that would be our UTOPIA :)
in our case, we don't use an average of total score after each category is evaluated, but rather create a directional index (similar to RSI) -- so we can avoid big spikes in the resulting numbers, and maintain a oscillator -like result.
-- the code is commented to explain the various pieces - and how the scoring happen.
the results are interesting - and you can see how the UTO stacks against the classic RSI and BoP - but it's more of a work to build on, rather than a usable indicator - although i do use it in my own trading :)
one final thought here, i came to learn after few years that the best indicators do not necessarily lead to profitable trading. from an indicator standpoint, if everyone else is trading using (for example) a moving average crossover or RSI, then a successful trader should be looking at these classic indicators too, cause these common indicators will drive the mass behavior - and will at many times trigger "self- fulfilling prophesies" in price action - but that's not the only or the biggest reason - the big reasons have to do with the fact that trading needs a lot of effort outside the charts, in researching markets, learning the discipline, then managing positions and managing the portfolio. these are all big topics to put in such short words.
i hope some will find this work inspiring.
Milan OscillatorBill Williams Breakout Setup
I have referred to the man multiple times whether tweeting about him or writing a blog post. Now I want to relearn how breakout trading works, again. A while ago, my friend invited a bunch of us into a Zoom conference sharing us how his setup works for him. He reintroduced me to Bill Williams' indicators which looked like below.
The rules are simple:
Prices are moving away from Alligator, open and closed above the first time.
AC is twice consecutively at par with the direction.
AO is twice consecutively at par with the direction.
Entry on the third candle to be sure, or the second if you're willing to risk it.
The chart above is an example from the 4 hourly time-frame. Before going into any entry, to get a macro perspective, should check on these time-frames first:
Weekly
3 Days
Daily
Bonus points if monthly time-frame is also at par with the bias. Here are the charts for the larger time-frame.
It's been profitable trading with the above setup but then I have an itch to scratch. I wanted to have just a single oscillator instead of two to look at. It will enable me to make decisions faster and can use my brain juice to think about something else.
So I combined the two to create a new oscillator. I call it the `Milan Oscillator` in honor of my friend Patris who reintroduced me to Bill Williams yet again. Patris' favorite team is AC Milan, here's to you bro 🍺
Here are the same charts above with Milan Oscillator.
The rules are a bit different than the rules above:
No entry when the oscillator is gray, this means AC and AO are disagreeing.
Prices are moving away from Alligator, open and closed above the first time.
Oscillator is twice consecutively at par with the direction.
Entry on the third candle to be sure, or the second if you're willing to risk it.
On lower volume moves, prices will retest alligator, can be an entry if the retest fails.
Feedbacks are appreciated.

Momentum Pinball////////////////////////////////////////////////////////////////////////////////////////////////
//// Momentum Pinball, when you get a buy/sell signal, wait for the next day
//// enter on the high or low of the first hour and place a stop in the low/high
//// of the first hour. If the day you get filled closes profitable you can decide to close
//// the trade buy the end of the day or hold overnight and exit the following morning
////////////////////////////////////////////////////////////////////////////////////////////
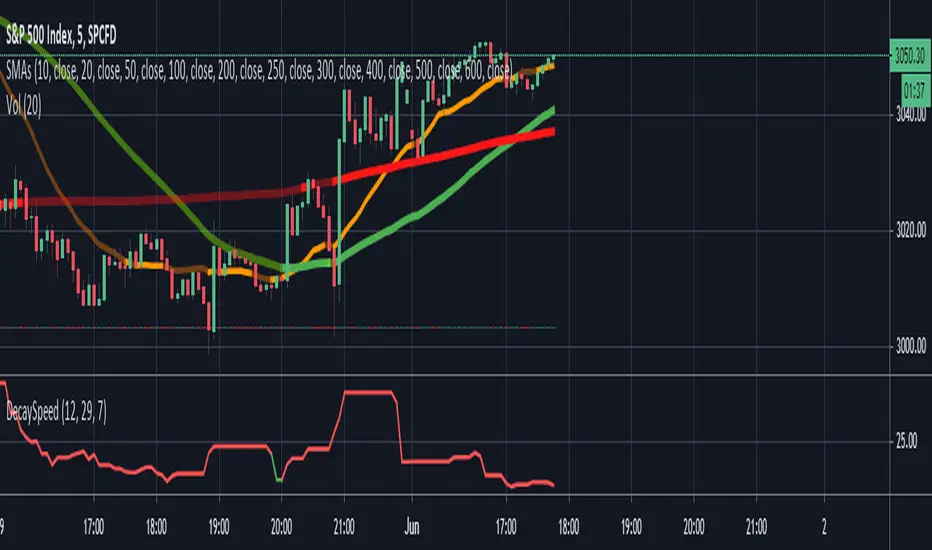
Options Decay Speed for 0DTEUse only for:
SPX, 5 minutes time frame
This indicator is complementing options 0DTE strategy - selling options for SPX index in the same day as they are expiring. Output of the indicator (red or green color of the curve) indicates whether is profitable to sell options at given moment at delta and VIX specified in the parameters. Changing parameter "Candles" is not recommended.
Main thought is that options expire with certain speed (theta decay) when stock doesnt move. When stock moves in unfavorable direction slowly enough, decay speed can compensate for disadvantage coming from option delta. Intuitively there must be certain speed of stock value change (expressed in stock value per 5 minutes) that is exactly compensating theta decay. This indicator calculates those two values (details below) and shows, where theta decay is faster than stock movement in the last hour and thus favorable to sell options.
Indicator gets its result from comparing two values:
1) volatility in the form of highest high and lowest low for past 12 candles (one hour in total) divided by 12 - meaning average movement of stock expressed in
2) speed of options value decay in form of combination of theta decay and option delta. Formulas are approximation of Black-Scholes model as Pine script doesnt allow for advanced functions. Approximations are accurate to 2 decimal points from market open to one hour before market close and will not indicate green when accuracy is not sufficient. Its value is also expressed in so its mutualy comparable.
My focus was not on code elegance but on practical usability.
Written by Ondřej Škop.
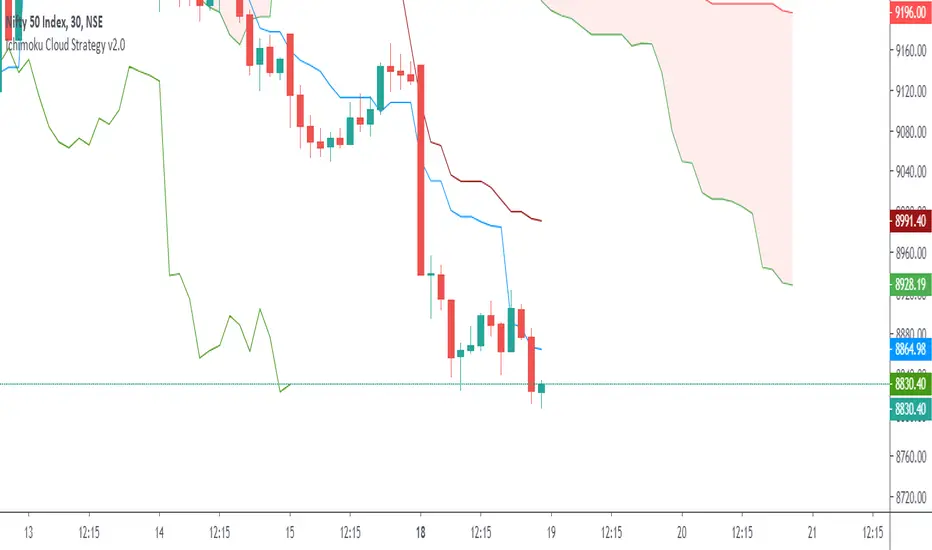
Ichimoku Cloud Strategy v2.0Trend following trading strategy “Ichimoku Crossover” is a popular Ichimoku trading strategy that uses the cloud and crossover of two base lines to define the market reverse point. Ichimoku crossover trading strategy has appeared to be a profitable trading strategy.
The indicator has 5 base lines and to read Ichimoku indicator it is required to understand the meaning of these lines first of all:
Tenkan-Sen line, also called the Conversion Line, represents the midpoint of the last 9 candlesticks . It is calculated with the following Ichimoku formula: .
Kijun-Sen line, also called the Base Line, represents the midpoint of the last 26 candlesticks . It is calculated with the following formula: .
Chiou Span, also called the Lagging Span, lags behind the price (as the name suggests). The Lagging Span is plotted 26 periods back.
Senkou Span A, also called the Leading Span A, represents one of the two Cloud boundaries and it’s the midpoint between the Conversion Line and the Base Line: . This value is plotted 26 periods into the future and it’s the faster Cloud boundary.
Senkou Span B, or the Leading Span B, represents the second Cloud boundaries and it’s the midpoint of the last 52 price bars: . This value is plotted 52 periods into the future and it is the slower Cloud boundary.
Trading with Ichimoku is very simple.
The Conversion Line needs to break above the Base Line. This will be a buy signal.
For a bearish (sell) signal a trader should wait for the Conversion line crosses the Base line downwards it is a sell signal.
Correlation Cycle, CorrelationAngle, Market State - John EhlersHot off the press, I present this "Correlation Cycle, CorrelationAngle, and Market State" multicator employing PSv4.0, originally formulated by Dr. John Ehlers for TASC - June 2020 Traders Tips. Basically it's an all-in-one combination of three Ehlers' indicators. This power packed triplet indicator, being less than a 100 line implementation at initial release, is a heavily modified version of the original indicator using novel techniques that surpass John Ehlers' original intended design.
This is also a profound script in numerous ways. First of all, these three indicators are directly from the illustrious mastermind himself Dr. John Ehlers. Secondarily, this is my "50th" script published on TV, which makes it even more significant. I'm especially proud of this script to "degrees" of imagination I once didn't know was theoretically possible in code. My intellect has once again been mathemagically unlocked pondering new innovations with this code revelation. Thirdly, this PSv4.0 script shows the empowering beauty and elegance of hacking the stock markets with TV's ultra utilitarian Pine Editor(PE) in a common browser! Some of you may be wondering if I worked on this for days... nope! This only took a few hours, followed by writing this description for another hour plus.
I have created many of Ehlers' indicators in PE, a few of which I have published in my profile, but I wanted to show how programming with Pine Script can be an artistic form of craftsmanship and poetry. None of this would be possible without the ingeniously minded Tradingview staff revolutionizing algorithmic trading at it's finest. If you should ever encounter them by chance, ponder humbly thanking these computing wizards for their diligence and dedication. They are providing, and shall award to us members, some of the most fascinating conceptualized tech imaginable in the coming future. I can assure you, much, much more is yet to be unveiled for us TV members/enthusiasts. Thank you TV and all you offer to this community.
As always, I have included advanced Pine programming techniques that conform to proper "Pine Etiquette" by example. There are so many Pine mastery techniques included, I don't have an abundance of time to elaborate on all of them. For those of you are code savvy, you may have notice I only used one "for" loop for increased server efficiency, instead of the two "for" loops in the original formulation. For those of you who are newcomers to Pine Script, this code release may also help you comprehend the immense "Power of Pine" by employing advanced programming techniques while exhibiting code utilization in a most effective manner. This is commonly what my dense intricate code looks like behind the veil. If you are wondering why there is hardly any notes, that's because the notation is primarily in the variable naming.
Features List Includes:
Dark Background - Easily disabled in indicator Settings->Style for "Light" charts or with Pine commenting
AND a few more... Why list them, when you have the source code!
The comments section below is solely just for commenting and other remarks, ideas, compliments, etc... regarding only this indicator, not others. When available time provides itself, I will consider your inquiries, thoughts, and concepts presented below in the comments section, should you have any questions or comments regarding this indicator. When my indicators achieve more prevalent use by TV members, I may implement more ideas when they present themselves as worthy additions. As always, "Like" it if you simply just like it with a proper thumbs up, and also return to my scripts list occasionally for additional postings. Have a profitable future everyone!

Percent Trailing Stop (%) - For Study Scripts===========
Percent Trailing Stop (%) - { FOR STUDY SCRIPTS }
===========
Wow - this is an example of how to implement Alerts relating to a Trailing Stop (%) within your Study Script. It's taken a bit of effort to get this working but I think we got there!
Alerts include Open Long/Short, Trailing Stop Hit, and (the most important one) Movement of Trailing Stop! <- this is actually really quite good, by the way! :)
You can ignore the actual entry/exit orders - they're based on a simple MA cross and are therefore NOT relevant, NOT profitable and NOT recommended!
You should be using this code as a way of adding a Trailing Stop to your own scripts - hope it helps!
Set your "Open Long/Short" Alert to "Once per Bar Close" - Set your "Trailing Stop Hit" Alert to "Once per Bar" - Set your "Move TSL" Alert to "Once per Bar Close". - You're all done! Enjoy.
-----------
Good Luck and Happy Trading!

Fixed Percent Stop Loss & Take Profit % - For Study Scripts===========
Fixed Percent Stop Loss & Take Profit % - { FOR STUDY SCRIPTS! }
===========
A neat example of how to set up Fixed Stops and Take Profit as a percent of the entry price - This is for setting Alerts within your own Study Script for when either your SL or TP get hit.
Yup, that's about it!
You can ignore the actual entry/exit orders - they're based on a simple MA cross and are therefore NOT relevant, NOT profitable and NOT recommended!
You should be using this code as a way of adding Stops and Takes to your own scripts - hope it helps!
Set your "Open Long/Short" Alerts to be triggered "Once per Bar Close" - Set your "SL/TP" Alerts to trigger "Once per Bar".
--
We wrote this with a bit of a rush on! ~ If you spot any mistakes/bugs just let us know and we'll get round to them asap!
-----------
Good Luck and Happy Trading!

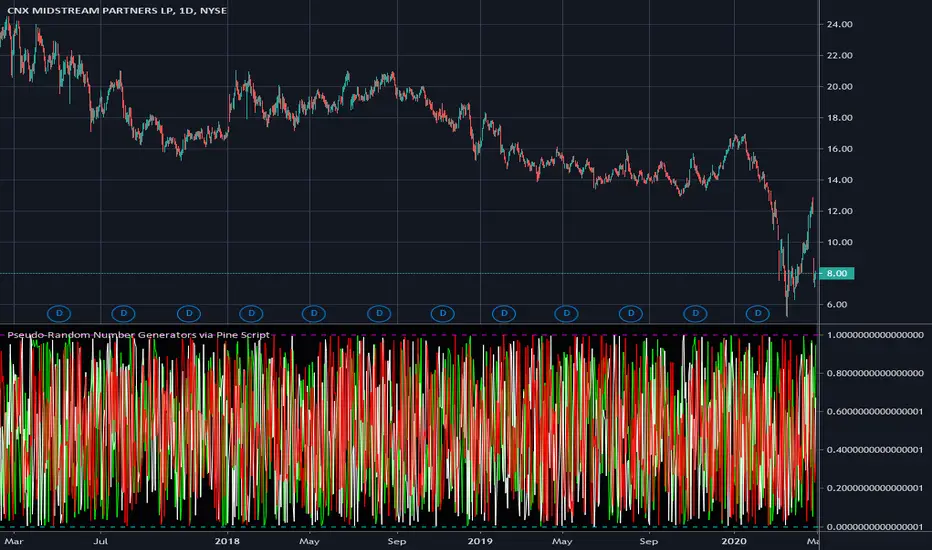
Pseudo-Random Number Generators via Pine ScriptThese are my "Pseudo-Random Number Generators via Pine Script", having uniform distribution between 0 and 1. In my quest for sequential pseudo-random numbers in Pine, tinkering with mathematical chaos, I have come up with these three simple yet handy generators. I believe these may be useful in the future by developers of the Tradingview community.
NOTICE: Use it as you please, this is free code to implement into your new Pine projects. You don't have to ask for my permission to reuse these functions in your published scripts, simply because I have better things to do than answer requests for the reuse of these simplistic PRNG functions. I don't require accreditation for members to reuse these functions either. I simply don't want any credit. I only require that you respectfully put it to "good and proper use" complimenting the elaborate script you have in mind. I would however like to see some great ideas utilizing these when I randomly and accidentally come across them in the public library. I didn't know where to put this script, so I just tossed it into the "Trend Analysis" category.
The comments section below is solely just for commenting and other remarks, ideas, compliments, etc... regarding only this indicator, not others. When available time provides itself, I will consider your inquiries, thoughts, and concepts presented below in the comments section, should you have any questions or comments regarding this indicator. When my indicators achieve more prevalent use by TV members, I may implement more ideas when they present themselves as worthy additions. As always, "Like" it if you simply just like it with a proper thumbs up, and also return to my scripts list occasionally for additional postings. Have a profitable future everyone!