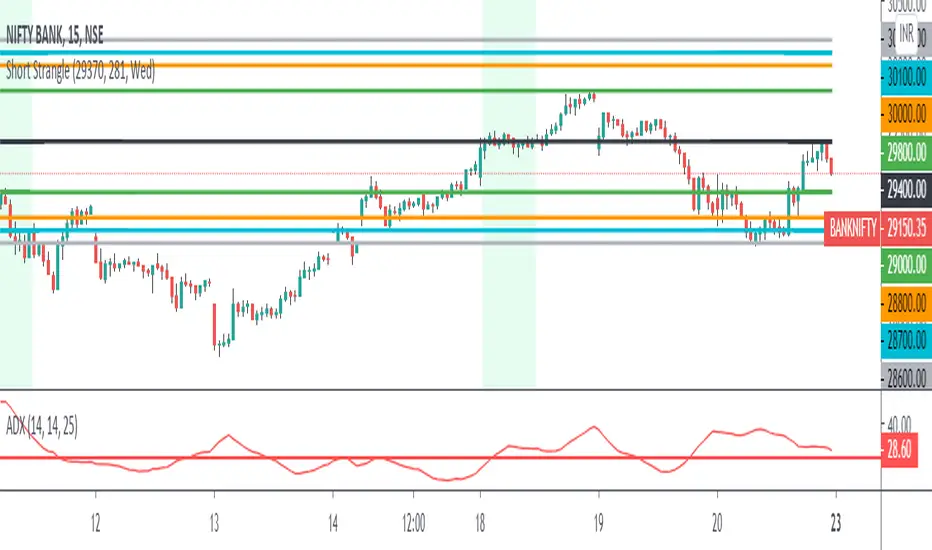
3 Leg Short Strangle BandsDraws 3 leg bands along with safe zone(green lines) based on input
1) Input ATR, Week Day, Current Market Close
2) Input ATR - Previous day 1H Max ATR
3) ADX < 25
4) Input Current Market Close
5) Trading Day - Mon/Tue/Wed/Thu/Fri - Bands distance calculated based on day M/Tu/F 2*(Max ATR), W/Th 1.5(ATR)
6) Safe zone green lines - CMPCls +/- (1.5 * Max ATR)
7) Leg 1 Upper Lower Legs - M/Tu/F - CMPCls +/-(2 * Max ATR), W/Th - CMPCls +/-(1.5 * ATR)
8) Leg 2 & 3 Calculates based on Leg 2 = Leg 1 +/- 100 pts distance, Leg 3 = Leg 2 +/- 100 pts distance'
9) All figures rounded to nearest 100's
10) Safe zone broken exit all positions
This is a popular technic used by Profitable traders on sideway markets for Intraday
One can keep 3K as SL per 1 set of 3 legs for better R:R
Cari dalam skrip untuk "profitable"
Mean recursion envelopeFree for public consumption
There is very little original here, the idea is discussed in the underground traders alliance, (google em), and was apparently the basis of what was at one time myfxbooks most profitable strategy.
I can't find the original video that was floating around on youtube, but if i find it again, i'll link it here.
This is bascially just the TV default envelope code copied and modified.
The idea is to have an envelope based on a low length, exponential basis. Then to manually "tune" the percent input so that the envelopes engulf most bars. Whenever price goes outside the envelopes (especially at key levels), look for a change to enter a reversion back to the ema.
This manual tuning when switching between time-frames and symbols of the percentage input, becomes arduous.
Instead this script uses the TV envelope code, but gets a setting based on the average of true range and "autotunes" with this.
Anything that protrudes beyond that level, especially at key levels, is likely to revert back to the ema. Bear in mind, a run away trend will also push past the envelopes and continue running for several (3-5) bars so, use it mindfully and thoughtfully with all the usual cautions about risk management.

MCD_Pro01+ This indicator used for detect banker/institutional and retailer
Green is locked chips (Retailer)
Yellow is floating chips (Hot money)
Red is profitable chips (Banker/Institutional)
With 10 days Banker moving average in purple line
When the Purple line hit the Red bar it mean Banker is starting the upside trend should buy
But if the Purple line is above the Red line it mean Banker is starting downside trend should sell
Buy when=Purple Bar
Sell When=Black Bar
This is how to short-time investing follow banker

Composite Synchronous Sinusoidal Harmonics Waveform GeneratorWait, "Composite Synchronous Sinusoidal Harmonics Waveform Generator", say what?? What on earth is that, and what function does this script perform? Keep reading and discover! It's intended and provided freely to use for any TV member at any skill level, not just at the engineering level. This is also available for anyone becoming fluent with why stocks/markets fluctuated the way that they do.
Don't let the entitled name frighten you, it's actually surprisingly fun to just fiddle with. This is ALSO a ingenious PSv4 tinker toy. Change any input() and see how one subtle settings alteration dramatically changes the entire fractal. You might learn something new about this giant financial game we all are determined to play anyways. Double and triple tops, head and shoulders, bounces, cup/handle, consolidations, and MANY-MANY other things are revealed on how they come to exist and why. Funny thing is, this is occurring in minds of traders psychologically. You, me, everyone! Ponder that.
Initially, I wanted a synthetic signal "generator", where I would know for certain what the specific "composing" frequencies are for testing, spectral analysis, filtering, and pattern recognition purposes. Inherent "harmonics" affect nearly every algorithmic indicator you have seen or that may come to exist. While encountering a plethora of cycles, you may see exactly how well your indicators/filters perform when "sourced" to this script with `src = input(close, "Source", input.source)`. Keep in mind, open, high, low, and volume variables are NOT available, if they are employed in your indicators calculations. Feel free to tether this to TV built-in indicators or create your own in TV's Pine Editor, if a source input() isn't already provided. See what happens...
Educating you informatively further, there are "synchronous" irregular harmonic frequencies just like this that do in fact exist in tickers everywhere. While this script's specific generated "sinusoidals" are completely stationary, the ones you will see in REAL price action are ephemeral, emerging and disappearing at any time unexpectedly. The remarkable thing about my creation is, you may notice patterns in the generated fundamental "waveform" that are eerily similar to actual stock market fractal patterns encountered everyday. On just spontaneous random chance, I found a recognizable pattern on a watch list asset displayed above, without looking for it before publishing this. I did not cherry pick that or tune the settings to it. I just bumped up the chart interval one notch and offset the waveform quickly.
As you can witness looking closer, there are numerous pure sine waves artificially created with different amplitudes and phase shifts to form unique patterns that combine together in most unique ways appearing fractal in nature. The sine waves are not derived from any ticker price/volume that you maybe viewing, and should look similar on any time frame chosen. Don't worry about chart intervals. The combination of these with simple addition results in the most unique of waveforms in white. You will notice "dominant cycles", as Dr. John Ehlers would describe them, are the prevailers in movement. Yet those smaller cycles have enormous influence over more powerful cycles and ultimately our indicators.
One intention not included at initial release is a preset waveforms input() to instantly generate very specific patterns, such as a pseudo-square wave, sawtooth wave, and many others that may have applications in real world pattern matching. If you happen to come across very unique ones, you may inform me privately via TV chat and I will consider your gracious considerations of discovered settings for inclusion. I'm awaiting Pine arrays to arrive for that major revision. Yes, you have read that correctly. They have been in the TV contributor/developer oven for quite some time. This was revealed in a "public" announcement recently, and I decided to provide you with a "Get Ready Notification" in this script's description, wink-wink. Pine Script endowed with arrays may be used to create and test spectral decomposition analytics code, filters, or what ever else your mind can surmise utilizing this nifty generator script. You now have another tool for your TV tool belt, to aid with spawning the future evolution of indicators on TradingView. Let the tinkering commence...
Features List Includes:
Waveform offset
Nyquist noise injection
Sine wave enable/disable for all sine waves
Cycle period for all sine waves
Amplitude for all sine waves
Phase shift for all sine waves
The comments section below is solely just for commenting and other remarks, ideas, compliments, etc... regarding only this indicator, not others. When available time provides itself, I will consider your inquiries, thoughts, and concepts presented below in the comments section if you do have any questions or comments regarding this indicator. When my indicators achieve more prevalent use by TV members , I may implement more ideas when they present themselves as worthy additions. As always, "Like" it if you simply just like it with a proper thumbs up, and also return to my scripts list occasionally for additional postings. Have a profitable future everyone!

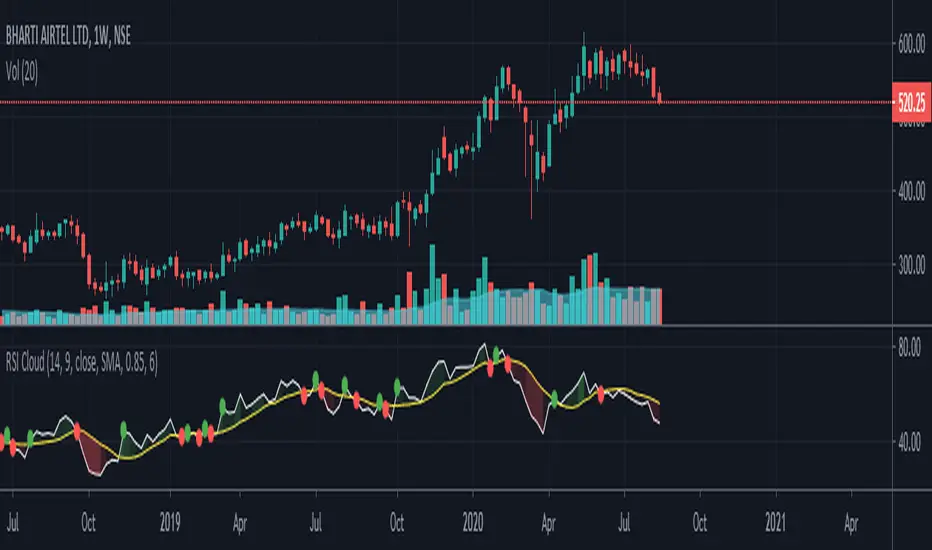
RSI Plus v1.0 by WilsonThis is a modified version of my RSI Cloud indicator. I have included the option to plot 2 moving averages. Type of moving averages included in the script are SMA, EMA, WMA, VWMA, Hull MA and ALMA. Option to fill colors and to add alerts are included. I shall be including more options in a future update.
Anyone is free to copy and modify the script. Wishing everyone happy and profitable trading.

RSI+ by WilsonThis is a modified version of my RSI Cloud indicator. You can plot 2 moving averages over RSI. You have the option to plot moving average types like SMA, EMA, WMA, VWMA, HullMA, and ALMA. You also have the option to plot histograms based on any of the moving averages. You can fill colors between RSI and moving averages. Option to add alerts, crossover and crossunder signals are also included. I have also included a band to show the position of RSI using three colors. Green color is shown when RSI is above both the plotted moving averages. Red color is shown when RSI is below both the plotted moving averages. And Yellow color is shown when RSI is between the two plotted moving averages. Anyone is free to use the script. Wishing everyone happy and profitable trading.

HFT Divergence Hunter IndicatorDefault Settings are meant to be used in BTC/USDT chart on 5 min time frame on Binance Futures. If you want to use for another asset on another time frame YOU MUST CHANGE THE SETTINGS
This is a divergence finding indicator developed by HFT Research. It is a highly customizable indicator and provides endless opportunities to find profitable trades in the market.
Use Envelope, this is the main decision maker in this strategy. The idea behind is that you choose the length of the moving average and set an offset % to create an upper and lower band. If you click on “display envelope” you will be able to visually see the band you have created. This way, you get to scalp the market as the price is diverging and moving away from the moving average. As the famous saying goes, moving averages act like magnets and prices always visits them back. Using this ideology, we aim to capitilize on the price swings that move away from the chosen moving average by x%.
STARC Bands;
These are two bands that are applied above and below a simple moving average of an asset’s price. The upper band is created by adding the value of the average true range (ATR) or a multiple of i. The lower band is created by subtracting the value of the ATR from the SMA. The channel can provide traders with ideas on when to buy or sell. During an overall uptrend, buying near the lower band and selling near the top band is favorable. However, from our testing results it does fairly poorly in crypto markets while it does pretty well in traditional markets.
Use RSI;
One of the most commonly used indicators in the trading world. The idea is simple, buy when its oversold and sell when its overbought. You can use RSI as a secondary confirmation of the dips. It can be turned on and off.
Use MFI
MFI stands for Money Flow Index and it is an oscillator like RSI. However, it does track the price in a different fashion than RSI providing a reliable option. It uses the price and volume data for identifying overbought and oversold signals in an asset.
Use Fisher Transform
Even though, it has a funny name, Fisher is actually a very decent and reliable indicator. It converts the prices into a Gaussian normal distribution channel. Therefore, the indicator detects when the prices have moved to an extreme, based on recent price action.
Use VWAP
VWAP stands for volume weighted average price. It is an extremely useful indicator when trading intra-day. It does reset every trading session which is at 00:00 UTC. Instead of looking at x number of candles and providing an average price, it will take into consideration the volume that’s traded at a certain price and weigh it accordingly. It will NOT give entry signals but act as a filter. If the price is above VWAP will filter out the shorts and other way around for longs.
Use ADX
Average directional index is a powerful indicator when one is assessing the strength of a trend as well as measuring the volatility in the market. Unfortunately, the worst market condition for this strategy is sideways market. ADX becomes a useful tool since it can detect trend. If the volatility is low and there is no real price movement, ADX will pick that up and will not let you get in trades during a sideways market. It will allow you to enter trades only when the market is trending.
Use Super trend Filter
The indicator works well in a trending market but can give false signals when a market is trading in a range.
It uses the ATR (average true range) as part of its calculation which takes into account the volatility of the market. The ATR is adjusted using the multiplier setting which determines how sensitive the indicator is.
Use MA Filter
Lookback: It is an option to look back x number of candles to validate the price crossing. If the market is choppy and the price keeps crossing up and down the moving average you have chosen, it will generate a lot of “noisy” signals. This option allows you to confirm the cross by selecting how many candles the price needs to stay above or below the moving average. Setting it 0 will turn it off.
MA Filter Type: There is a selection of moving averages that is available on TradingView currently. You can choose from 14 different moving average types to detect the trend as accurate as possible.
Filter Length: You can select the length of your moving average. Most commonly used length being 50,100 and 200.
Filter Type: This is our propriety smoothing method in order to make the moving averages lag less and influence the way they are calculated slightly. Type 1 being the normal calculation and type 2 being the secret sauce.
Reverse MA Filter: This option allows you to use the moving average in reverse. For example, the strategy will go long when the price is above the moving average. However, if you use the reserve MA Filter, you will go short when the price is above the moving average. This method works best in sideways market where price usually retraces back to the moving average. So, in an anticipation of price reverting back to the moving average, it is a useful piece of option to use during sideway markets.
Use MACD Filter
MACD here will act as a filter rather than an entry signal generator. There are a few different ways to use this MACD filter. You can click on the Use MACD filter and it will use filter out the shorts generated in a bullish territory and longs generated in the bearish territory. It will greatly reduce the number of trades the strategy will trade because MACD is a lagging indicator. By the time MACD turns bullish or bearish, most of the other indicators will have already generated the signals. Therefore, resulting in less trades. You can use MACD filter as MA oscillator meaning that it will only look at the MA lines in MACD to filter out trades. Alternatively, you can use it with the histogram (Signal lines) meaning that it will only look at the histogram whether its below or above the zero line in order to filter out the trades.
TP (%)
Place your desired take profit percentage here. Default is 1.5%
Move SL At Entry x% Profit
This is when the strategy will move your SL to the entry point if the position reaches x% profit. It can also generate a signal which can be automated to adjust the SL on the exchange.
SL (%)
Place your desired stop loss percentage here. Default is 1%
If you want to get access to this indicator please DM me or visit our website.

RSI Cloud by WilsonThis indicator will help you to be on the right side of the trend always. Wishing you a happy and profitable trading experience.
Intraday Long & Short 5MinRules for using this indicator
1. Time Frame - 5 Min (Recommended) or 15 Min
2. Long Entry - when High of signal candle breaks by any Green candle' close.
3. Short Entry - when Low of signal candle breaks by any Red candle' close.
4. Price might reverse after you take entry till Red line or Green Line and as this indicator is based on Higher High and Lower Low Support and Resistance method. Most of time it will reverse after touching the line. You can confirm the Price action from that point. else Exit.
5. Entry in 5 Min timeframe and holding for swingtrade until overbought and oversold indication appears will give extra profits.
6. DYOR
Like,Comment and add this to favorite if you find it useful.
Consider Donating coins only if this indicator turns profitable for you.
Thank you!

Momentum PinballMomentum Pinball, when you get a buy/sell signal, wait for the next day
enter on the high or low of the first hour and place a stop in the low/high
of the first hour. If the day you get filled closes profitable you can decide to close
the trade buy the end of the day or hold overnight and exit the following morning
Mean Deviation Detector - Throw Out All Other IndicatorsI set out this morning to create a script that searches out price moves that went too far too fast relative to historical pricing, given that such situations often result in the most profitable trading opportunities. I came up with the mean deviation detector. This script should be used as a means of judging how far a price is trading, in percent terms, from it's "average trading zone".
This is extremely helpful in a couple scenarios.
First, it can be used to judge a move's volatility relative to it's previous volatility. Put simply, a 5% move in the stock of Coca Cola is a lot more meaningful than a 5% move in the stock of Tesla, and the detector puts moves into historical (visual) perspective.
Second, the indicator can be used in real time as a means of determining when the chances of mean reversion are high or low. Extreme values are unsustainable and often lead to EITHER A.) price mean reversion or B.) time mean reversion. Put simply, prices either went too far and are due to fall back to a historical mean, or they need more time to digest a potentially new pricing zone.
Without getting too deep into volume profile analysis, the MDD can be a simple way of telling that a stock has moved into an "air pocket", where prices will either come back to the previous volume node (price mean reversion) or set up shop in a new, uncharted area (time mean reversion).
An extreme value doesn't always mean a trading opportunity, but it means that something interesting is happening in the stock / instrument.
I use this indicator to help me trade covered calls. Lots of high yielding weekly opportunities are stocks that have moved too far too fast, and I like to use this indicator as a means of either a.) scooping up stocks that have gotten beat up from a historical mean perspective & have likely seen the risk already "beaten" out of them, or to b.) stay away from stocks that have a very high chance of price correcting lower. In situations where I say that the risk has been "beaten" out of something, it doesn't mean that the stock won't continue to fall, it simply means that the degree and acceleration of the fall has peaked and that risk premiums in selling options will / should easily pay for continued losses. In the event that it's a price correction and not a time correction, you also increase your bat rate because you get auto-liquidated at a max profit. It's a really valuable tool in my kit.
You can also feel free to put a Keltner Chanel overlay onto the MDD to filter out noise, identify "extreme" values, and place mean reversion trades if you expect price mean reversion is likely, if you want to use this as the basis of a proper trading strategy. For a high extreme value, you could sell short term OTM call spreads, for example.
The MDD is adaptable to your own trading style & preferences.

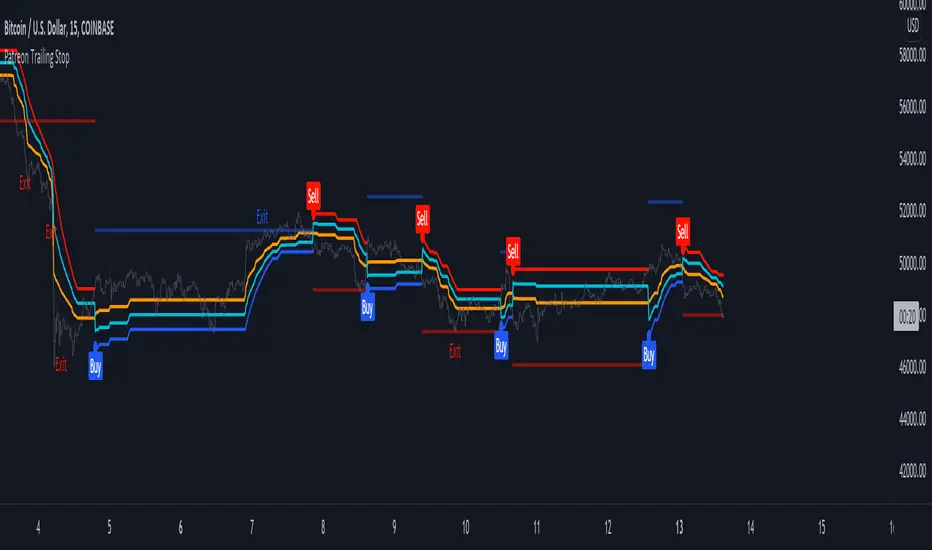
Patreon Trailing StopThe Patreon trailing stop technical indicator can detect trends, find support and resistance points, filter out noise, and help users make informed decisions easily and in a timely manner. In order to provide an accurate and useful indicator most of the efforts during its development were directed toward the minimization of false signals, thus giving to the indicator the potential to further improve your trading strategies.
The trailing stop integrates visual elements for an easier interpretation of the indicator, and integrate alerts based on the buy/sell signals given by the trailing stop. All the outputs of the indicator can be used as input for other indicators.
Settings
In order to make it easier to use, the indicator only possess three user settings:
Length: Control the sensitivity to price variations, with a higher value aiming to detect longer-term trends.
Factor: A setting that aims to filter out false signals, with a higher value filtering more false signals.
Src: Source input of the indicator, by default set to median price (hl2).
Easily Filter Out False Signals
The Factor setting was carefully implemented to filter out false signals without introducing significant delay.
In green/orange the indicator with a Factor setting of 1, in blue/red the indicator with a Factor setting of 10, both using Length = 50 , we can see that increasing factor remove false signals.
The integrated support and resistance line can also help you spot potential false signals:
When the price cross the S/R line before the occurrence of a signal we could expect the upcoming signal to be false, better signals are given when the price cross the S/R at the same time a signal is produced.
Finally, the distance between the trailing stop and the price when a new signal occurs can also help out determine if this signal is false, as a higher distance between the trailing stop and the price suggest a ranging market.
Entering Trades At A Better Position
Indicators can give false signals at the top or bottom of a movement, the Patreon trailing stop can help you enter trades at a more profitable position thanks to the integrated support and resistance line.
When we have a signal but fear it might be false, we can wait for the price to reach the S/R and enter our trade at that point, this allows us to either make a profit or minimize a loss.
Integrated Adaptive Filter
The indicator integrates a trend adaptive filter (in orange), with it you can:
Filter out noisy variations from the price.
Use it as a fast-moving average in a moving average crossover system.
Use it as input for other technical indicators.
Simple moving average with period 200 using the filter as input.
How To Access
The indicator is one of the "Patreon trend following indicators", and can only be used by my Patreons, you can become a Patreon by using the link on my signature.
paratradevsa2Volume spread analysis is basically a tool to discover the correlation of price in relation to volume , in order to determine the short-term outcome of price action, in other words, where the market might be moving next.
I have developed this indicator called VSA. It tracks smart money activity and suggests the potential direction of the market.
This indicator gives signals which can be used in following ways-
-> SOW-
1. Buying Climax - For Sell.
2. Upthrust - For Sell.
-> SOS-
1. Selling Climax - For Buy.
2. Stopping Volume - For Buy.
I hope it helps people who use it and give them profitable results.
The script will be updated regularly if there are any issues.
THANK YOU.
No Repaint No Repaint on the closed candles
Access is through invite only
Do you want to use this Indicator .
To Get access - Send me a private chat message in tradingview.com to get access or request in comment section below.
If you like the script and if this useful like comment share.
Best regards and happy trading.

MCD_Pro01This indicator used for detect banker/institutional and retailer
Green is locked chips (Retailer)
Yellow is floating chips (Hot money)
Red is profitable chips (Banker/Institutional)
With 10 days Banker moving average in purple line
When the Purple line hit the Red bar it mean Banker is starting the upside trend should buy
But if the Purple line is above the Red line it mean Banker is starting downside trend should sell
This is how to short-time investing follow banker

MCDX ProMCDX Pro
Detail Explanation:
This indicator shows the status of operators and how the bankers shake out the locked chips.
Green Bar - Locked Chips
Yellow Bar - Floating Chips
Red Bar - Profitable Chips
How to use the indicators?
There are two bars that need to be focused on this indicator which is the Green Bar and Red Bar.
Green Bar means the market share still in loss and many shareholders that stuck are ready to cut loss. This caused the price of the market shares harder to increase and becoming uptrend again until it breaks certain resistance.
Red Bar means the market share is in profit and many shareholders still want to push the price. The higher the Red Bar, the stronger the momentum of the market shares.
This indicators best to be used in timeframe 5minutes(tf5m), timeframe 30minutes(tf30m), and timeframe 1hour(tf60m).
Contact me if you want to try this indicator.

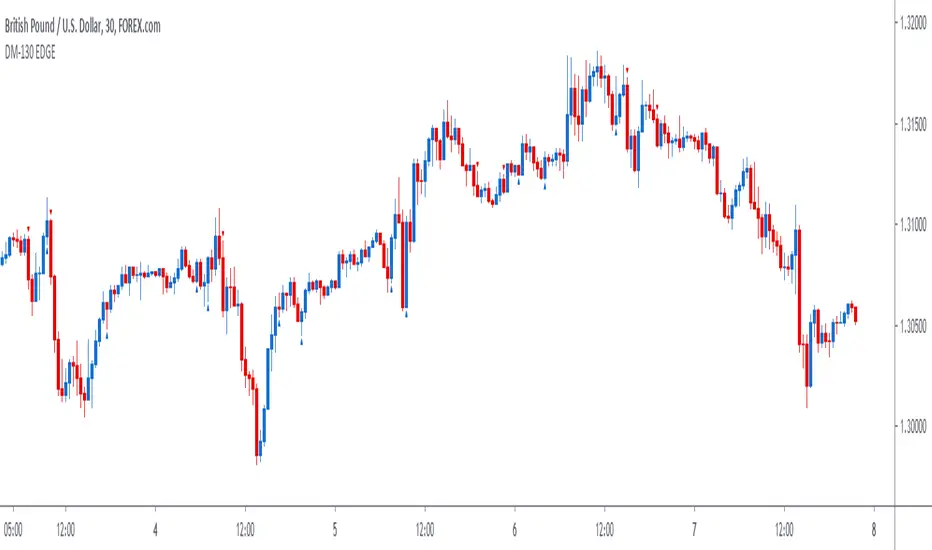
DM-130 EDGE SignalThe DM-130 EDGE is a price action trading signal indicator. There is no need for downloading nor installing. It is an effective signal indicator that has proven to be successful in trading. We will help you set it up within minutes so that you can start trading immediately. It works in trading most markets!
How To Use The DM-130 EDGE:
For a BUY, the signal will display a blue arrow below the candle stick facing upwards when there is a buying opportunity, a pullback or a bullish move in the market.
For a SELL, the signal will display a red arrow above the candle stick facing downwards when there is a selling opportunity, a pullback or a bearish move in the market.
Tradingview Account Level: All Users
The indicator appears once or twice during the UK trading sessions and works best in at confluence points:
1. A Trend Line
2. A Support or Resistant Level
3. Supply or Demand Zone
4. Off Pivots
5. Off a Fibonacci Level
6. In Trend Direction
Best Pair: GBP/USD
Best Trading Times: UK Sessions
How To Set Alerts:
Click on the Alerts button on the charts
Under 'Condition', change from the currency pair displayed to 'DM-130 EDGE Signal'
Then under 'Option' click on 'Once Per Bar'.
Make sure that the you tick the boxes that appeal to you under the 'Alert Actions' part (usually 'Notify on App' and 'Show Popup') and then click the 'Create' button at the bottom.
If you tick the 'Notify on App' box under 'Alerts Actions' the alerts would appear on your smart device if you have the Tradingview App set on the device.
Amongst many great benefits you will 1. Have the confidence to enter trades 2. Have the ability to enter trades after a pullback (something only experienced traders can spot that) and even more importantly 3. You can trade profitably with consistency even if you get stopped out a few times because the wins are usually bigger!
This strategy signal will analyse price action automatically when there is a high probability of a profitable trade to enter.
It does work on most markets. We recommend using the 30m charts as it works best with this indicator. This signal is ideal for intraday/day trading.
This signal allows you to enter trades with confidence.
Use the link below to obtain access to this indicator or you can send us a private message on Tradingview.
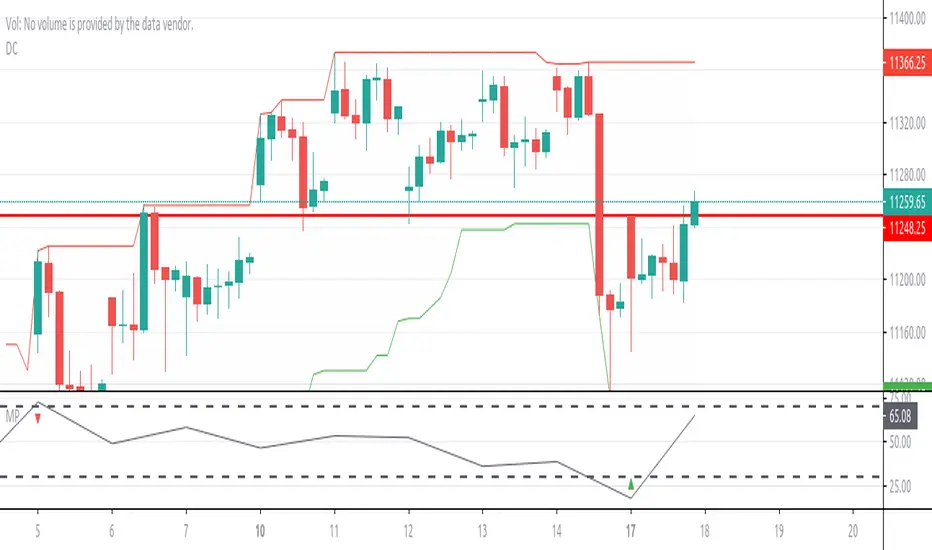
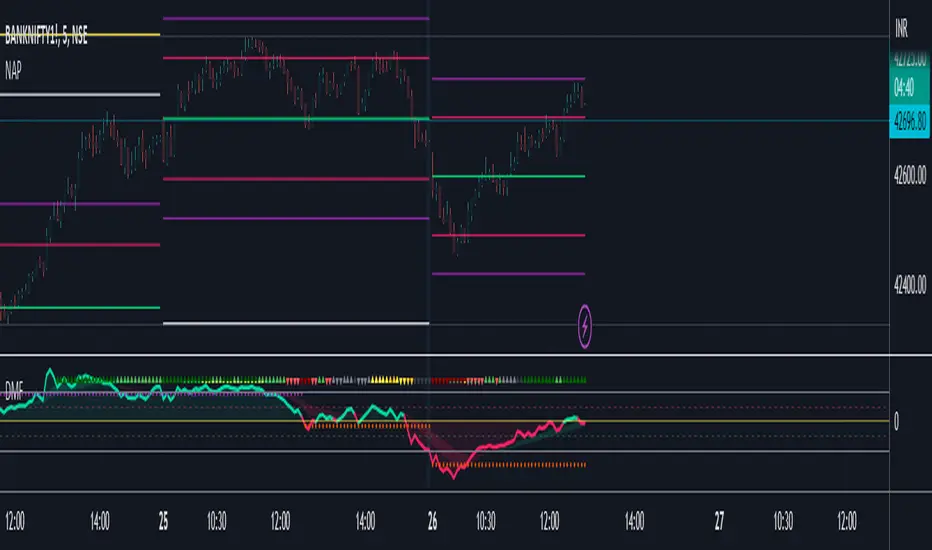
New Age PivotsHere I'm proposing possibly the simplest and most relevant pivot style for intraday traders like me.
It utilizes fundamentals of the average range and devises S/R around that. Pivot point in this is today's open (colored lime), which is far more relevant than yesterday's/past data based pivots.
This is an attempt to reduce the influence of historical data as much as possible, as traders grow in their experience and skill, this becomes the newest and most successful methodology to stay profitable over the long run. Just my pov.
This is purely for educational purposes, no past performance be it visual or mathematical is a guarantee of success in the future. Use it at your own discretion.
The author takes no responsibility of your individual profit or loss. Also, the script will be checked protected for protection against theft, however, you can use it by adding to your favorites.
I've added the ability to hide and view historical S/R as well, it looks best when your chart is clutter-free.
Enjoy~
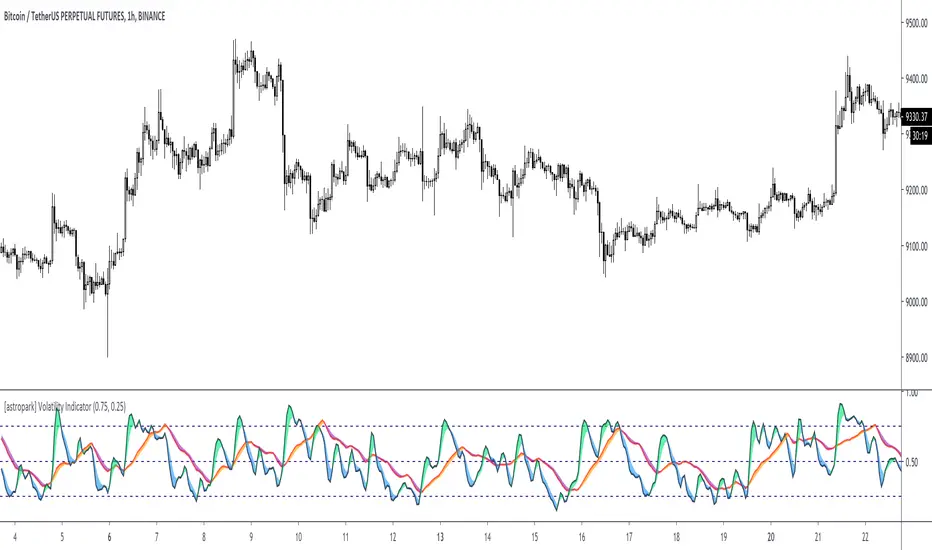
[astropark] Volatility IndicatorDear Followers,
today another interesting script: Volatility Indicator .
This indicator measures the volatility of the market you see in the timeframe you see, in a scale between 0 and 1.
It works on cryptocurrencies, commodities, stocks, indexes and forex.
You will see 2 volatility waves:
a black one (with green and blue shadow for increasing and decreasing mode), which is the "faster" one
a red one (with orange and purple shadow for increasing and decreasing mode), which is the "slower" one
The indicator highlights high volatility when it's near the top (1), while low volatility when near the bottom (0).
You can combine this indicator with your own strategy and indicators to validate them :
on low volatility it often happens that a signal fails to be profitable, as it lacks fuel
while it's better if volatility is over low level as price has more room to run while volatility increasing to the top
This indicator also lets you set alerts when volatility exceeds high level or low level.
This is a premium indicator , so send me a private message in order to get access to this script.
The SetUpps Strategy EDGE SignalThe SetUpps Trading Strategy HM-415 EDGE, DM-130 EDGE and MD-11 are price action trading signal indicators. There is no need for downloading nor installing. It is an effective signal indicator that has proven to be successful in trading. We will help you set it up within minutes so that you can start trading immediately. It works in trading most markets!
How To Use SetUpps Strategy Signals:
For a BUY, the SetUpps Signal will display a blue arrow below the candle stick facing upwards when there is a buying opportunity, a pullback or a bullish move in the market.
For a SELL, the SetUpps Signal will display a red arrow above the candle stick facing downwards when the is a selling opportunity, a pullback or a bearish move in the market.
The indicator works best in at confluence points:
1. A Trend Line
2. A Support or Resistant Level
3. Supply or Demand Zone
4. Off Pivots
5. Off a Fibonacci Level
How To Set Alerts:
Click on the Alerts button on the charts
Under 'Condition', change from the currency pair displayed to 'The SetUpps Strategy EDGE Signal'
Then under 'Option' click on 'Once Per Bar'.
Make sure that the you tick the boxes that appeal to you under the 'Alert Actions' part (usually 'Notify on App' and 'Show Popup') and then click the 'Create' button at the bottom.
If you tick the 'Notify on App' box under 'Alerts Actions' the alerts would appear on your smart device if you have the Tradingview App set on the device.
Amongst many great benefits you will 1. Have the confidence to enter trades 2. Have the ability to enter trades after a pullback (something only experienced traders can spot that) and even more importantly 3. You can trade profitably with consistency even if you get stopped out a few times because the wins are usually bigger!
The SetUpps Trading Strategy signals will analyse price action automatically when there is a high probability of a profitable trade to enter.
It does work on most markets on all time charts but we will give you our recommended time frames that works best with this indicator.
The SetUpps Strategy signal is ideal for scalping, intraday and for swing trading.
This signal allows you to enter trades with confidence.
Disclaimer:
Previous performances are not an indication of any future performances. We are not investment adviser nor do we advice you on trading. All our opinions, information, analysis, prices and/or market commentary are not advice about investments. Any SetUpps™ Trading staff or partners or representatives can not warrant the completeness, accuracy or timeliness of any information we have supplied and we shall not be liable for any losses or damages, consequential or otherwise, incurred by the use of our products which may be the result of relying on the SetUpps™ Trading strategy. © 2020 SetUpps™ Trading.
The SetUpps™ Trading indicator is built for use on Tradingview. SetUpps™ Trading is not part of Tradingview.

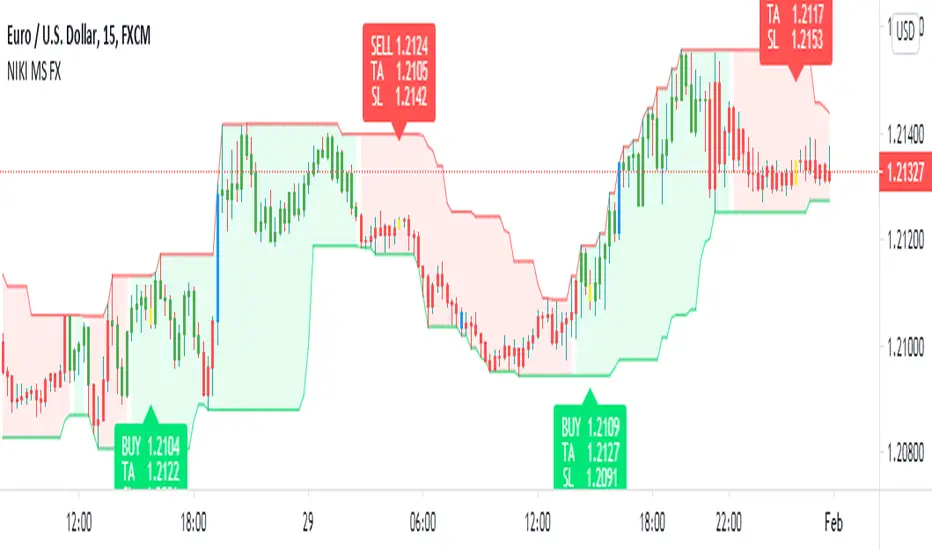
NIKI MS FXSpecially created script for forex and commodity markets. It is more suitable for positional trading. The 1 hour chart shows more profit. It has multi time frame analysis. The Donchian channel acts as a dynamic support and resistance. The signal to signal trading is also profitable based on our back test results. The background color represents the main trend and the color of the candle represents the short term trend. Trade can execute based on 'buy', 'sell' signal.
Contact us using the links below to obtain access to this indicator
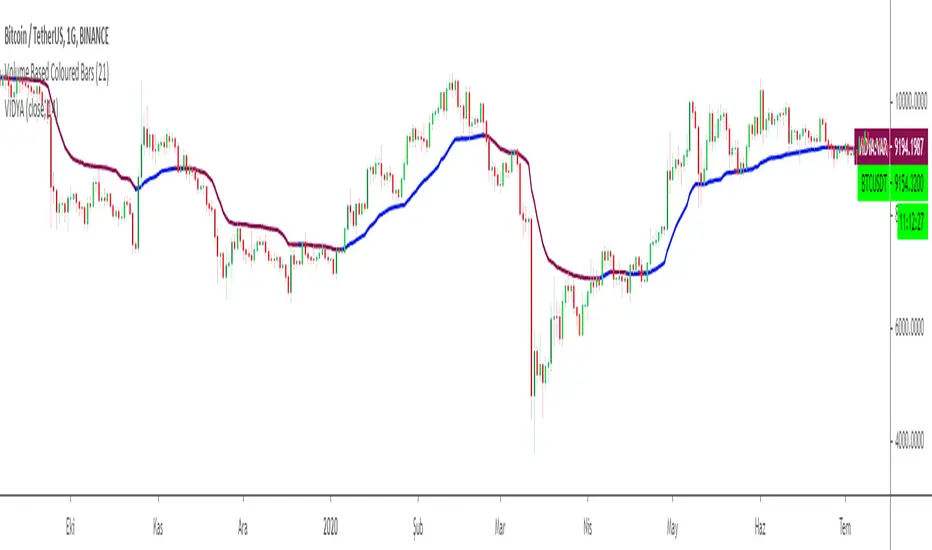
Variable Index Dynamic Average VIDYAChande's Variable Index Dynamic Average (VIDYA) is similar to the Exponential Moving Average (EMA), but automatically adjusts the smoothing weight based on price volatility.
VIDYA was developed by Tushar Chande and presented in Technical Analysis of Stocks & Commodities magazine in March 1992.
In the first version, a standard deviation was used as the Volatility Index
Chande modified VIDYA in October 1995 to use a new Chande Momentum Oscillator (CMO) as the Volatility Index.
So I decided to add an option for the users to change the calculation method.
Default calculation is by using Chande's Momentum Oscillator
Users can change the calculation method to Standart Deviation by unchecking the box on the settings menu.
Another option is to fix the CMO length parameter to 9 to make VIDYA more sensitive to price movements.
CMO parameter is defaultly fixed to 9 but users can change the length of the parameter to the VIDYA length by unchecking the relevant box.
As a moving average, VIDYA smooths the market noises and shows the market trends more clearly.
To achieve the goals, the indicator filters out the market fluctuations (noises) by averaging the price values of the periods, over which it is calculated. In the process, some extra value (weight) is added to the average prices, as it is done during calculations of all weighted indicators, such as EMA, LWMA, and SMMA. But during the VIDIYA indicator's calculation, every period's price receives a weight increment adapted to the current market's volatility.
Note that the value of the smoothing factor (k) is calculated with the help of the period's EMA, and increasing or decreasing of the value is achieved by using CMO Chande Momentum Oscillator as a measure of the market's volatility. As a result, the indicator slows down and does not react to the market's volatility when it increases and, on the contrary, speeds up when a strong steady trend takes place.
Note:
Alarm added for color changes.
Hope you use this one at profitable trades.
Scalper ALThe script is an updated version of our old Scalper 1.1. It includes a linear regression line for trend indication, a moving average line and the buy sell labels. The fluctuation and strength of the trend can be discerned from Pearson's value and its sign. Algorithmic trading can be done by setting an alarm. There is a provision to set target and stop loss in setting window(for algo trading). It's more profitable on the 15 minute chart, and applies to any type of stock.The color of the moving average represents the short term trend.
Contact us using the links below to gain access to this indicator

Kilted Price Action TraderDescription : Uses all the following indicators as a default pre-set template
1. SMA 200 (longer term for direction/trend)
2. EMA 20 (shorter term for assisting with entry)
3. EMA 50 (medium term for assisting with entry)
FEATURES
- Allows you to switch off showing moving averages and all other chart objects so that you can see price action VERY clearly
- Allows you to show the most significant bearish candle patterns (for shorts) or bullish candle patterns (for longs)
- Allows you to show the most significant bearish or bullish candle patterns relative to the longer term SMA (200 being the default)
- Allows you to show bearish and bullish candle patterns relative to the various EMAs
- Allows you to employ good trade and risk management by SCORING YOUR TRADE and allows you to tick off on some good checklist items in order before taking a trade,
showing the result on the chart as a "score ranking" (HIGH, MEDIUM, LOW) so that you can journal your trade and validate that you took a disciplined trade
SUMMARY
This is a Price Action based indicator that allows you to pickup some good default settings for any market and display the most significant candlestick patterns, with the key differentiators being:
- this indicator will show you the most significant profitable candle patterns and you can select to show bullish or bearish setups, or those relative to the longer direction SMA (shows only bullish candles when price is above SMA and only bearish candle patterns when price is below SMA - for safer trades)
- it allows you to SCORE YOUR TRADE with a pre-set checklist BEFORE taking a trade, which is especially good for any experienced trader so that you are continuing to trade your plan and plan your trade
- The scoring systems helps with journaling your trades so that you can show your trade setups and provide evidence that you followed some basic rules and discipline, assisting you to become a better trader
