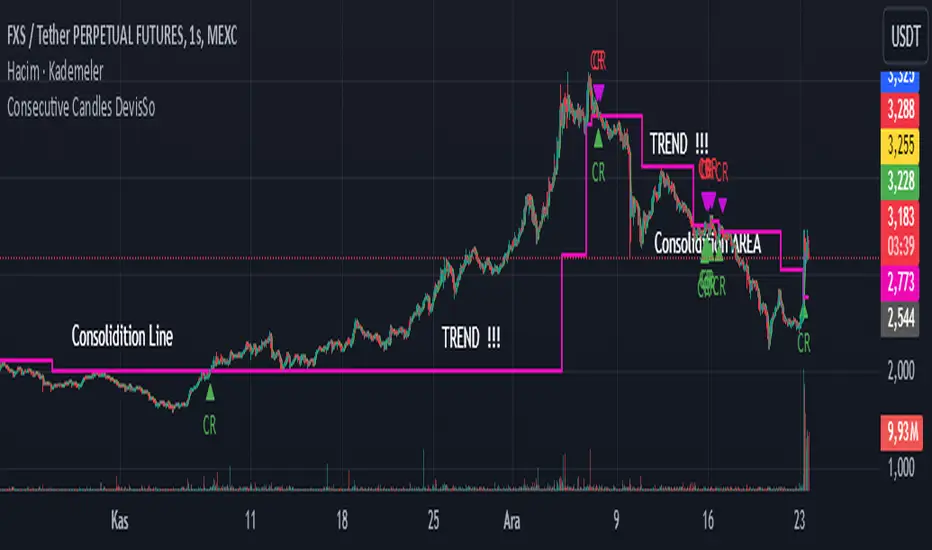
Consecutive Candles DevisSoHi Traders !!!
Level Calculation:
50% and 23.6% Fibonacci levels are calculated based on the open and close of the previous candles.
Consecutive Candle Check:
For an uptrend: Each candle's low must not touch the 50% levels of the previous candles.
For a downtrend: Each candle's high must not touch the 50% levels of the previous candles.
Pullback Level:
When a long signal is triggered, the current candle's low is recorded as a pullback level.
When a short signal is triggered, the current candle's high is recorded as a pullback level.
Breakout and Signal Generation:
If the price breaks above the calculated level, a long signal is generated; if it breaks below, a short signal is generated.
These signals are visualized on the chart.
Continuity:
The system checks the last signal to ensure the validity of new signals, maintaining the consistency of consecutive signals.
Cari dalam skrip untuk "pullback"
3 EMA + RSI with Trail Stop [Free990] (LOW TF)This trading strategy combines three Exponential Moving Averages (EMAs) to identify trend direction, uses RSI to signal exit conditions, and applies both a fixed percentage stop-loss and a trailing stop for risk management. It aims to capture momentum when the faster EMAs cross the slower EMA, then uses RSI thresholds, time-based exits, and stops to close trades.
Short Explanation of the Logic
Trend Detection: When the 10 EMA crosses above the 20 EMA and both are above the 100 EMA (and the current price bar closes higher), it triggers a long entry signal. The reverse happens for a short (the 10 EMA crosses below the 20 EMA and both are below the 100 EMA).
RSI Exit: RSI crossing above a set threshold closes long trades; crossing below another threshold closes short trades.
Time-Based Exit: If a trade is in profit after a set number of bars, the strategy closes it.
Stop-Loss & Trailing Stop: A fixed stop-loss based on a percentage from the entry price guards against large drawdowns. A trailing stop dynamically tightens as the trade moves in favor, locking in potential gains.
Detailed Explanation of the Strategy Logic
Exponential Moving Average (EMA) Setup
Short EMA (out_a, length=10)
Medium EMA (out_b, length=20)
Long EMA (out_c, length=100)
The code calculates three separate EMAs to gauge short-term, medium-term, and longer-term trend behavior. By comparing their relative positions, the strategy infers whether the market is bullish (EMAs stacked positively) or bearish (EMAs stacked negatively).
Entry Conditions
Long Entry (entryLong): Occurs when:
The short EMA (10) crosses above the medium EMA (20).
Both EMAs (short and medium) are above the long EMA (100).
The current bar closes higher than it opened (close > open).
This suggests that momentum is shifting to the upside (short-term EMAs crossing up and price action turning bullish). If there’s an existing short position, it’s closed first before opening a new long.
Short Entry (entryShort): Occurs when:
The short EMA (10) crosses below the medium EMA (20).
Both EMAs (short and medium) are below the long EMA (100).
The current bar closes lower than it opened (close < open).
This indicates a potential shift to the downside. If there’s an existing long position, that gets closed first before opening a new short.
Exit Signals
RSI-Based Exits:
For long trades: When RSI exceeds a specified threshold (e.g., 70 by default), it triggers a long exit. RSI > short_rsi generally means overbought conditions, so the strategy exits to lock in profits or avoid a pullback.
For short trades: When RSI dips below a specified threshold (e.g., 30 by default), it triggers a short exit. RSI < long_rsi indicates oversold conditions, so the strategy closes the short to avoid a bounce.
Time-Based Exit:
If the trade has been open for xBars bars (configurable, e.g., 24 bars) and the trade is in profit (current price above entry for a long, or current price below entry for a short), the strategy closes the position. This helps lock in gains if the move takes too long or momentum stalls.
Stop-Loss Management
Fixed Stop-Loss (% Based): Each trade has a fixed stop-loss calculated as a percentage from the average entry price.
For long positions, the stop-loss is set below the entry price by a user-defined percentage (fixStopLossPerc).
For short positions, the stop-loss is set above the entry price by the same percentage.
This mechanism prevents catastrophic losses if the market moves strongly against the position.
Trailing Stop:
The strategy also sets a trail stop using trail_points (the distance in price points) and trail_offset (how quickly the stop “catches up” to price).
As the market moves in favor of the trade, the trailing stop gradually tightens, allowing profits to run while still capping potential drawdowns if the price reverses.
Order Execution Flow
When the conditions for a new position (long or short) are triggered, the strategy first checks if there’s an opposite position open. If there is, it closes that position before opening the new one (prevents going “both long and short” simultaneously).
RSI-based and time-based exits are checked on each bar. If triggered, the position is closed.
If the position remains open, the fixed stop-loss and trailing stop remain in effect until the position is exited.
Why This Combination Works
Multiple EMA Cross: Combining 10, 20, and 100 EMAs balances short-term momentum detection with a longer-term trend filter. This reduces false signals that can occur if you only look at a single crossover without considering the broader trend.
RSI Exits: RSI provides a momentum oscillator view—helpful for detecting overbought/oversold conditions, acting as an extra confirmation to exit.
Time-Based Exit: Prevents “lingering trades.” If the position is in profit but failing to advance further, it takes profit rather than risking a trend reversal.
Fixed & Trailing Stop-Loss: The fixed stop-loss is your safety net to cap worst-case losses. The trailing stop allows the strategy to lock in gains by following the trade as it moves favorably, thus maximizing profit potential while keeping risk in check.
Overall, this approach tries to capture momentum from EMA crossovers, protect profits with trailing stops, and limit risk through both a fixed percentage stop-loss and exit signals from RSI/time-based logic.

Monest Value Indicator (MVI)
Description
The Monest Value Indicator (MVI) is a modern oscillator designed to address common issues in traditional oscillators like RSI or MACD. Unlike classical oscillators, the MVI dynamically adjusts to relative price movements and market volatility, providing a transparent and reliable valuation for short-term trading decisions.
This indicator normalizes price data around a consensus line and accounts for market volatility using the Average True Range (ATR). It highlights overbought and oversold conditions, offering a unique perspective for traders.
Key Features
Dynamic Overbought/Oversold Levels : Highlights significant price extremes for better entry and exit signals. Volatility Normalization : Adapts to market conditions, ensuring consistent readings across various assets. Consensus-Based Valuation : Uses a moving average of the midrange price for baseline calculations. No Lag or Stickiness : Reacts promptly to price movements without getting stuck in extreme zones.
How It Works
Consensus Line :
Calculated as a 5-day moving average of the midrange:
Consensus = SMA((High + Low) / 2, 5) .
Offset OHLC Data :
All prices are adjusted relative to the consensus line:
Offset Price = Price - Consensus .
Volatility Normalization :
Adjusted prices are normalized using a 5-day ATR divided by 5:
Normalized Price = Offset Price / (ATR / 5) .
MVI Calculation :
The normalized closing price is plotted as the MVI.
Overbought/Oversold Levels :
Default levels are set at +8 (overbought) and -8 (oversold).
How to Use
Identifying Overbought/Oversold Conditions :
When the MVI crosses above +8 , the asset is overbought, signaling a potential reversal or pullback.
When the MVI drops below -8 , the asset is oversold, indicating a potential bounce or upward move.
Trend Confirmation :
Use the MVI to confirm trends by observing sustained movements above or below zero.
Combine with other trend indicators (e.g., Moving Averages) for robust analysis.
Alerts :
Set alerts for when the MVI crosses overbought or oversold levels to stay informed about potential trading opportunities.
Inputs
ATR Length : Default is 5. Adjust to modify the sensitivity of volatility normalization. Consensus Length : Default is 5. Change to tweak the baseline calculation.
Example
Overbought Signal : MVI exceeds +8 , indicating the asset may reverse from an overvalued position. Oversold Signal : MVI drops below -8 , suggesting the asset may recover from an undervalued state. Flat Market : MVI hovers near zero, indicating price consolidation.

Dynamic RSI with Overbought/Oversold LinesDynamic RSI with Overbought/Oversold Lines
This indicator enhances the traditional RSI (Relative Strength Index) by dynamically adjusting the overbought and oversold levels based on the highest and lowest RSI values over a user-defined period. The indicator plots these levels as horizontal lines, allowing traders to visually identify when the market is "overbought" or "oversold."
Features:
Dynamic Overbought/Oversold Levels: Automatically adjusts the overbought and oversold levels based on the highest and lowest RSI values within the defined period, ensuring more accurate signals tailored to the current market conditions.
Customizable RSI Period: Choose your preferred RSI period to suit your trading strategy.
Signal Alerts: Visual signals are displayed when the RSI crosses into the overbought or oversold zone, indicating potential reversal points.
Background Color Alerts: The background changes color when the RSI exceeds overbought or oversold levels, making it easier to spot these important zones at a glance.
Clean and Simple: A minimalist design focusing on the key elements, making it suitable for all traders.
How to Use:
Overbought Zone: When the RSI moves above the overbought line (red), it may indicate that the asset is overbought, signaling a potential price reversal or pullback.
Oversold Zone: When the RSI moves below the oversold line (green), it may indicate that the asset is oversold, signaling a potential price bounce or reversal.
This dynamic RSI indicator is perfect for those looking to capture market extremes and improve their trading decisions. It's especially useful for timeframes like 30-minute and 1-hour charts, where market conditions tend to shift more rapidly.

Global Index Spread RSI StrategyThis strategy leverages the relative strength index (RSI) to monitor the price spread between a global benchmark index (such as AMEX) and the currently opened asset in the chart window. By calculating the spread between these two, the strategy uses RSI to identify oversold and overbought conditions to trigger buy and sell signals.
Key Components:
Global Benchmark Index: The strategy compares the current asset with a predefined global index (e.g., AMEX) to measure relative performance. The choice of a global benchmark allows the trader to analyze the current asset's movement in the context of broader market trends.
Spread Calculation:
The spread is calculated as the percentage difference between the current asset's closing price and the global benchmark index's closing price:
Spread=Current Asset Close−Global Index CloseGlobal Index Close×100
Spread=Global Index CloseCurrent Asset Close−Global Index Close×100
This metric provides a measure of how the current asset is performing relative to the global index. A positive spread indicates the asset is outperforming the benchmark, while a negative spread signals underperformance.
RSI of the Spread: The RSI is then calculated on the spread values. The RSI is a momentum oscillator that ranges from 0 to 100 and is commonly used to identify overbought or oversold conditions in asset prices. An RSI below 30 is considered oversold, indicating a potential buying opportunity, while an RSI above 70 is overbought, suggesting that the asset may be due for a pullback.
Strategy Logic:
Entry Condition: The strategy enters a long position when the RSI of the spread falls below the oversold threshold (default 30). This suggests that the asset may have been oversold relative to the global benchmark and might be due for a reversal.
Exit Condition: The strategy exits the long position when the RSI of the spread rises above the overbought threshold (default 70), indicating that the asset may have become overbought and a price correction is likely.
Visual Reference:
The RSI of the spread is plotted on the chart for visual reference, making it easier for traders to monitor the relative strength of the asset in relation to the global benchmark.
Overbought and oversold levels are also drawn as horizontal reference lines (70 and 30), along with a neutral level at 50 to show market equilibrium.
Theoretical Basis:
The strategy is built on the mean reversion principle, which suggests that asset prices tend to revert to a long-term average over time. When prices move too far from this mean—either being overbought or oversold—they are likely to correct back toward equilibrium. By using RSI to identify these extremes, the strategy aims to profit from price reversals.
Mean Reversion: According to financial theory, asset prices oscillate around a long-term average, and any extreme deviation (overbought or oversold conditions) presents opportunities for price corrections (Poterba & Summers, 1988).
Momentum Indicators (RSI): The RSI is widely used in technical analysis to measure the momentum of an asset. Its application to the spread between the asset and a global benchmark allows for a more nuanced view of relative performance and potential turning points in the asset's price trajectory.
Practical Application:
This strategy works best in markets where relative strength is a key factor in decision-making, such as in equity indices, commodities, or forex markets. By assessing the performance of the asset relative to a global benchmark and utilizing RSI to identify extremes in price movements, the strategy helps traders to make more informed decisions based on potential mean reversion points.
While the "Global Index Spread RSI Strategy" offers a method for identifying potential price reversals based on relative strength and oversold/overbought conditions, it is important to recognize that no strategy is foolproof. The strategy assumes that the historical relationship between the asset and the global benchmark will hold in the future, but financial markets are subject to a wide array of unpredictable factors that can lead to sudden changes in price behavior.
Risk of False Signals:
The strategy relies heavily on the RSI to trigger buy and sell signals. However, like any momentum-based indicator, RSI can generate false signals, particularly in highly volatile or trending markets. In such conditions, the strategy may enter positions too early or exit too late, leading to potential losses.
Market Context:
The strategy may not account for macroeconomic events, news, or other market forces that could cause sudden shifts in asset prices. External factors, such as geopolitical developments, monetary policy changes, or financial crises, can cause a divergence between the asset and the global benchmark, leading to incorrect conclusions from the strategy.
Overfitting Risk:
As with any strategy that uses historical data to make decisions, there is a risk of overfitting the model to past performance. This could result in a strategy that works well on historical data but performs poorly in live trading conditions due to changes in market dynamics.
Execution Risks:
The strategy does not account for slippage, transaction costs, or liquidity issues, which can impact the execution of trades in real-market conditions. In fast-moving markets, prices may move significantly between order placement and execution, leading to worse-than-expected entry or exit prices.
No Guarantee of Profit:
Past performance is not necessarily indicative of future results. The strategy should be used with caution, and risk management techniques (such as stop losses and position sizing) should always be implemented to protect against significant losses.
Traders should thoroughly test and adapt the strategy in a simulated environment before applying it to live trades, and consider seeking professional advice to ensure that their trading activities align with their risk tolerance and financial goals.
References:
Poterba, J. M., & Summers, L. H. (1988). Mean Reversion in Stock Prices: Evidence and Implications. Journal of Financial Economics, 22(1), 27-59.

Wick Trend Analysis with Supertrend and RSI -AYNETScientific Explanation
1. Wick Trend Analysis
Upper and Lower Wicks:
Calculated based on the difference between the high or low price and the candlestick body (open and close).
The trend of these wick lengths is derived using the Simple Moving Average (SMA) over the defined trend_length period.
Trend Direction:
Positive change (ta.change > 0) indicates an increasing trend.
Negative change (ta.change < 0) indicates a decreasing trend.
2. Supertrend Indicator
ATR Bands:
The Supertrend uses the Average True Range (ATR) to calculate dynamic upper and lower bands:
upper_band
=
hl2
+
(
supertrend_atr_multiplier
×
ATR
)
upper_band=hl2+(supertrend_atr_multiplier×ATR)
lower_band
=
hl2
−
(
supertrend_atr_multiplier
×
ATR
)
lower_band=hl2−(supertrend_atr_multiplier×ATR)
Trend Detection:
If the price is above the upper band, the Supertrend moves to the lower band.
If the price is below the lower band, the Supertrend moves to the upper band.
The Supertrend helps identify the prevailing market trend.
3. RSI (Relative Strength Index)
The RSI measures the momentum of price changes and ranges between 0 and 100:
Overbought Zone (Above 70): Indicates that the price may be overextended and due for a pullback.
Oversold Zone (Below 30): Indicates that the price may be undervalued and due for a reversal.
Visualization Features
Wick Trend Lines:
Upper wick trend (green) and lower wick trend (red) show the relative strength of price rejection on both sides.
Wick Trend Area:
The area between the upper and lower wick trends is filled dynamically:
Green: Upper wick trend is stronger.
Red: Lower wick trend is stronger.
Supertrend Line:
Displays the Supertrend as a blue line to highlight the market's directional bias.
RSI:
Plots the RSI line, with horizontal dotted lines marking the overbought (70) and oversold (30) levels.
Applications
Trend Confirmation:
Use the Supertrend and wick trends together to confirm the market's directional bias.
For example, a rising lower wick trend with a bullish Supertrend suggests strong bullish sentiment.
Momentum Analysis:
Combine the RSI with wick trends to assess the strength of price movements.
For example, if the RSI is oversold and the lower wick trend is increasing, it may signal a potential reversal.
Signal Generation:
Generate entry signals when all three indicators align:
Bullish Signal:
Lower wick trend increasing.
Supertrend bullish.
RSI rising from oversold.
Bearish Signal:
Upper wick trend increasing.
Supertrend bearish.
RSI falling from overbought.
Future Improvements
Alert System:
Add alerts for alignment of Supertrend, RSI, and wick trends:
pinescript
Kodu kopyala
alertcondition(upper_trend_direction == 1 and supertrend < close and rsi > 50, title="Bullish Signal", message="Bullish alignment detected.")
alertcondition(lower_trend_direction == 1 and supertrend > close and rsi < 50, title="Bearish Signal", message="Bearish alignment detected.")
Custom Thresholds:
Add thresholds for wick lengths and RSI levels to filter weak signals.
Multiple Timeframes:
Incorporate multi-timeframe analysis for more robust signal generation.
Conclusion
This script combines wick trends, Supertrend, and RSI to create a comprehensive framework for analyzing market sentiment and detecting potential trading opportunities. By visualizing trends, market bias, and momentum, traders can make more informed decisions and reduce reliance on single-indicator strategies.

Stoch RSI and RSI Buy/Sell Signals with MACD Trend FilterDescription of the Indicator
This Pine Script is designed to provide traders with buy and sell signals based on the combination of Stochastic RSI, RSI, and MACD indicators, enhanced by the confirmation of candle colors. The primary goal is to facilitate informed trading decisions in various market conditions by utilizing different indicators and their interactions. The script allows customization of various parameters, providing flexibility for traders to adapt it to their specific trading styles.
Usefulness
This indicator is not just a mashup of existing indicators; it integrates the functionality of multiple momentum and trend-detection methods into a cohesive trading tool. The combination of Stochastic RSI, RSI, and MACD offers a well-rounded approach to analyzing market conditions, allowing traders to identify entry and exit points effectively. The inclusion of color-coded signals (strong vs. weak) further enhances its utility by providing visual cues about the strength of the signals.
How to Use This Indicator
Input Settings: Adjust the parameters for the Stochastic RSI, RSI, and MACD to fit your trading style. Set the overbought/oversold levels according to your risk tolerance.
Signal Colors:
Strong Buy Signal: Indicated by a green label and confirmed by a green candle (close > open).
Weak Buy Signal: Indicated by a blue label and confirmed by a green candle (close > open).
Strong Sell Signal: Indicated by a red label and confirmed by a red candle (close < open).
Weak Sell Signal: Indicated by an orange label and confirmed by a red candle (close < open).
Example Trading Strategy Using This Indicator
To effectively use this indicator as part of your trading strategy, follow these detailed steps:
Setup:
Timeframe : Select a timeframe that aligns with your trading style (e.g., 15-minute for intraday, 1-hour for swing trading, or daily for longer-term positions).
Indicator Settings : Customize the Stochastic RSI, RSI, and MACD parameters to suit your trading approach. Adjust overbought/oversold levels to match your risk tolerance.
Strategy:
1. Strong Buy Entry Criteria :
Wait for a strong buy signal (green label) when the RSI is at or below the oversold level (e.g., ≤ 35), indicating a deeply oversold market. Confirm that the MACD shows a decreasing trend (bearish momentum weakening) to validate a potential reversal. Ensure the current candle is green (close > open) if candle color confirmation is enabled.
Example Use : On a 1-hour chart, if the RSI drops below 35, MACD shows three consecutive bars of decreasing negative momentum, and a green candle forms, enter a buy position. This setup signals a robust entry with strong momentum backing it.
2. Weak Buy Entry Criteria :
Monitor for weak buy signals (blue label) when RSI is above the oversold level but still below the neutral (e.g., between 36 and 50). This indicates a market recovering from an oversold state but not fully reversing yet. These signals can be used for early entries with additional confirmations, such as support levels or higher timeframe trends.
Example Use : On the same 1-hour chart, if RSI is at 45, the MACD shows momentum stabilizing (not necessarily negative), and a green candle appears, consider a partial or cautious entry. Use this as an early warning for a potential bullish move, especially when higher timeframe indicators align.
3. Strong Sell Entry Criteria :
Look for a strong sell signal (red label) when RSI is at or above the overbought level (e.g., ≥ 65), signaling a strong overbought condition. The MACD should show three consecutive bars of increasing positive momentum to indicate that the bullish trend is weakening. Ensure the current candle is red (close < open) if candle color confirmation is enabled.
Example Use : If RSI reaches 70, MACD shows increasing momentum that starts to level off, and a red candle forms on a 1-hour chart, initiate a short position with a stop loss set above recent resistance. This is a high-confidence signal for potential price reversal or pullback.
4. Weak Sell Entry Criteria :
Use weak sell signals (orange label) when RSI is between the neutral and overbought levels (e.g., between 50 and 64). These can indicate potential short opportunities that might not yet be fully mature but are worth monitoring. Look for other confirmations like resistance levels or trendline touches to strengthen the signal.
Example Use : If RSI reads 60 on a 1-hour chart, and the MACD shows slight positive momentum with signs of slowing down, place a cautious sell position or scale out of existing long positions. This setup allows you to prepare for a possible downtrend.
Trade Management:
Stop Loss : For buy trades, place stop losses below recent swing lows. For sell trades, set stops above recent swing highs to manage risk effectively.
Take Profit : Target nearby resistance or support levels, apply risk-to-reward ratios (e.g., 1:2), or use trailing stops to lock in profits as price moves in your favor.
Confirmation : Align these signals with broader trends on higher timeframes. For example, if you receive a weak buy signal on a 15-minute chart, check the 1-hour or daily chart to ensure the overall trend is not bearish.
Real-World Example: Imagine trading on a 15-minute chart :
For a buy:
A strong buy signal (green) appears when the RSI dips to 32, MACD shows declining bearish momentum, and a green candle forms. Enter a buy position with a stop loss below the most recent support level.
Alternatively, a weak buy signal (blue) appears when RSI is at 47. Use this as a signal to start monitoring the market closely or enter a smaller position if other indicators (like support and volume analysis) align.
For a sell:
A strong sell signal (red) with RSI at 72 and a red candle signals to short with conviction. Place your stop loss just above the last peak.
A weak sell signal (orange) with RSI at 62 might prompt caution but can still be acted on if confirmed by declining volume or touching a resistance level.
These strategies show how to blend both strong and weak signals into your trading for more nuanced decision-making.
Technical Analysis of the Code
1. Stochastic RSI Calculation:
The script calculates the Stochastic RSI (stochRsiK) using the RSI as input and smooths it with a moving average (stochRsiD).
Code Explanation : ta.stoch(rsi, rsi, rsi, stochLength) computes the Stochastic RSI, and ta.sma(stochRsiK, stochSmoothing) applies smoothing.
2. RSI Calculation :
The RSI is computed over a user-defined period and checks for overbought or oversold conditions.
Code Explanation : rsi = ta.rsi(close, rsiLength) calculates RSI values.
3. MACD Trend Filter :
MACD is calculated with fast, slow, and signal lengths, identifying trends via three consecutive bars moving in the same direction.
Code Explanation : = ta.macd(close, macdLengthFast, macdLengthSlow, macdSignalLength) sets MACD values. Conditions like macdLine < macdLine confirm trends.
4. Buy and Sell Conditions :
The script checks Stochastic RSI, RSI, and MACD values to set buy/sell flags. Candle color filters further confirm valid entries.
Code Explanation : buyConditionMet and sellConditionMet logically check all conditions and toggles (enableStochCondition, enableRSICondition, etc.).
5. Signal Flags and Confirmation :
Flags track when conditions are met and ensure signals only appear on appropriate candle colors.
Code Explanation : Conditional blocks (if statements) update buyFlag and sellFlag.
6. Labels and Alerts :
The indicator plots "BUY" or "SELL" labels with the RSI value when signals trigger and sets alerts through alertcondition().
Code Explanation : label.new() displays the signal, color-coded for strength based on RSI.
NOTE : All strategies can be enabled or disabled in the settings, allowing traders to customize the indicator to their preferences and trading styles.

Swing Breakout Sequence [LuxAlgo]The Swing Breakout Sequence tool enables traders to identify a directional price action scalping sequence comprising two unsuccessful breakouts in the same direction, with the expectation of a third.
🔶 USAGE
This sequence looks for pressure on one side of a swing zone.
The market tried to break out of the zone twice but failed. This led to a pullback into the zone after each attempt. Once a reversal inside the zone is identified, the sequence is complete. It is expected that the market will move from the final reversal within the zone to the final breakout attempt outside the zone.
The sequence of price action is as follows:
Point 1: Breakout attempt out of the swing zone
Point 2: Pullback into the zone
Point 3: Breakout attempt out of Point 1
Point 4: Pullback into the zone, tapping into Point 2 liquidity
Point 5: Reversal structure with Point 4 in the form of a double top or double bottom
This sequence assumes traders will be caught off-guard when they try to capitalize on the initial breakout at Point 1, which is likely to result in a loss. If the breakout at Point 3 fails, all traders will be caught out and switch positions.
If there is enough pressure in the swing zone to cause a reversal at Point 5, the trapped traders could be the start of the next breakout attempt.
🔹 Sequence Detection
Traders can define sequence behavior and adjust detection with three parameters from the Settings panel.
Disabling Points 4 and 5 will detect the most uncompleted sequences.
🔹 Showing/Hiding Elements
Traders can change the look of sequences by showing or hiding their parts using the Style settings.
🔶 SETTINGS
Swing Length: Number of candles to confirm a swing high or swing low. A higher number detects larger swings.
Internal Length: Number of candles to confirm a internal high or internal low. A lower number detects smaller swings. It must be the same size or smaller than the swing length.
🔹 Detection
Point 4 Beyond Point 2: It only detects sequences where Point 4 is beyond Point 2.
Show Point 5: Enable/disable Point 5 detection.
Require Equal H/L at Point 5: Enable/Disable double top/bottom detection at Point 5 within a given threshold. A bigger value detects more sequences.
🔹 Style
Show Sequence Path: Enable/disable a line between sequence points.
Show Boxes: Enable/disable colored boxes for each sequence.
Show Lines: Enable/disable horizontal lines from each point of the sequence.
Default Color: Define the color or enable/disable auto color.

Savitzky-Golay Z-Score [BackQuant]Savitzky-Golay Z-Score
The Savitzky-Golay Z-Score is a powerful trading indicator that combines the precision of the Savitzky-Golay filter with the statistical strength of the Z-Score. This advanced indicator is designed to detect trend shifts, identify overbought or oversold conditions, and highlight potential divergences in the market, providing traders with a unique edge in detecting momentum changes and trend reversals.
Core Concept: Savitzky-Golay Filter
The Savitzky-Golay filter is a widely-used smoothing technique that preserves important signal features such as peak detection while filtering out noise. In this indicator, the filter is applied to price data (default set to HLC3) to smooth out volatility and produce a cleaner trend line. By specifying the window size and polynomial degree, traders can fine-tune the degree of smoothing to match their preferred trading style or market conditions.
Z-Score: Measuring Deviation
The Z-Score is a statistical measure that indicates how far the current price is from its mean in terms of standard deviations. In trading, the Z-Score can be used to identify extreme price moves that are likely to revert or continue trending. A positive Z-Score means the price is above the mean, while a negative Z-Score indicates the price is below the mean.
This script calculates the Z-Score based on the Savitzky-Golay filtered price, enabling traders to detect moments when the price is diverging from its typical range and may present an opportunity for a trade.
Long and Short Conditions
The Savitzky-Golay Z-Score generates clear long and short signals based on the Z-Score value:
Long Signals : When the Z-Score is positive, indicating the price is above its smoothed mean, a long signal is generated. The color of the bars turns green, signaling upward momentum.
Short Signals : When the Z-Score is negative, indicating the price is below its smoothed mean, a short signal is generated. The bars turn red, signaling downward momentum.
These signals allow traders to follow the prevailing trend with confidence, using statistical backing to avoid false signals from short-term volatility.
Standard Deviation Levels and Extreme Levels
This indicator includes several features to help visualize overbought and oversold conditions:
Standard Deviation Levels: The script plots horizontal lines at +1, +2, -1, and -2 standard deviations. These levels provide a reference for how far the current price is from the mean, allowing traders to quickly identify when the price is moving into extreme territory.
Extreme Levels: Additional extreme levels at +3 and +4 (and their negative counterparts) are plotted to highlight areas where the price is highly likely to revert. These extreme levels provide important insight into market conditions that are far outside the norm, signaling caution or potential reversal zones.
The indicator also adapts the color shading of these extreme zones based on the Z-Score’s strength. For example, the area between +3 and +4 is shaded with a stronger color when the Z-Score approaches these values, giving a visual representation of market pressure.
Divergences: Detecting Hidden and Regular Signals
A key feature of the Savitzky-Golay Z-Score is its ability to detect bullish and bearish divergences, both regular and hidden:
Regular Bullish Divergence: This occurs when the price makes a lower low while the Z-Score forms a higher low. It signals that bearish momentum is weakening, and a bullish reversal could be near.
Hidden Bullish Divergence: This divergence occurs when the price makes a higher low while the Z-Score forms a lower low. It signals that bullish momentum may continue after a temporary pullback.
Regular Bearish Divergence: This occurs when the price makes a higher high while the Z-Score forms a lower high, signaling that bullish momentum is weakening and a bearish reversal may be near.
Hidden Bearish Divergence: This divergence occurs when the price makes a lower high while the Z-Score forms a higher high, indicating that bearish momentum may continue after a temporary rally.
These divergences are plotted directly on the chart, making it easier for traders to spot when the price and momentum are out of sync and when a potential reversal may occur.
Customization and Visualization
The Savitzky-Golay Z-Score offers a range of customization options to fit different trading styles:
Window Size and Polynomial Degree: Adjust the window size and polynomial degree of the Savitzky-Golay filter to control how much smoothing is applied to the price data.
Z-Score Lookback Period: Set the lookback period for calculating the Z-Score, allowing traders to fine-tune the sensitivity to short-term or long-term price movements.
Display Options: Choose whether to display standard deviation levels, extreme levels, and divergence labels on the chart.
Bar Color: Color the price bars based on trend direction, with green for bullish trends and red for bearish trends, allowing traders to easily visualize the current momentum.
Divergences: Enable or disable divergence detection, and adjust the lookback periods for pivots used to detect regular and hidden divergences.
Alerts and Automation
To ensure you never miss an important signal, the indicator includes built-in alert conditions for the following events:
Positive Z-Score (Long Signal): Triggers an alert when the Z-Score crosses above zero, indicating a potential buying opportunity.
Negative Z-Score (Short Signal): Triggers an alert when the Z-Score crosses below zero, signaling a potential short opportunity.
Shifting Momentum: Alerts when the Z-Score is shifting up or down, providing early warning of changing market conditions.
These alerts can be configured to notify you via email, SMS, or app notification, allowing you to stay on top of the market without having to constantly monitor the chart.
Trading Applications
The Savitzky-Golay Z-Score is a versatile tool that can be applied across multiple trading strategies:
Trend Following: By smoothing the price and calculating the Z-Score, this indicator helps traders follow the prevailing trend while avoiding false signals from short-term volatility.
Mean Reversion: The Z-Score highlights moments when the price is far from its mean, helping traders identify overbought or oversold conditions and capitalize on potential reversals.
Divergence Trading: Regular and hidden divergences between the Z-Score and price provide early warning of trend reversals, allowing traders to enter trades at opportune moments.
Final Thoughts
The Savitzky-Golay Z-Score is an advanced statistical tool designed to provide a clearer view of market trends and momentum. By applying the Savitzky-Golay filter and Z-Score analysis, this indicator reduces noise and highlights key areas where the market may reverse or accelerate, giving traders a significant edge in understanding price behavior.
Whether you’re a trend follower or a reversal trader, this indicator offers the flexibility and insights you need to navigate complex markets with confidence.
ADX with Alerts for Strong Trending ConditionsMad Props to Chat GPT. Basically, this thing lets you set alerts on the ADX being Above 20 AND the Positive or Negative Directional Movement Line being Above the ADX. Useful for being alerted when a strong trend is in place to look for the pullback.
Description
The ADX with Custom Alerts indicator is designed to assist traders in identifying trends and potential trading opportunities based on the Average Directional Index (ADX) and Directional Indicators (DI+ and DI-). This tool provides a clear visual representation of market strength and directional movement, enhancing decision-making in trading.
Features
ADX Calculation:
The ADX measures the strength of a trend, regardless of its direction. The indicator calculates the ADX using a configurable length and a smoothing parameter, allowing traders to customize it based on their trading preferences.
Directional Indicators:
DI+: Represents bullish momentum.
DI-: Represents bearish momentum.
The indicator plots both DI+ and DI- alongside the ADX to give a complete picture of market direction.
Alert Conditions:
The indicator includes custom alert conditions that notify traders when:
Condition 1: The ADX rises above the defined threshold (default set at 20) and DI+ is above the ADX, indicating potential bullish momentum.
Condition 2: The ADX rises above the defined threshold and DI- is above the ADX, indicating potential bearish momentum.
Visual Representation:
The ADX line is plotted in blue, with the DI+ line in green and the DI- line in red.
A dotted horizontal line represents the ADX threshold, providing a clear visual cue for trend strength.
Background Highlighting:
The indicator uses background coloring to enhance visual analysis:
Green shading indicates when DI+ is above the ADX, suggesting bullish conditions.
Red shading indicates when DI- is above the ADX, suggesting bearish conditions.
Customizable Parameters:
Traders can adjust the length of the ADX calculation, the smoothing factor, and the threshold level to suit their trading strategies and timeframes.
Usage
This indicator is particularly useful for traders looking to:
Identify strong trends and potential entry points based on trend strength.
Make informed decisions using alerts that signal important market conditions.
Enhance their trading strategies with clear visual cues and customizable parameters.

Mean Reversion Indictor, Based on Standard Deviations Description:
The Reversal Candle Mean Reversion Indicator is designed for traders seeking to identify potential reversal points in the market based on key price action and volatility. This indicator combines price action analysis (sweeping prior highs or lows) with mean reversion theory, highlighting opportunities where the price tests or touches a moving average's standard deviation bands.
By focusing on these moments of price extremes, the indicator helps traders spot bullish and bearish reversal signals when the price retraces from volatile movements. These conditions often signal a return to the mean—an ideal setup for reversal traders who thrive on fading exaggerated price moves.
How It Works:
1. Price Action Reversal Signal:
* Bullish Reversal: The indicator flags a bullish signal when the current candle's low sweeps the prior candle's low, and the candle closes higher than the prior candle's close.
* Bearish Reversal: The indicator flags a bearish signal when the current candle's high sweeps the prior candle's high, and the candle closes lower than the prior candle's close.
2. Mean Reversion Confirmation:
* Mean Reversion Signal is triggered when the price touches or tests the upper or lower bands, calculated using a user-selected moving average (SMA, EMA, WMA, VWMA, or Hull MA) and standard deviation.
* The indicator combines price action and volatility, providing stronger reversal signals when the price reaches an extreme distance from the moving average.
3. Customization Options:
* Moving Average Type: Choose from SMA, EMA, WMA, VWMA, or Hull MA.
* Moving Average Length: Adjust the length of the moving average (default: 20).
* Standard Deviation Multiplier: Set the number of standard deviations for the volatility bands (default: 2.0).
* Custom Candle Colors: Choose custom colors for bullish and bearish reversal candles to easily spot signals.
How to Use for Trading Reversals:
1. Identify Extremes:
* Watch for candles where the price tests or touches the standard deviation bands. These are key moments when the price has moved significantly from the moving average, indicating a potential overbought or oversold condition.
2. Look for Reversals:
* When the price tests a band and simultaneously forms a bullish reversal pattern (sweeping the prior low and closing higher), it signals a potential mean reversion to the upside.
* When the price tests a band and forms a bearish reversal pattern (sweeping the prior high and closing lower), it signals a potential mean reversion to the downside.
3. Entry Points:
* Long Trades: Enter a long trade after a bullish signal appears (green candle) near the lower band, indicating a likely price reversal back towards the mean.
* Short Trades: Enter a short trade after a bearish signal appears (red candle) near the upper band, indicating a likely price pullback.
4. Exit Strategy:
* Set a profit target at the moving average (the mean) or a specific price level based on your strategy.
* Consider using a trailing stop to capture additional profit in case of a stronger reversal beyond the mean.
5. Risk Management:
* Place stops just below the low of the bullish reversal candle or just above the high of the bearish reversal candle to manage risk efficiently.

Color Coded RSI [Phantom]Color Coded RSI
The Color Coded RSI enhances the standard RSI (Relative Strength Index) by applying dynamic color coding to the price bars, making it easier to visualize RSI levels directly on the chart.
Key Feature:
RSI-Based Color Coding: Price bars change color based on RSI values. High RSI values (above 70) show warm colors (red/orange), signaling potential overbought conditions, while low RSI values (below 30) display cool colors (blue), indicating possible oversold levels.
How to Trade with Color Coded RSI:
Overbought (Red/Orange Bars):
When the bars turn red or orange (RSI above 70), the market might be overbought. This could be a signal to sell or exit long positions, expecting a pullback.
Oversold (Blue Bars):
Blue bars (RSI below 30) suggest the market is oversold. Look for buying opportunities or consider exiting short positions, anticipating a rebound.
Neutral (Gray/Green Bars):
Gray or green bars (RSI near 50) indicate neutral conditions. You may want to wait for a clearer trend before taking action.
RSI is best used with other indicators to provide confirmations.

Uptrick: Dual Moving Average Volume Oscillator
Title: Uptrick: Dual Moving Average Volume Oscillator (DPVO)
### Overview
The "Uptrick: Dual Moving Average Volume Oscillator" (DPVO) is an advanced trading tool designed to enhance market analysis by integrating volume data with price action. This indicator is specially developed to provide traders with deeper insights into market dynamics, making it easier to spot potential entry and exit points based on volume and price interactions. The DPVO stands out by offering a sophisticated approach to traditional volume analysis, setting it apart from typical volume indicators available on the TradingView platform.
### Unique Features
Unlike traditional indicators that analyze volume and price movements separately, the DPVO combines these two critical elements to offer a comprehensive view of market behavior. By calculating the Volume Impact, which involves the product of the exponential moving averages (EMAs) of volume and the price range (close - open), this indicator highlights significant trading activities that could indicate strong buying or selling pressure. This method allows traders to see not just the volume spikes, but how those spikes relate to price movements, providing a clearer picture of market sentiment.
### Customization and Inputs
The DPVO is highly customizable, catering to various trading styles and strategies:
- **Oscillator Length (`oscLength`)**: Adjusts the period over which the volume and price difference is analyzed, allowing traders to set it according to their trading timeframe.
- **Fast and Slow Moving Averages (`fastMA` and `slowMA`)**: These parameters control the responsiveness of the DPVO. A shorter `fastMA` coupled with a longer `slowMA` can help in identifying trends quicker or smoothing out market noise for more conservative approaches.
- **Signal Smoothing (`signalSmooth`)**: This input helps in reducing signal noise, making the crossover and crossunder points between the DVO and its smoothed signal line clearer and easier to interpret.
### Functionality Details
The DPVO operates through a sequence of calculated steps that integrate volume data with price movement:
1. **Volume Impact Calculation**: This is the foundational step where the product of the EMA of volume and the EMA of price range (close - open) is calculated. This metric highlights trading sessions where significant volume accompanies substantial price movements, suggesting a strong market response.
2. **Dynamic Volume Oscillator (DVO)**: The heart of the indicator, the DVO, is derived by calculating the difference between the fast EMA and the slow EMA of the Volume Impact. This result is then normalized by dividing by the EMA of the volume over the same period to scale the output, making it consistent across various trading environments.
3. **Signal Generation**: The final output is smoothed using a simple moving average of the DVO to filter out market noise. Buy and sell signals are generated based on the crossover and crossunder of the DVO with its smoothed version, providing clear cues for market entry or exit.
### Originality
The DPVO's originality lies in its innovative integration of volume and price movement, a novel approach not typically observed in other volume indicators. By analyzing the product of volume and price change EMAs, the DPVO captures the essence of market dynamics more holistically than traditional tools, which often only reflect volume levels without contextualizing them with price actions. This dual analysis provides traders with a deeper understanding of market forces, enabling them to make more informed decisions based on a combination of volume surges and significant price movements. The DPVO also introduces a unique normalization and smoothing technique that refines the oscillator's output, offering cleaner and more reliable signals that are adaptable to various market conditions and trading styles.
### Practical Application
The DPVO excels in environments where volume plays a crucial role in validating price movements. Traders can utilize the buy and sell signals generated by the DPVO to enhance their decision-making process. The signals are plotted directly on the trading chart, with buy signals appearing below the price bars and sell signals above, ensuring they are prominent and actionable. This setup is particularly useful for day traders and swing traders who rely on timely and accurate signals to maximize their trading opportunities.
### Best Practices
To maximize the effectiveness of the DPVO, traders should consider the following best practices:
- **Market Selection**: Use the DPVO in markets known for strong volume-price correlation such as major forex pairs, popular stocks, and cryptocurrencies.
- **Signal Confirmation**: While the DPVO provides powerful signals, confirming these signals with additional indicators such as RSI or MACD can increase trade reliability.
- **Risk Management**: Always use stop-loss orders to manage risks associated with trading signals. Adjust the position size based on the volatility of the asset to avoid significant losses.
### Practical Example + How to use it
Practical Example1: Day Trading Cryptocurrencies
For a day trader focusing on the highly volatile cryptocurrency market, the DPVO can be an effective tool on a 15-minute chart. Suppose a trader is monitoring Bitcoin (BTC) during a period of high market activity. The DPVO might show an upward crossover of the DVO above its smoothed signal line while also indicating a significant increase in volume. This could signal that strong buying pressure is entering the market, suggesting a potential short-term rally. The trader could enter a long position based on this signal, setting a stop-loss just below the recent support level to manage risk. If the DPVO later shows a crossover in the opposite direction with decreasing volume, it might signal a good exit point, allowing the trader to lock in profits before a potential pullback.
- **Swing Trading Stocks**: For a swing trader looking at stocks, the DPVO could be applied on a daily chart. If the oscillator shows a consistent downward trend along with increasing volume, this could suggest a potential sell-off, providing a sell signal before a significant downturn.
You can look for:
--> Increase in volume - You can use indicators like 24-hour-Volume to have a better visualization
--> Uptrend/Downtrend in the indicator (HH, HL, LL, LH)
--> Confirmation (Buy signal/Sell signal)
--> Correct Price action (Not too steep moves up or down. Stable moves.) (Optional)
--> Confirmation with other indicators (Optional)
Quick image showing you an example of a buy signal on SOLANA:
### Technical Notes
- **Calculation Efficiency**: The DPVO utilizes exponential moving averages (EMAs) in its calculations, which provides a balance between responsiveness and smoothing. EMAs are favored over simple moving averages in this context because they give more weight to recent data, making the indicator more sensitive to recent market changes.
- **Normalization**: The normalization of the DVO by the EMA of the volume ensures that the oscillator remains consistent across different assets and timeframes. This means the indicator can be used on a wide variety of markets without needing significant adjustments, making it a versatile tool for traders.
- **Signal Line Smoothing**: The final signal line is smoothed using a simple moving average (SMA) to reduce noise. The choice of SMA for smoothing, as opposed to EMA, is intentional to provide a more stable signal that is less prone to frequent whipsaws, which can occur in highly volatile markets.
- **Lag and Sensitivity**: Like all moving average-based indicators, the DPVO may introduce a slight lag in signal generation. However, this is offset by the indicator’s ability to filter out market noise, making it a reliable tool for identifying genuine trends and reversals. Adjusting the `fastMA`, `slowMA`, and `signalSmooth` inputs allows traders to fine-tune the sensitivity of the DPVO to match their specific trading strategy and market conditions.
- **Platform Compatibility**: The DPVO is written in Pine Script™ v5, ensuring compatibility with the latest features and functionalities offered by TradingView. This version takes advantage of optimized functions for performance and accuracy in calculations, making it well-suited for real-time analysis.
Conclusion
The "Uptrick: Dual Moving Average Volume Oscillator" is a revolutionary tool that merges volume analysis with price movement to offer traders a more nuanced understanding of market trends and reversals. Its ability to provide clear, actionable signals based on a unique combination of volume and price changes makes it an invaluable addition to any trader's toolkit. Whether you are managing long-term positions or looking for quick trades, the DPVO provides insights that can help refine any trading strategy, making it a standout choice in the crowded field of technical indicators.
Nothing from this indicator or any other Uptrick Indicators is financial advice. Only you are ultimately responsible for your choices.

Enhanced Overbought/Oversold IndicatorEnhanced Overbought/Oversold Indicator
Description:
The Enhanced Overbought/Oversold Indicator is a custom technical analysis tool designed to identify potential reversal points in the market by highlighting conditions of overbought and oversold levels on any timeframe. This indicator is based on the Relative Strength Index (RSI), a momentum oscillator that measures the speed and change of price movements.
Features:
Overbought & Oversold Levels:
Overbought (RSI > 70): Indicates that the market is potentially overvalued and might be due for a pullback. The candles are highlighted in Red to signal caution.
Oversold (RSI < 30): Indicates that the market is potentially undervalued and might be due for a bounce. The candles are highlighted in Green to signal potential buying opportunities.
Extreme Conditions:
Extreme Overbought (RSI > 85): Indicates an extremely overbought condition, suggesting a very high likelihood of a reversal or correction. The candles are highlighted in Blue.
Extreme Oversold (RSI < 15): Indicates an extremely oversold condition, suggesting a strong potential for a reversal upwards. The candles are highlighted in Yellow.
Dynamic Highlighting:
The indicator dynamically adjusts the candle colors based on the current RSI value, providing a clear visual representation of market conditions.
Applications:
Trend Reversals: By identifying extreme RSI levels, the indicator helps traders anticipate possible trend reversals.
Entry & Exit Points: Traders can use the highlighted signals to make more informed decisions about entering or exiting trades.
Risk Management: The color-coded signals can be used to manage risk, especially during extreme market conditions.
This indicator is particularly useful for traders looking for a straightforward visual representation of market conditions across different timeframes. By combining standard and extreme RSI levels, it helps identify not just overbought and oversold conditions but also extreme levels where significant reversals are more likely.

Price & Volume Breakout Fibonacci Probability [TradeDots]📝 OVERVIEW
The "Price & Volume Breakout Fibonacci Probability" indicator is designed to detect the probability of the maximum run-up and drawdown of each breakout trade on an asset, assisting traders in optimizing their take profit and stop loss strategies.
🧮 CALCULATIONS
The algorithm detects price and volume breakouts to activate the Fibonacci levels displayed on the chart. It calculates these levels using the period pivot high and low, with the close price of the breakout bar as the reference price.
The indicator then forward-tests within an user-selected number of bars, detecting the maximum run-up and drawdown during that period. Consequently, it calculates the probability of the price hitting either side of the Fibonacci levels, showing the likelihood of reaching take profit and stop loss targets for each breakout trade.
📊 EXAMPLE
The above example shows two breakout trades, circled within the yellow rectangle zone.
The first trade has a maximum run-up above the +0.382 Fibonacci level zone and a maximum drawdown below the -0.618 Fibonacci level zone.
When the price reaches the maximum run-up, it only has a ~45% probability of moving further upward into the last two zones (25% + 19.44%). This indicates that setting a take profit at a higher level may have less than a 50% chance of success.
Conversely, when the price reaches its maximum drawdown, there is only an ~8% probability of moving further downward into the last drawdown zone. This could indicate a potential reversal.
⚙️ SETTINGS
Breakout Condition: Determines the type of breakout condition to track: "Price", "Volume", "Price & Volume".
Backtest Period: The maximum run-up and drawdown are detected within this bar period.
Price Breakout Period: Specifies the number of bars the price needs to break out from.
Volume Breakout Period: Specifies the number of bars the volume needs to break out from.
Trendline Confirmation: Confirms that the close price needs to be above the trendline.
📈 HOW TO USE
By understanding the probabilities of price movements to both the upside and downside, traders can set take profit and stop loss targets with greater accuracy.
For instance, placing a stop loss order below the zone with the highest probability minimizes the chances of being stopped out of a profitable trade. Conversely, setting a take profit target at the zone with the highest probability increases the win rate.
Additionally, if the price breaches multiple Fibonacci levels during the breakout period, it may indicate an abnormal state, signaling a potential reversal or pullback. This can help traders exit trades in a timely manner.
Traders can adjust their take profit and stop loss levels based on their individual risk tolerance.
RISK DISCLAIMER
Trading entails substantial risk, and most day traders incur losses. All content, tools, scripts, articles, and education provided by TradeDots serve purely informational and educational purposes. Past performances are not definitive predictors of future results.

Uptrick: Adaptive Cloud Oscillator (ACO)### **Uptrick: Adaptive Cloud Oscillator (ACO)**
---
### Introduction
The **Uptrick: Adaptive Cloud Oscillator (ACO)** is an advanced technical analysis tool designed to empower traders with precise trend detection and visual clarity in dynamic market conditions. By seamlessly integrating adaptive trend analysis, volatility filtering, and cloud-based support and resistance levels, the ACO provides traders with the actionable insights needed to navigate complex markets with confidence.
This indicator is highly customizable, allowing traders to tailor its functionality to their specific trading style and preferences. Whether you're a trend follower, swing trader, or looking to identify key support and resistance zones, the **Uptrick: ACO** is an indispensable tool that can adapt to a variety of market conditions.
### Indicator Purpose and Functionality
#### 1. **Adaptive Trend Detection**
At the heart of the **Uptrick: ACO** lies its adaptive trend detection algorithm. Unlike traditional moving averages that may lag in volatile markets or react too slowly to rapid changes, this adaptive method uses a smoothing technique that dynamically adjusts based on market conditions. By doing so, it provides a more responsive trend line that captures meaningful price movements while filtering out minor fluctuations.
- **How It Works:** The trend line is calculated using an adaptive smoothing factor, making it responsive to recent price actions while maintaining a level of stability that prevents whipsaw signals. This ensures that traders are always in tune with the prevailing market trend, whether bullish, bearish, or neutral.
#### 2. **Dynamic Cloud Support and Resistance**
The **Uptrick: ACO** features a dynamic "cloud" that serves as a key element in its analysis. This cloud is constructed using a moving average combined with the Average True Range (ATR), which adjusts based on the market’s volatility. The cloud provides dynamic support and resistance levels, essential for identifying potential reversal zones or confirming trend continuations.
- **Cloud Displacement:** The cloud is displaced forward by a user-defined number of bars, offering a predictive view of where future support and resistance levels may lie. This forward-looking feature helps traders anticipate potential price movements, making the ACO a powerful tool for planning trades ahead of time.
#### 3. **Versatile Visualization Options**
The **Uptrick: ACO** is designed with flexibility in mind, allowing users to choose between two distinct display modes:
- **Buy/Sell Signals:** In this mode, the indicator generates clear buy and sell signals based on crossovers of the trend line and the cloud boundaries. These signals are visualized directly on the chart with up and down labels, making it easy for traders to identify potential entry and exit points.
- **Cloud Fill Only:** For traders who prefer a cleaner chart, this mode removes the buy/sell signals and instead focuses on coloring the area between the upper and lower cloud boundaries. The color of the cloud fill changes based on the trend direction, providing a visual representation of the market's momentum.
- **Optional EMA Line:** An Exponential Moving Average (EMA) line can be optionally displayed on the chart. The EMA serves as an additional trend filter, helping traders further refine their entries and exits. The length, color, and thickness of the EMA are fully customizable to fit individual trading strategies.
### Practical Applications
#### 1. **Trend Following and Reversals**
The **Uptrick: ACO** excels in identifying and following trends. By analyzing the relationship between the trend line and the cloud, traders can determine the strength and direction of the current market trend. The cloud’s dynamic nature means it can adapt to both trending and ranging markets, providing consistent insights regardless of market conditions.
- **Example:** If the trend line crosses above the upper cloud boundary, it signals a potential buy opportunity. Conversely, a cross below the lower cloud boundary suggests a sell opportunity. Traders can use these signals to enter trades aligned with the prevailing trend.
#### 2. **Support and Resistance Identification**
The forward-displaced cloud acts as a predictive support and resistance zone. Traders can use these zones to set stop-loss levels, determine take-profit targets, or identify potential reversal points.
- **Example:** When the price approaches the upper cloud boundary from below, the boundary may act as resistance, indicating a potential reversal or pullback. If the price breaks through this level, it may signal a continuation of the bullish trend.
#### 3. **Volatility-Based Analysis**
By incorporating ATR into its calculations, the **Uptrick: ACO** provides a built-in mechanism to adapt to varying levels of market volatility. This makes it particularly useful in markets prone to sudden spikes in volatility, such as during major economic announcements or geopolitical events.
- **Example:** In a high-volatility environment, the cloud widens, allowing for greater price fluctuations within the trend. Traders can use this information to adjust their risk management strategies, such as widening stop-loss levels during volatile periods to avoid being stopped out prematurely.
### Customization and Flexibility
The **Uptrick: ACO** is designed to be highly customizable, ensuring it can meet the needs of traders with different strategies and preferences. Key customization options include:
- **Cloud and Trend Settings:** Traders can adjust the length of the cloud, the smoothing factor for the trend line, and the displacement of the cloud to optimize the indicator for their specific market and timeframe.
- **Display Modes:** With a simple dropdown selection, traders can choose whether to display buy/sell signals or focus solely on the cloud fill, providing flexibility in how the indicator is visualized.
- **Color and Style Customization:** The colors for bullish and bearish trends, cloud fill, buy/sell signals, and the EMA line can all be customized, allowing traders to integrate the **Uptrick: ACO** seamlessly into their existing chart setups.
### Conclusion
The **Uptrick: Adaptive Cloud Oscillator (ACO)** is more than just a trend indicator—it's a comprehensive market analysis tool that provides traders with a deep understanding of market dynamics. Its combination of adaptive trend analysis, dynamic support and resistance levels, and versatile visualization options makes it an essential tool for traders looking to gain an edge in any market environment.
Whether you're a seasoned trader or just starting, the **Uptrick: ACO** offers the insights and flexibility needed to make informed trading decisions. By helping you identify trends, anticipate reversals, and adapt to changing market conditions, the **Uptrick: ACO** can significantly enhance your trading strategy and improve your overall trading performance.

Trading Desk - OPEN SOURCEThe Trading Desk - is a powerful tool designed to identify key market stages based on Break of Structure (BOS) patterns. This indicator tracks Bullish and Bearish Market Breaks (MBs) to determine four crucial market stages: Accumulation, Distribution, Reaccumulation, and Redistribution.
Accumulation: Identified when a series of Bullish MBs dominate the market, signaling a potential upward trend.
Distribution: Triggered by dominant Bearish MBs, indicating a possible market decline.
Reaccumulation: Occurs after a sequence of Bullish MBs is followed by up to three Bearish MBs, suggesting a continuation of the upward trend after a temporary pullback.
Redistribution: Appears when a sequence of Bearish MBs is followed by up to three Bullish MBs, indicating a potential continuation of the downward trend after a brief upward correction.
The indicator also includes a dynamic table displayed at the top right of the chart, showing the current market stage in real-time. This helps traders quickly assess the market environment and make informed trading decisions.
Ideal for: Traders looking to understand market structure and identify trend continuation or reversal phases.

Fair Value Gaps Setup 01 [TradingFinder] FVG Absorption + CHoCH🔵 Introduction
🟣 Market Structures
Market structures exhibit a fractal and nested nature, which leads us to classify them into internal (minor) and external (major) categories. Definitions of market structure vary, with different methodologies such as Smart Money and ICT offering distinct interpretations.
To identify market structure, the initial step involves examining key highs and lows. An uptrend is characterized by successive highs and lows that are higher than their predecessors. Conversely, a downtrend is marked by successive lows and highs that are lower than their previous counterparts.
🟣 Market Trends and Movements
Market trends consist of two primary types of movements :
Impulsive Movements : These movements align with the main trend and are characterized by high strength and momentum.
Corrective Movements : These movements counter the main trend and are marked by lower strength and momentum.
🟣 Break of Structure (BOS)
In a downtrend, a Break of Structure (BOS) occurs when the price falls below the previous low and establishes a new low (LL). In an uptrend, a BOS, also known as a Market Structure Break (MSB), happens when the price rises above the last high.
To confirm a trend, at least one BOS is necessary, which requires the price to close at least one candle beyond the previous high or low.
🟣 Change of Character (CHOCH)
Change of Character (CHOCH) is a crucial concept in market structure analysis, indicating a shift in trend. A trend concludes with a CHOCH, also referred to as a Market Structure Shift (MSS).
For example, in a downtrend, the price continues to drop with BOS, showcasing the trend's strength. However, when the price rises and exceeds the last high, a CHOCH occurs, signaling a potential transition from a downtrend to an uptrend.
It is essential to note that a CHOCH does not immediately indicate a buy trade. Instead, it is prudent to wait for a BOS in the upward direction to confirm the uptrend. Unlike BOS, a CHOCH confirmation does not require a candle to close; merely breaking the previous high or low with the candle's wick is sufficient.
🟣 Spike | Inefficiency | Imbalance
All these terms mean fast price movement in the shortest possible time.
🟣 Fair Value Gap (FVG)
To pinpoint the "Fair Value Gap" (FVG) on a chart, a detailed candle-by-candle analysis is necessary. This process involves focusing on candles with substantial bodies and evaluating them in relation to the candles immediately before and after them.
Here are the steps :
Identify the Central Candle : Look for a candle with a large body.
Examine Adjacent Candles : The candles before and after this central candle should have long shadows, and their bodies must not overlap with the body of the central candle.
Determine the FVG Range : The distance between the shadows of the first and third candles defines the FVG range.
This method helps in accurately identifying the Fair Value Gap, which is crucial for understanding market inefficiencies and potential price movements.
🟣 Setup
This setup is based on Market Structure and FVG. After a change of character and the formation of FVG in the last lag of the price movement, we are looking for trading positions in the price pullback.
Bullish Setup :
Bearish Setup :
🔵 How to Use
After forming the setup, you can enter the trade using a pending order or after receiving confirmation. To increase the probability of success, you can adjust the pivot period market structure settings or modify the market movement coefficient in the formation leg of the FVG.
Bullish Setup :
Bearish Setup :
🔵 Setting
Pivot Period of Market Structure Detector :
This parameter allows you to configure the zigzag period based on pivots. Adjusting this helps in accurately detecting order blocks.
Show major Bullish ChoCh Lines :
You can toggle the visibility of the Demand Main Zone and "ChoCh" Origin, and customize their color as needed.
Show major Bearish ChoCh Lines :
Similar to the Demand Main Zone, you can control the visibility and color of the Supply Main Zone and "ChoCh" Origin.
FVG Detector Multiplier Factor :
This feature lets you adjust the size of the moves forming the Fair Value Gaps (FVGs) using the Average True Range (ATR). The default value is 1, suitable for identifying most setups. Adjust this value based on the specific symbol and market for optimal results.
FVG Validity Period :
This parameter defines the validity period of an FVG in terms of the number of candles. By default, an FVG remains valid for up to 15 candles, but you can adjust this period as needed.
Mitigation Level FVG :
This setting establishes the basic level of an FVG. When the price reaches this level, the FVG is considered mitigated.
Level in Low-Risk Zone :
This feature aims to reduce risk by dividing the FVG into two equal areas: "Premium" (upper area) and "Discount" (lower area). For lower risk, ensure that "Demand FVG" is in the "Discount" area and "Supply FVG" in the "Premium" area. This feature is off by default.
Show or Hide :
Given the potential abundance of setups, displaying all on the chart can be overwhelming. By default, only the last setup is shown, but you can enable the option to view all setups.
Alert Settings :
On / Off : Toggle alerts on or off.
Message Frequency : Determine how often alerts are triggered.
Options include :
"All" (alerts every time the function is called)
"Once Per Bar" (alerts only on the first call within the bar)
"Once Per Bar Close" (alerts only at the last script execution of the real-time bar upon closing)
The default setting is "Once Per Bar".
Show Alert Time by Time Zone : Set the alert time based on your preferred time zone, such as "UTC-4" for New York time. The default is "UTC".
Display More Info : Optionally show additional details like the price range of the order blocks and the date, hour, and minute in the alert message. Set this to "Off" if you prefer not to receive this information.

KillZones Hunt + Sessions [TradingFinder] Alert & Volume Ranges🟣 Introduction
🔵 Session
Financial markets are divided into various time segments, each with its own characteristics and activity levels. These segments are called sessions, and they are active at different times of the day.
The most important active sessions in financial markets are :
1. Asian Session
2. European Session
3. New York Session
The timing of these major sessions based on the UTC time zone is as follows :
1. Asian Session: 23:00 to 06:00
2. European Session: 07:00 to 16:30
3. New York Session: 13:00 to 22:00
Note
To avoid overlap between sessions and interference in kill zones, we have adjusted the session timings as follows :
• Asian Session: 23:00 to 06:00
• European Session: 07:00 to 14:25
• New York Session: 14:30 to 22:55
🔵 Kill Zones
Kill zones are parts of a session where trader activity is higher than usual. During these periods, trading volume increases and price fluctuations are more intense.
The timing of the major kill zones based on the UTC time zone is as follows :
• Asian Kill Zone: 23:00 to 03:55
• European Kill Zone: 07:00 to 09:55
• New York Morning Kill Zone: 14:30 to 16:55
• New York Evening Kill Zone: 19:30 to 20:55
This indicator focuses on tracking the kill zone and its range. For example, once a kill zone ends, the high and low formed during it remain unchanged.
If the price reaches the high or low of the kill zone while the session is still active, the corresponding line is not drawn any further. Based on this information, various strategies can be developed, and the most important ones are discussed below.
🟣 How to Use
There are three main ways to trade based on the kill zone :
• Kill Zone Hunt
• Breakout and Pullback to Kill Zone
• Trading in the Trend of the Kill Zone
🔵 Kill Zone Hunt
According to this strategy, once the kill zone ends and its high and low lines no longer change, if the price reaches one of these lines within the same session and is strongly rejected, a trade can be entered.
🔵 Breakout and Pullback to Kill Zone
According to this strategy, once the kill zone ends and its high and low lines no longer change, if the price breaks one of these lines strongly within the same session, a trade can be entered on the pullback to that level.
Trading in the Trend of the Kill Zone
We know that kill zones are areas where high-volume trading occurs and powerful trends form. Therefore, trades can be made in the direction of the trend. For example, when an upward trend dominates this area, you can enter a buy trade when the price reaches a demand order block.
🟣 Features
🔵 Alerts
You can set alerts to be notified when the price hits the high or low lines of the kill zone.
🔵 More Information
By enabling this feature, you can view information such as the time and trading volume within the kill zone. This allows you to compare the trading volume with the same period on the previous day or other kill zones.
🟣 Settings
Through the settings, you have access to the following options :
• Show or hide additional information
• Enable or disable alerts
• Show or hide sessions
• Show or hide kill zones
• Set preferred colors for displaying sessions
• Customize the time range of sessions
• Customize the time range of kill zones

Order-Block Detector ICT/SMT + FVG + SignalsOrderBlock-Finder
This script shows order-blocks (OB) and fair-value-gaps (FVG). Additionaly there are entry signals for OB and FVG. The Dist-Parameter tell how many candles should exist between the beginning of the OB or FVG and the pullback.
Order-Blocks
An order block in trading typically refers to a significant grouping of buy or sell orders at a particular price level within a financial market. These blocks of orders can influence price movement when they are executed. Here's a breakdown:
Buy Order Block: This occurs when there's a large concentration of buy orders at a specific price level. It indicates a significant interest among traders to purchase the asset if the price reaches that level.
Sell Order Block: Conversely, a sell order block happens when there's a notable accumulation of sell orders at a particular price level. This suggests that many traders are willing to sell the asset if the price reaches that level.
Impact on Price: Order blocks can influence price movement because when the market approaches these levels, the orders within the block may be triggered, leading to increased buying or selling pressure, depending on the type of block. This surge in trading activity can cause the price to either bounce off the level or break through it.
Support and Resistance: Order blocks are often associated with support and resistance levels. A buy order block may act as support, preventing the price from falling further, while a sell order block may serve as resistance, hindering upward price movement.
Fair-Value-Gap
The fair value gap in trading refers to the difference between the current market price of an asset and its calculated fair value. This concept is often used in financial markets, especially in the context of stocks and other securities. Here's a breakdown:
Market Price: The market price is the price at which an asset is currently trading in the market. It is determined by the interaction of supply and demand forces, as well as various other factors such as news, sentiment, and economic conditions.
Fair Value: Fair value represents the estimated intrinsic value of an asset based on fundamental analysis, which includes factors such as earnings, dividends, cash flow, growth prospects, and prevailing interest rates. It's essentially what an asset should be worth based on its fundamentals.
Fair Value Calculation: Analysts and investors use various methods to calculate the fair value of an asset. Common approaches include discounted cash flow (DCF) analysis, comparable company analysis (CCA), and dividend discount models (DDM), among others.
Fair Value Gap: The fair value gap is the numerical difference between the calculated fair value of an asset and its current market price. If the market price is higher than the fair value, it suggests that the asset may be overvalued. Conversely, if the market price is lower than the fair value, it indicates that the asset may be undervalued.
Trading Implications: Traders and investors often pay attention to the fair value gap to identify potential trading opportunities. If the market price deviates significantly from the fair value, it may present opportunities to buy or sell the asset with the expectation that the market price will eventually converge towards its fair value.

Fibonacci Enhanced Bollinger BandsDiscover the synergistic power of Fibonacci ratios with traditional Bollinger Bands in the 'Fibonacci Enhanced Bollinger Bands' indicator. Ideal for traders seeking dynamic price levels for strategic entries and exits, this tool adds a unique Fibonacci twist to your technical analysis toolkit.
Introduction to Fibonacci Enhanced Bollinger Bands
'Fibonacci Enhanced Bollinger Bands' is a trading indicator that combines the classic Bollinger Bands approach with the powerful insights of Fibonacci ratios. By integrating these two concepts, this indicator offers traders a unique perspective on market volatility and potential support/resistance levels.
How It Works
Core Concept : The indicator calculates Bollinger Bands using a selected Fibonacci ratio. This ratio is applied to the standard deviation of the price series, providing a dynamic range around a Simple Moving Average (SMA).
Trading Strategies
Long Opportunities : The area below the lower band can be considered a potential zone for long positions. Prices in this zone may indicate an oversold market condition, suggesting a possible reversal or pullback.
Short Opportunities : Conversely, the area above the upper band might signal short-selling opportunities. Prices in this region could imply an overbought scenario, potentially leading to a price decline.
Versatility : Whether you're a day trader, swing trader, or long-term investor, this indicator adapts to various timeframes and assets, making it a versatile tool in your trading arsenal.
Conclusion
The 'Fibonacci Enhanced Bollinger Bands' indicator is designed for traders who wish to leverage the power of Fibonacci ratios in conjunction with the volatility insights provided by Bollinger Bands. It's an excellent tool for identifying potential reversal zones and refining entry and exit points. Try it out to enhance your market analysis and support your trading decisions with the combined wisdom of Fibonacci and Bollinger Bands.

RVI_HTFThe "RVI_HTF" indicator is a tool designed to assist traders in analyzing market trends using the Relative Vigor Index (RVI) across different timeframes. It enables users to customize various aspects of the indicator's appearance and behavior. By monitoring the RVI on different timeframes, tracking its relationship with the moving average, and paying attention to extreme arrows above the 80 or below the 20 line, traders can anticipate potential reversals, trends, or changes in market momentum.
Above 80 Line: When the RVI moves above the 80 line, it suggests that the market may be overbought. Extreme upward arrows (indicating potential sell signals) can be a sign that a bullish trend might be reaching an exhaustion point. Traders may anticipate a possible trend reversal or pullback.
Below 20 Line: When the RVI dips below the 20 line, it implies that the market might be oversold. Extreme downward arrows (indicating potential buy signals) can be an early signal of a potential bullish reversal. Traders may anticipate an upcoming uptrend or bounce.
Crossing Above Moving Average: When the RVI crosses above its moving average on the selected timeframe, it can serve as an early indication of potential bullish strength in the market. This suggests that buying pressure may be increasing.
Crossing Below Moving Average: Conversely, when the RVI crosses below its moving average, it can signal potential bearish momentum. This indicates that selling pressure may be gaining strength.
Variables:
Timeframe (TF) Selection:
The indicator allows you to select the timeframe for the RVI calculation. You can choose from various options such as 1 minute (1), 5 minutes (5), 15 minutes (15), 30 minutes (30), 60 minutes (60), 240 minutes (240), Daily (D), Weekly (W), Monthly (M), or use "Auto" to automatically select a higher timeframe based on your current chart's timeframe.
Moving Average Type (MA_Type):
Function: Allows users to select the type of moving average used in RVI calculations.
Options: You can select from various moving average types, including:
SMA (Simple Moving Average)
EMA (Exponential Moving Average)
SMMA (Smoothed Moving Average, also known as RMA)
WMA (Weighted Moving Average)
VWMA (Volume Weighted Moving Average)
DEMA (Double Exponential Moving Average)
Moving Average Length (MA_Length):
Function: Permits users to set the number of periods for the selected moving average type.
Purpose: Controls the sensitivity of the RVI indicator. Longer lengths provide smoother results, while shorter lengths react more quickly to price changes.
Up Arrow Color (upArrowColor):
Function: Enables users to customize the color of arrows that indicate potential Overbought areas. (Only shown when the TF is same as or lower than the chart TF)
Down Arrow Color (downArrowColor):
Function: Allows users to specify the color of downward-pointing arrows signaling potential Oversold areas. (Only shown when the TF is same as or lower than the chart TF)
RVI Up Color (firstColor):
Function: Defines the color of the RVI line when it indicates a bullish condition on the higher timeframe.
RVI Down Color (secondColor):
Function: Specifies the color of the RVI line when it suggests a bearish condition on the higher timeframe.
RVI-Based Moving Average Up Color (firstColorMA):
Function: Customizes the color of the RVI-based moving average line when it indicates a bullish condition.
RVI-Based Moving Average Down Color (secondColorMA):
Function: Defines the color of the RVI-based moving average line when it suggests a bearish condition.

RSI Trend Detector PSAR BasedRSI Trend Detector is based on the Direction of PSAR. This indicator helps the easy detection of Trend Direction and Sideways Movement of Price. It was difficult to determine the RSI Trend Direction in a basic RSI indicator. one cannot decide the exact entry point where to enter.
RSI Trend Detector helps with the direction of trend using PSAR direction which is almost instant direction changing indicator with Zero Lag. The color of the RSI changes immediately based on PSAR direction. One can determine the trend whether its in UP / Down or Sideways.
One can easily detect Pullback and entry points using this indicator.
The basic working can be interpreted with a normal default RSI, The only additional feature is the direction of trend using a SAR signal.
Oversold Zone is below 30
Overbought Zone is above 70
how ever RSI above 50 is treated a UP trend and Below 50 as Down Trend.
when RSI is between 40 and 60 price must be considered as Sideways. One can easily interpret the TREND.
Yellow Line = RSI Moving Average
RED and Green Line= RSI
Grey Zone = Sideways
Horizontal line = RSI level 50
Settings can be changed as required.
RSI Line:
RSI Above 50 up trend and Entry when color is green
RSI Below 50 down trend and Entry when color is Red
RSI in Grey Zone is sideways, wait for a breakout
RSI above 50 and color is red then its a pullback in uptrend
RSI below 50 and color is green then its a pullback in downtrend
ALERTS:
Up signal and Down Signal are provided when ever RSI crosses RSIMA
Up Signal: RSI crosses RSI Moving Average upwards
Down Signal: RSI crosses RSI Moving Average Downwards
Hope the Tradingview community likes this.
