Combo Backtest 123 Reversal & Breakout Range Long This is combo strategies for get a cumulative signal.
First strategy
This System was created from the Book "How I Tripled My Money In The
Futures Market" by Ulf Jensen, Page 183. This is reverse type of strategies.
The strategy buys at market, if close price is higher than the previous close
during 2 days and the meaning of 9-days Stochastic Slow Oscillator is lower than 50.
The strategy sells at market, if close price is lower than the previous close price
during 2 days and the meaning of 9-days Stochastic Fast Oscillator is higher than 50.
Second strategy
Breakout Range Long Strategy
WARNING:
- For purpose educate only
- This script to change bars colors.
Cari dalam skrip untuk "range"

Combo Strategy 123 Reversal & Breakout Range Long This is combo strategies for get a cumulative signal.
First strategy
This System was created from the Book "How I Tripled My Money In The
Futures Market" by Ulf Jensen, Page 183. This is reverse type of strategies.
The strategy buys at market, if close price is higher than the previous close
during 2 days and the meaning of 9-days Stochastic Slow Oscillator is lower than 50.
The strategy sells at market, if close price is lower than the previous close price
during 2 days and the meaning of 9-days Stochastic Fast Oscillator is higher than 50.
Second strategy
Breakout Range Long Strategy
WARNING:
- For purpose educate only
- This script to change bars colors.


Interquartile Range BandsInterquartile Range Bands script.
This indicator was originally developed by Alex Orekhov at his home.
The idea based on the interquartile range en.wikipedia.org
If price breaks out from the bands then it is `outlier` price.
After breakouts price always returns to its median.
Watch squeeze/expansion periods.
Anyway use it as a supplement to the other indicators.
I will glad to get your feedback.

Volume Weighted Average Range Bands [DW]This is an experimental study designed to identify the underlying trend bias and volatility of an instrument over any custom interval TradingView supports.
First, reset points are established at points where the opening price of the interval changes.
Next, Volume Weighted Average Price (VWAP) is calculated. It is the cumulative sum of typical price times volume divided by the cumulative volume. The cumulation starts over upon each reset point.
After that, Volume Weighted Average Range (VWAR) is calculated. The formula structure is the same as VWAP, except using range rather than typical price.
Lastly, the bands are calculated by multiplying the VWAR by the specified multiplier (approximate Golden Ratio by default) and by 1 through 5, then adding to and subtracting from the VWAP.
Custom Bar Colors are included.

Average Daily Range - without open barBasic ADR-indicator that is showing the daily range on lower timeframes as well, without using the current open daily bar for calculation.
Also plots as line in a separate indicator window. Updates displayed value when hovering over the candles on the chart to see historical Numbers.

MTF Previous Open/Close/RangeThis indicator will simply plot on your chart the Daily/Weekly/Monthly previous candle levels.
The "Auto" mode will allow automatic adjustment of timeframe displayed according to your chart.
Otherwise you can select manually.
Indicator plots the open/close and colors the high-low range area in the background.
Hope this simple indicator will help you !
You can check my indicators via my TradingView's Profile : @PRO_Indicators


Up/Down Range MomentumThe Up/Down Range breaks the price range into an upward and a downward moving component, so we can easily turn it into a momentum oscillator. This script does just that.
You can find the Up/Down Range (UDR) indicator here:
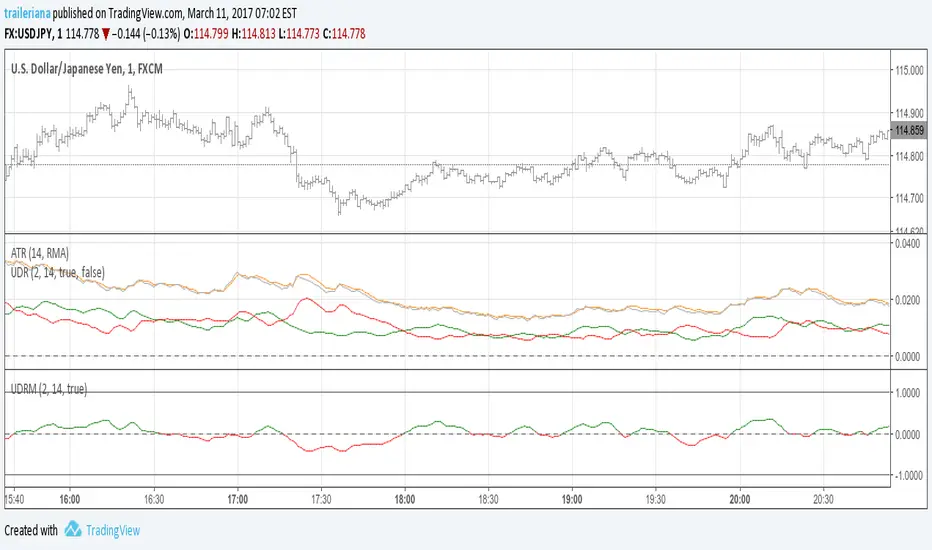
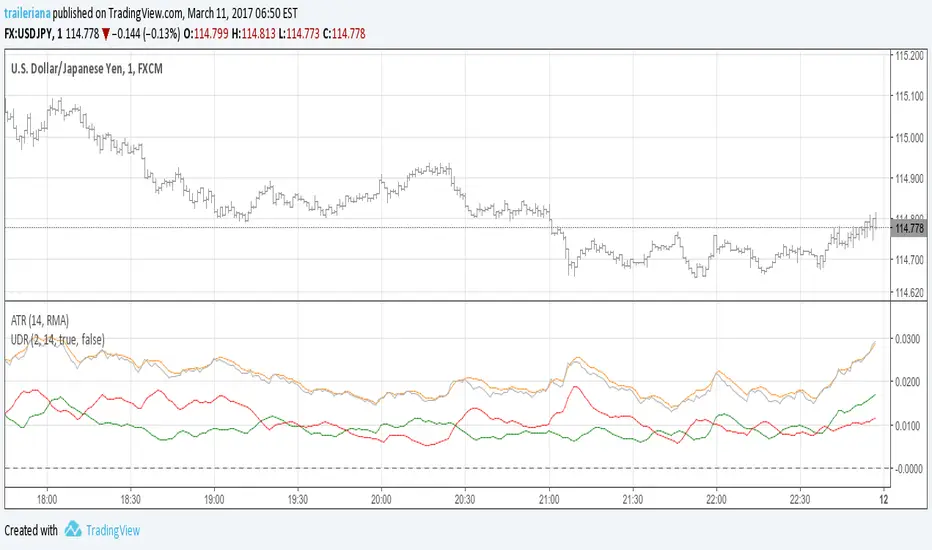
Up/Down RangeMeasuring the difference between the highs and lows from the average, this measure can serve as a proxy for the volatility, just like the ATR.
However, it breaks the range into an upward and a downward moving component, so it also gives information about the current trend direction.
In fact, I turned it into a momentum indicator here:
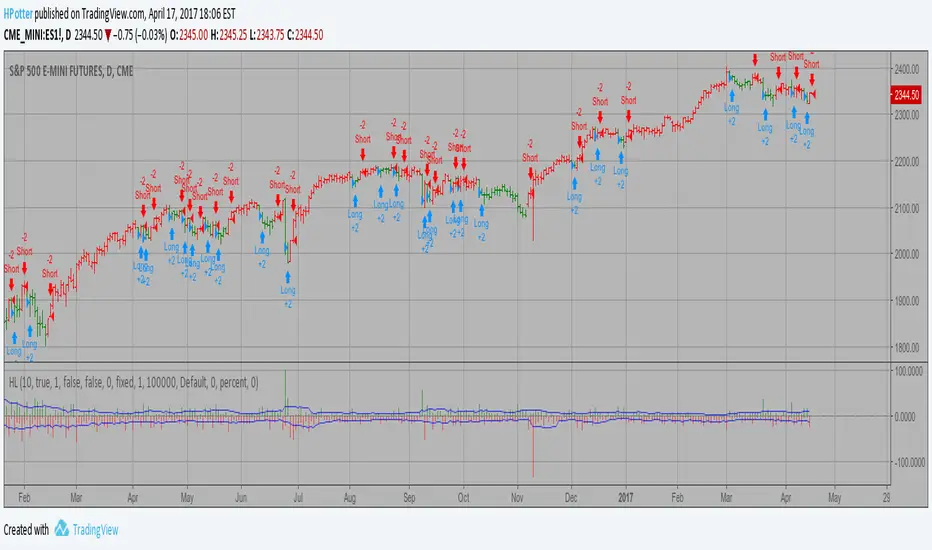
Narrow Range + Inside Day, Long Only Strategy (by ChartArt)This long only strategy determines when there is both a NR7 (narrow range 7, a trading day in which the range is narrower than any of the previous six days), plus a inside day (high of the current day is lower than the high of the previous day and the low of the current day is higher than the low of the previous day) both on the same trading day and enters a long trade when the close is larger than the open and the slope of the simple moving average is upwards, too.
The strategy closes the long trade next time the daily close is larger than the open in any of the next trading days. In addition the NR7ID can be colored (the color is green when the close is larger that day than the open, else the color is red) and the SMA can be drawn with a color based on the direction of the SMA slope. To fine-tune the strategy it is highly recommended to change the period length of the SMA, which determines if the measured SMA slope is upwards or not.
Inspiration:
How to trade NR7 and Inside Day Pattern
paststat.com
Code credit:
NR7 indicator script from Tradingview user Lazybear:
pastebin.com


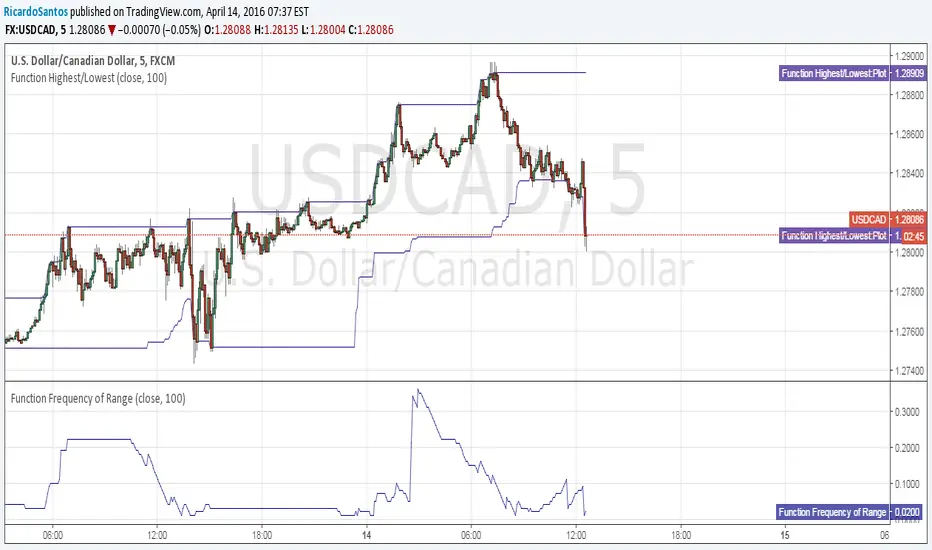
Function Frequency of RangeFunction to derive the frequency a range is visited over time.
returns value (0 to 1) percent multiplier
[RS]Multiple Time Frame Range Swing V0EXPERIMENTAL:
(republishing, previous had alot of lines crowding the chart)
MTF Range Swing.


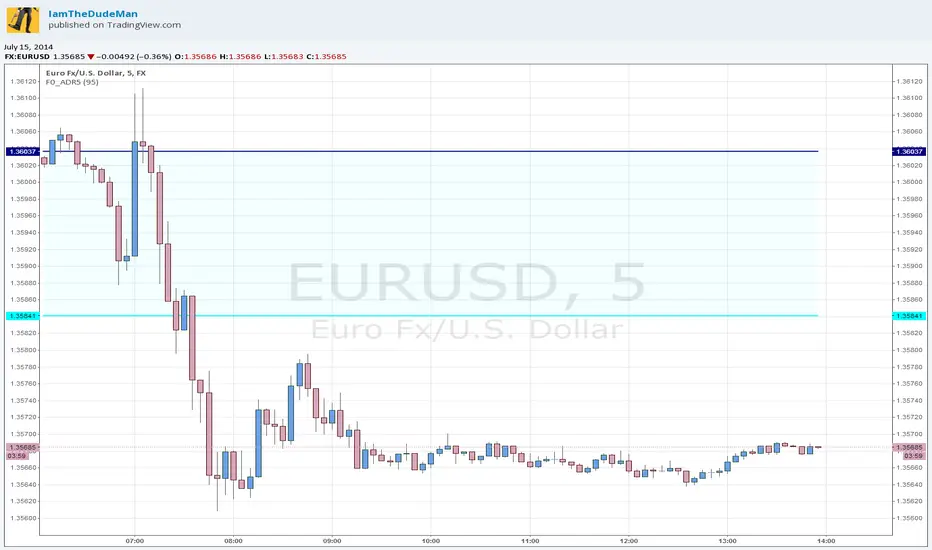
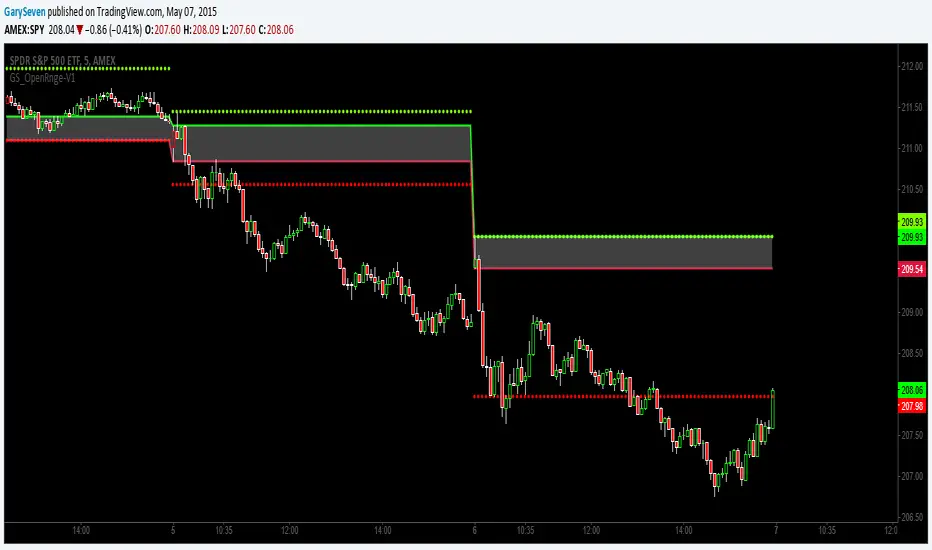
GS_Opening-Range-V1ORB Opening Range Breakout 5 and 3O Minute Indicator
Kudos to Chris Moody for the inspiration to create my first indicator.
The 5 and 30 run together at times but the scalp would be when the equity breaks the 5 go long or short for the scalp and when it breaks the 30 go for the swing trade.
[RS][ALPHA]Predictive Range Analysis V0this code is untested use at your own risk...
applying timed price change over the square to predict price expansion or contraction of the range, it is not predicting the future price only the range that is possible for the price to be in within a margin of error of possibility, with that said i think its very unlikely for price to fall outside the range, due to virtual constraint applied by the auto corrective/cyclical nature of price action.

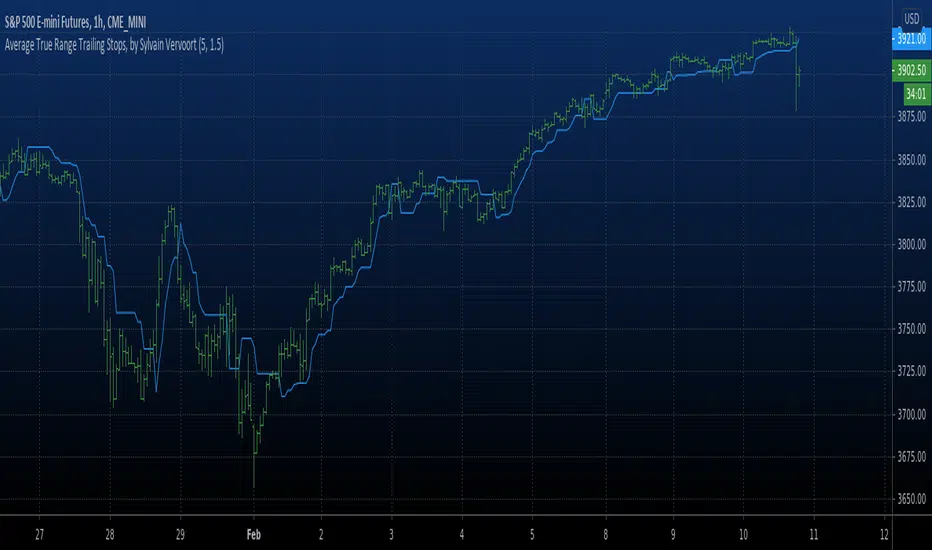
Average True Range Trailing Stops ColoredAverage True Range Trailing Stops Strategy, by Sylvain Vervoort
The related article is copyrighted material from Stocks & Commodities Jun 2009
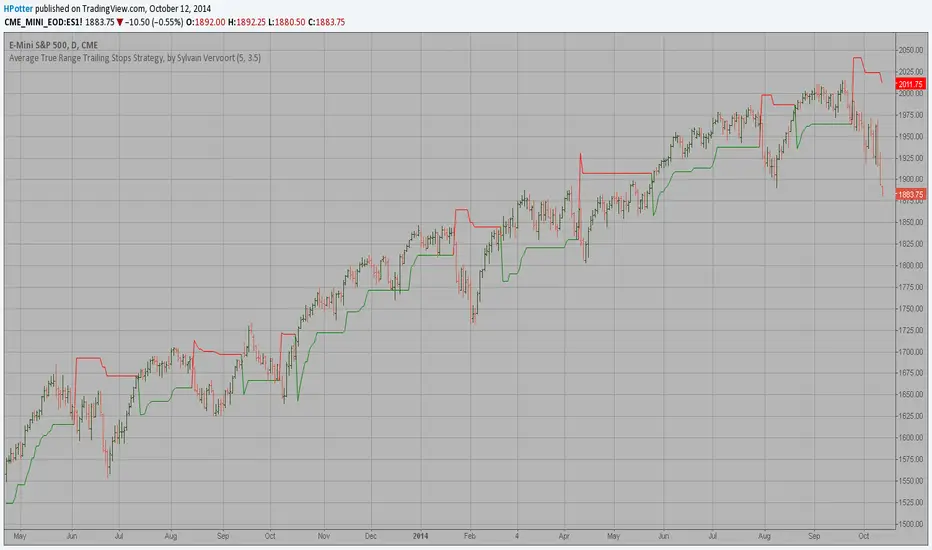
Average True Range Trailing Stops, by Sylvain Vervoort Average True Range Trailing Stops, by Sylvain Vervoort
The related article is copyrighted material from Stocks & Commodities Jun 2009


5 Day Average Daily RangeSimple 5 day average range, adjust to true price movement rather than fixed levels.
-Enjoy