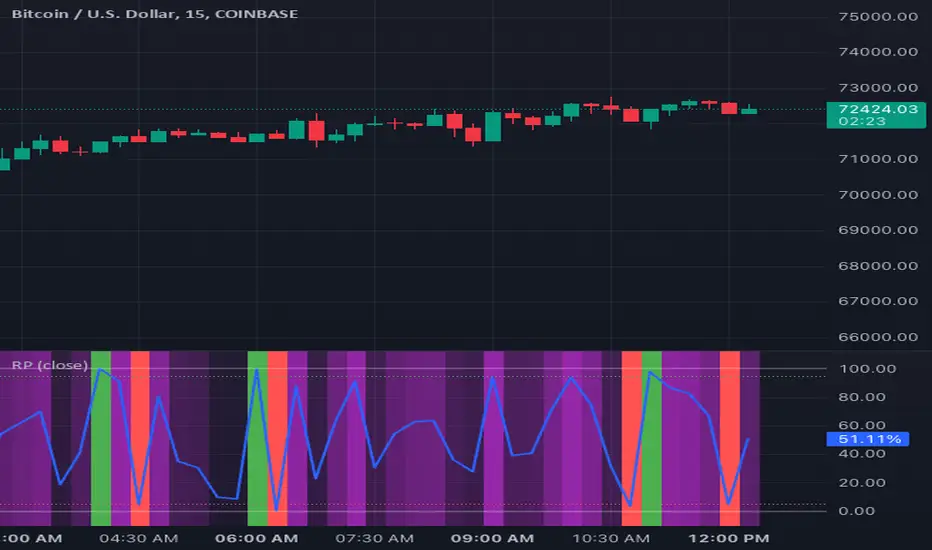
Range PercentageRange Percentage is a simple indicator utility to clearly display and dynamically alert on where a chosen series falls between two bounds, either series themselves or constant values.
To set up, select between series or value for upper and lower bounds. Only the chosen options will be used by the indicator, though you may enter the non-selected option. Configure the thresholds if you wish to use them for visual display or alerting. If you only care about the background color, disable both thresholds and the percentage line and move the indicator into the main pane.
Some sample use cases:
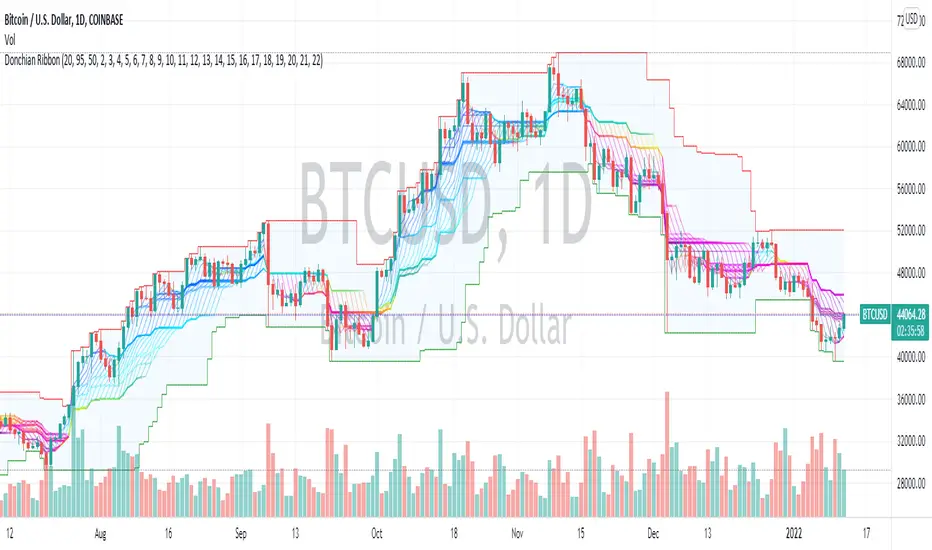
Coloring background on a zoomed-in chart to show to show price change relative to the entire value of an asset, not just the range selected on the y-axis
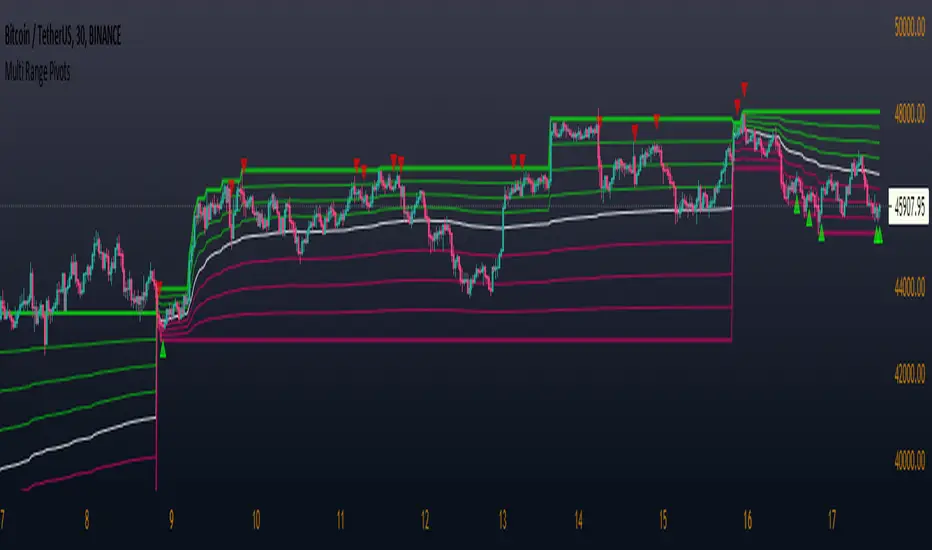
Get alerts which adjust dynamically as price approaches another series or dynamic value
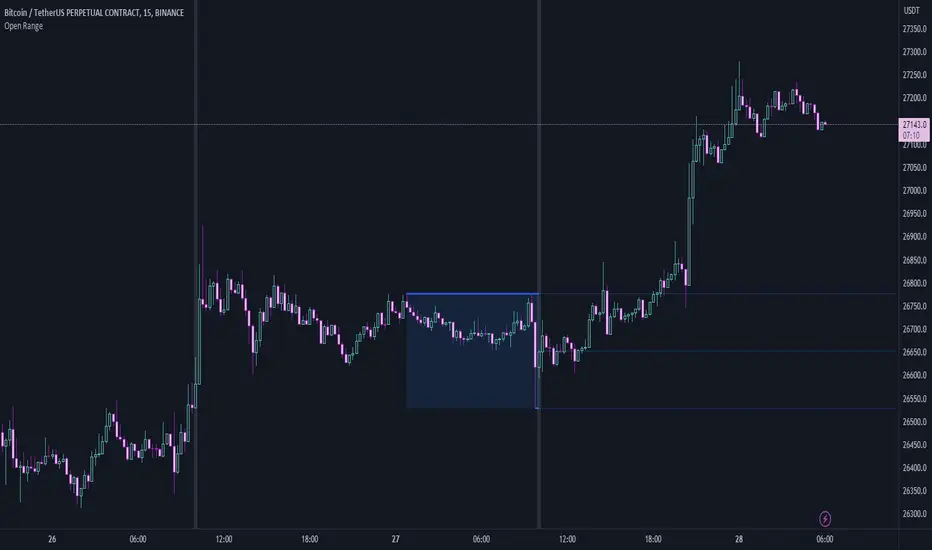
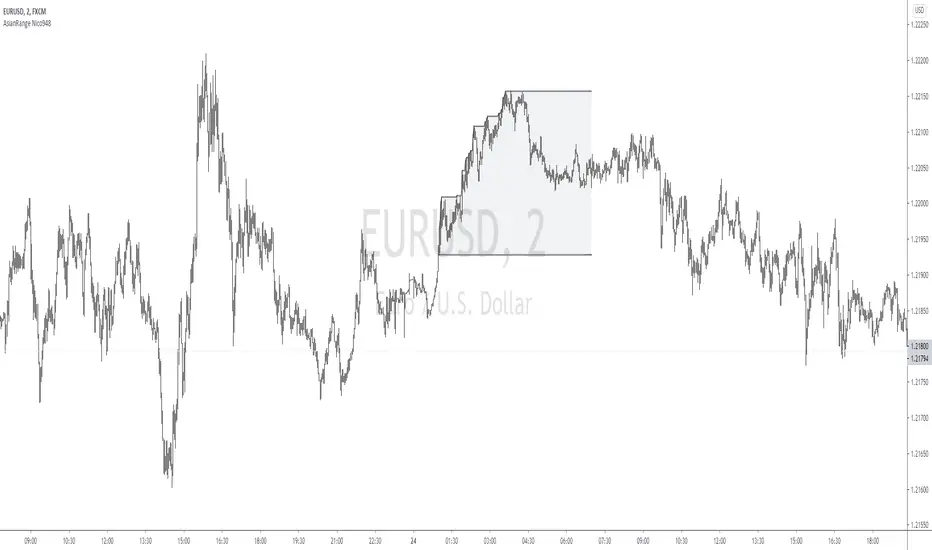
Determine at a glance where a price falls between your identified support/resistance lines, no matter where you zoom or scroll
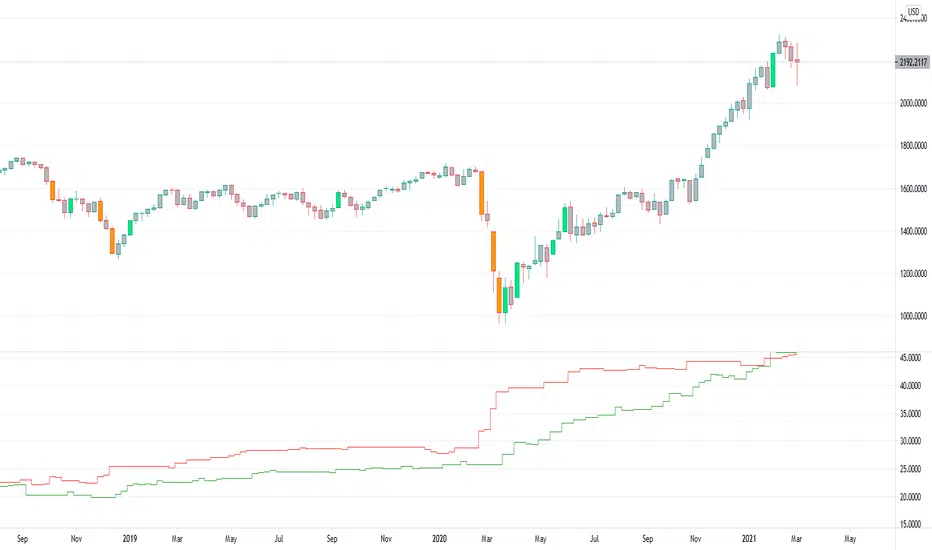
Compare relative gain of two assets
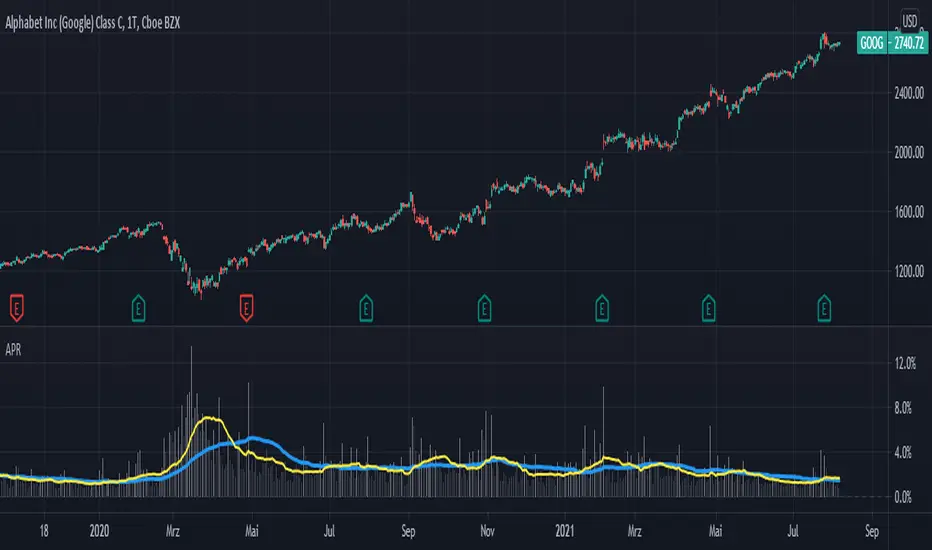
Identify trends of a price closing closer to low or high over time
This indicator is often most useful in conjunction with other indicators which produce a plotted series output and can save a lot of time thinking or interpreting. Its usefulness to a trader depends entirely on the rationale for choosing a lower/upper bound and sample series that are meaningful to that trader.
Penunjuk Pine Script®