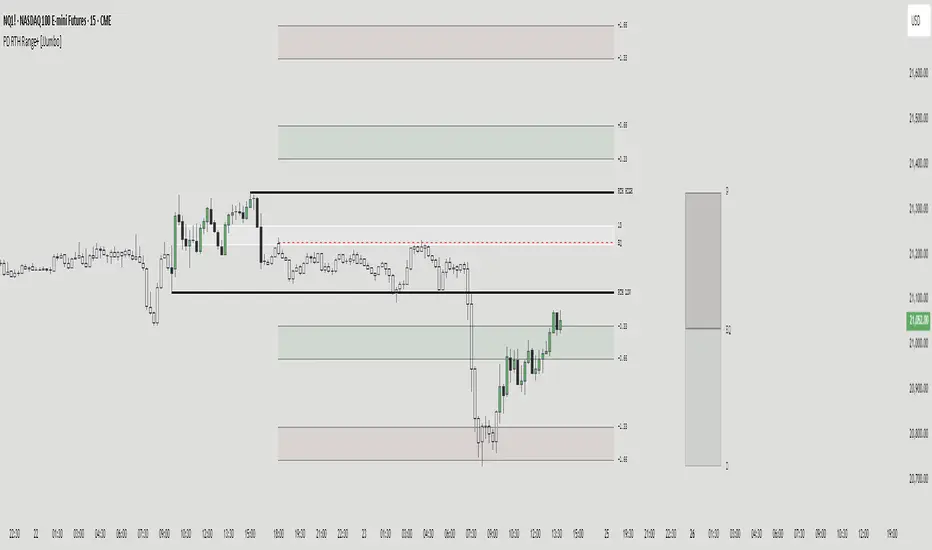
High and Low in a Given Date/Time RangeThis Pine Script v5 indicator plots horizontal lines at both the highest and lowest price levels reached within a user-defined date/time range.
Description:
Inputs:
The user specifies a start and an end date/time by providing the year, month, day, hour, and minute for each. These inputs are converted into timestamps based on the chart’s timezone.
How It Works:
Timestamp Conversion: The script converts the provided start and end dates/times into timestamps using the chart’s timezone.
Bar Check: It examines every bar and checks if the bar’s timestamp falls between the start and end timestamps.
Price Updates:
If a bar’s time is within the specified range, the indicator updates the highest price if the current bar's high exceeds the previously recorded high, and it updates the lowest price if the current bar's low is lower than the previously recorded low.
Drawing Lines:
A red horizontal line is drawn at the highest price, and a green horizontal line is drawn at the lowest price. Both lines start from the first bar in the range and extend dynamically to the current bar, updating as new high or low values are reached.
End of Range: Once a bar's time exceeds the end timestamp, the lines stop updating.
This tool offers a clear and straightforward way to monitor key price levels during a defined period without any extra fluff.
Cari dalam skrip untuk "range"
Relative Strength Index With Range ZoneRSI (Relative Strength Index) with 45-55 Range Zone
1. Introduction and Historical Background
The Relative Strength Index (RSI) is a momentum indicator developed in 1978 by J. Welles Wilder Jr. It measures the speed and magnitude of price changes to assess overbought and oversold conditions of an asset. This widely used oscillator ranges between 0 and 100.
Historically, the RSI was mainly used to detect trend reversals by identifying extreme levels: above 70 (overbought) and below 30 (oversold). However, its application has evolved, and new approaches refine its interpretation, such as adding a 45-55 neutral zone to identify consolidation (range) periods.
2. RSI Calculation
The RSI is calculated using the following formula:
RSI=100−(1001+RS)RSI=100−(1+RS100)
Where:
RS=Average gain over N periodsAverage loss over N periodsRS=Average loss over N periodsAverage gain over N periods
• RS (Relative Strength) is the ratio between the average gains and the average losses over N periods (typically 14 periods).
• Gains and losses are calculated based on daily price variations.
Example calculation with a 14-day period:
1. Compute daily gains and losses.
2. Take an exponential or simple moving average of these values over 14 days.
3. Apply the formula to get the RSI value.
3. Classic RSI Usage
The RSI is typically interpreted as follows:
• RSI > 70: Overbought → Possible correction or bearish reversal.
• RSI < 30: Oversold → Possible rebound or bullish reversal.
• RSI between 50 and 70: Bullish momentum.
• RSI between 30 and 50: Bearish momentum.
4. Adding the 45-55 Zone to Identify Range Phases
Adding a neutral zone between 45 and 55 helps identify consolidation periods, when price moves sideways without a strong trend.
• RSI between 45 and 55: The market is in a range, meaning neither buyers nor sellers dominate.
• RSI breaking out of this zone:
o Above 55: Indicates the start of a bullish trend.
o Below 45: Indicates the start of a bearish trend.
This zone is particularly useful for:
• Avoiding false signals by waiting for trend confirmation.
• Identifying ranging markets, favoring range trading strategies (buying at support, selling at resistance).
• Filtering trend-based entries, waiting for the RSI to exit the 45-55 zone.
5. Trading Strategies Using RSI with the 45-55 Range Zone
1. Range Trading:
• When the RSI oscillates between 45 and 55, it signals a lack of strong trend.
• Strategy:
o Identify a support and resistance level.
o Buy near support when the RSI touches 45.
o Sell near resistance when the RSI touches 55.
2. Breakout Trading:
• If the RSI exits the 45-55 zone:
o Above 55 → Buy (start of a bullish trend).
o Below 45 → Sell (start of a bearish trend).
• This breakout can be used as a confirmed entry signal.
3. Confirmation with Divergences:
• A bullish divergence (price making lower lows while RSI makes higher lows) is more relevant if the RSI moves above 55.
• A bearish divergence (price making higher highs while RSI makes lower highs) is stronger if the RSI drops below 45.
6. Conclusion
The RSI is a powerful tool for analyzing price momentum. Adding a 45-55 zone enhances its usage by clearly distinguishing:
• Consolidation phases (range markets).
• Trend beginnings when RSI breaks out of this range.
This approach improves RSI reliability by filtering out false signals and allowing traders to adapt their strategy based on market conditions.
Average Price Range Screener [KFB Quant]Average Price Range Screener
Overview:
The Average Price Range Screener is a technical analysis tool designed to provide insights into the average price volatility across multiple symbols over user-defined time periods. The indicator compares price ranges from different assets and displays them in a visual table and chart for easy reference. This can be especially helpful for traders looking to identify symbols with high or low volatility across various time frames.
Key Features:
Multiple Symbols Supported:
The script allows for analysis of up to 10 symbols, such as major cryptocurrencies and market indices. Symbols can be selected by the user and configured for tracking price volatility.
Dynamic Range Calculation:
The script calculates the average price range of each symbol over three distinct time periods (default are 30, 60, and 90 bars). The price range for each symbol is calculated as a percentage of the bar's high-to-low difference relative to its low value.
Range Visualization:
The results are visually represented using:
- A color-coded table showing the calculated average ranges of each symbol and the current chart symbol.
- A line plot that visually tracks the volatility for each symbol on the chart, with color gradients representing the range intensity from low (red/orange) to high (blue/green).
Customizable Inputs:
- Length Inputs: Users can define the time lengths (default are 30, 60, and 90 bars) for calculating average price ranges for each symbol.
- Symbol Inputs: 10 symbols can be tracked at once, with default values set to popular crypto pairs and indices.
- Color Inputs: Users can customize the color scheme for the range values displayed in the table and chart.
Real-Time Ranking:
The indicator ranks symbols by their average price range, providing a clear view of which assets are exhibiting higher volatility at any given time.
Each symbol's range value is color-coded based on its relative volatility within the selected symbols (using a gradient from low to high range).
Data Table:
The table shows the average range values for each symbol in real-time, allowing users to compare volatility across multiple assets at a glance. The table is dynamically updated as new data comes in.
Interactive Labels:
The indicator adds labels to the chart, showing the average range for each symbol. These labels adjust in real-time as the price range values change, giving users an immediate view of volatility rankings.
How to Use:
Set Time Periods: Adjust the time periods (lengths) to match your trading strategy's timeframe and volatility preference.
Symbol Selection: Add and track the price range for your preferred symbols (cryptocurrencies, stocks, indices).
Monitor Volatility: Use the visual table and plot to identify symbols with higher or lower volatility, and adjust your trading strategy accordingly.
Interpret the Table and Chart: Ranges that are color-coded from red/orange (lower volatility) to blue/green (higher volatility) allow you to quickly gauge which symbols are most volatile.
Disclaimer: This tool is provided for informational and educational purposes only and should not be considered as financial advice. Always conduct your own research and consult with a licensed financial advisor before making any investment decisions.
Consolidation Score ScreenerIn trading, a consolidation range is like a timeout after a big move in the price of a stock or symbol.
It's when the market takes a breather, neither pushing the price up nor down too hard.
Visually, it looks like the price moving sideways on a chart , with highs and lows staying within a certain range.
so this indicator is created to help myself and you decide if its a ranging market and what's the score of that consolidation range
The score ranges between 0 and 10 , where 10 is the max consolidation score , meaning this stock or the symbol is at its highest peak of consolidation .
What would you see using this indicator ?
Symbols circles , inside these circles it will print the consolidation score ..
in the middle of the indicator it will show the range of all the 20 symbols scores .
so it will give you like overall ranging value for your 20 symbols
Settings :
TimeFrame : TimeFrame input to select which time frame you want your indicator to analysis
Range length : The Range that you would want your indicator to take into consideration when doing its analysis .
Features :
20 symbols analysis
Multi timeframe capability
Enjoy .
NAS100 - 5 Minute Opening Range with EMAsThis indicator is designed for traders who focus on the opening range breakout strategy and use EMAs as part of their trading decisions. The script markes the first 5 min opening candle and generates Buy and Sell signals calculating EMA.
Basic features are :
User Inputs: Allows users to enable/disable alerts and choose to display Exponential Moving Averages (EMAs) for 5, 20, and 50 periods.
Opening Range Calculation: It calculates the first five minutes of the trading day, adjusting for different chart timeframes.
New Day Detection: Determines if the current bar is the first bar of a new day.
Data Storage: Utilizes arrays to store opening range highs, lows, start bars, and last bars for the last five days.
Daily Updates: Updates the stored data at the start of each new day, maintaining data for only the last five days.
Opening Range Plotting: Plots the opening ranges (high and low) for the past five days, with special plotting and filling for the current day.
EMA Calculation and Plotting: Calculates and plots EMAs (5, 20, and 50 periods) if enabled.
Alert Conditions: Sets up conditions for alerts when the price crosses above or below the current day's opening range.
Signal Generation: Generates buy and sell signals based on the relationship of the closing price to the opening range and the position of EMA5 relative to EMA50.
Signal Plotting: Plots buy and sell signals as triangles on the chart.
True Range OscHey fellow traders! I've just published a new indicator called the True Range Oscillator. It's designed to help you better understand price movements and volatility. The indicator calculates the average true range of the price data and uses a modified z-score-like approach to normalize it. The main difference is that it uses true range instead of standard deviation for normalization.
This oscillator identifies the highest and lowest values within a specified range, excluding any outliers based on standard deviations. It then scales the output between 0 and 100, so you can easily see how the current price action compares to its historical range. You can use the True Range Oscillator to spot potential trend reversals and overbought/oversold conditions.
Here are some features to explore:
Customize your price data source (open, high, low, or close).
Adjust the length and smoothing settings for the average true range calculation.
Find outliers with standard deviations, and tweak the outlier_level and dev_lookback options.
Visualize price action with plotted lines for the upper range (70), lower range (30), and center line (50), along with a shaded area between the upper and lower ranges for added clarity.
I hope you find this indicator useful in your trading journey!
Higher Time Frame Average True RangesPurpose: This script will help an options trader asses risk and determine good entry and exit strategies
Background Information: The true range is the greatest of: current high minus the current low; the absolute value of the current high minus the previous close; and the absolute value of the current low minus the previous close. The Average True Range (ATR) is a 14-day moving average of the true range. Traders use the ATR indicator to assess volatility in stocks and decide when to enter and exit trades. It is important to note the limitations of using True Range and ATR: These indications cannot tell you the direction of your options trade (call vs. put) and they cannot tell you whether a particular trend is about to reverse. However, it can be used to assess if volatility has peaked for a particular direction and time period.
How this script works: This indicator calculates true range for the daily (DTR), weekly (WTR), and monthly (MTR) time frames and compares it to the Average True Range (ATR) for each of those time frames (DATR, WATR, and MATR). The comparison is displayed into a colored table in the upper right-hand corner of the screen. When a daily, weekly, or monthly true range reaches 80% of its respective ATR, the row for that time frame will turn Orange indicating medium risk for staying in the trade. If the true range goes above 100% of the respective ATR, then the row will turn Red indicating high risk for staying in the trade. When the row for a time period turns red, volatility for the time period has likely peaked and traders should heavily consider taking profits. It is important to note these calculations start at different times for each time frame: Daily (Today’s Open), Weekly (Monday’s Open), Monthly (First of the Month’s Open). This means if it’s the 15th of the month then the Monthly True Range is being calculated for the trading days in the first half of the month (approximately 10 trade days).
The script also plots three sets of horizontal dotted lines to visually represent the ATR for each time period. Each set is generated by adding and subtracting the daily, weekly, and monthly ATRs from that time periods open price. For example, the weekly ATR is added and subtracted from Mondays open price to visually represent the true range for that week. The DATR is represented by red lines, the WATR is represented by the green lines, and the MATR is represented by the blue lines. These plots could also be used to assess risk as well.
How to use this script: Use the table to assess risk and determine potential exit strategies (Green=Low Risk, Orange=Medium Risk, Red=High Risk. Use the dotted lines to speculate what a stock’s price could be in a given time period (Daily=Red, Weekly=Green, and Monthly=Blue). And don’t forget the true range’s calculation and plots starts at the beginning of each time period!
Previous Range Values, BasicOur P.R.V (Previous Range Values)(Basic) indicator is pretty simple; it plots the previous ranges of the high/low for the structured timeframes. This helps to quickly identify the primary Historical supports and resistances according to the Gregorian time structure. Additionally, a 'custom' field allows for a wider selection other than the scripts default, however the custom selection uses the pre-defined timeframes opposed to manual inputs since the conversion is in minutes and would limit/cap the available range. The plotted lines are designed to remain "out of the way" from the current candle.
To disable a range, simply change the opacity to 0%
Additional script features allow for fully adjustable settings and configurations:
• Adjustable; Range Colors
• Adjustable; Toggles
Oasis Trading Group Market Making Bot - Mean Reversion BandsThe OTG Market Making Bot was designed with mean reversion trading in mind. It uses advanced ATR and other volatility formulas to create a set of bands that price should stay within. If price is testing the upper or lower bands then it is "extended" and a mean reversion back to the midline is likely.
The indicator comes with two sets of reversion bands, by default they are set to two and three standard deviations away from the midline, these can be changed to your preference. The indicator will give you Buy and Sell arrows if the conditions are being met. The conditions can be as simple as price hitting the bands or with certain filters, the filters are as follows:
Volatility Filter: Based on your settings it will look at the Current ATR vs Historic ATR Average if the Current ATR is higher than the average it will not show the mean reversion Buy/Sell signals because the volatility is too high. This filter can be turned on and off in the settings.
Trend Filter: Based on your settings it will lookback a certain amount of candles to see if the current price action is ranging or trending. If the current price action is determined to be trending it will not show the mean reversion Buy/Sell signals because it wants to trade within a range. This filter cannot be turned off in the settings, but if you wish to see all the Mean Reversion Buy/Sell signals without any filters you can turn them on in the style settings.
Midline: The midline is color coded based on your Trend Lookback settings. If it determines that the market is ranging it will be colored Green, if it determines that the market is trending it will be colored Red. Green means you are safe to take Mean Reversion trades.
The indicator comes with multiple alerts for all the different Buy/Sell signals. These signals can come from the first set of bands, second set, or unfiltered.
This indicator is designed to be paired with the ATR Improved Indicator I have created which is open source, it can be found here.
Also, paired with the OTG Automated Trading Bot. The OTG Trading Bot is a trend following bot, it excels in trend trading but fails in range trading. This Mean Reversion bot was designed to compliment the OTG Bot perfectly.
The Oasis Trading Group Market Making Bot will be available as a free add-on to all OTG Trading Bot users.
If you have any questions feel free to let me know in the comments or DM me.
Precision Price Channel [AstrideUnicorn]Precision Price Channel (PPC) is a channel indicator based on advanced Kalman filtering. As one can see, the PPC channel is very narrow, but the price stays inside it with a very high probability. It is a precise model that shows the bounds for price swings in trending or ranging markets.
The indicator helps to determine optimal prices to enter a long or short trade. One can also use it for mean reversion trading when the market is in a range regime, just like other channel indicators.
How to use
The trader can use PPC in pair with their trading system to find the best price to enter a long or short trade suggested by their strategy.
For example, if you feel bullish about a market, you can enter a long position at the moment when the price crosses the bottom PPC line and leaves the channel. A green circle arrives below this candle, indicating the best price for a long trade. Such entry points ensure that you “buy very low” if the market will surge eventually.
If the trader thinks that the price of an asset is to decrease, they can wait for the indicator to show the best price for a short trade. The best moment to enter a sell position is when a candle breaks out of the PPC channel through the upper line. A red circle will show above such a candle.
In this use case, one should look at the red and green circles not as at signals that forecast the market will go up or down but real-time signals showing that now it is the best price to enter a long or short trade.
One can also use the PPC indicator to get entry signals. If the market is in a range regime, the red and green circles give mean-reversion signals for short-term trades inside the range.
The price crossing the blue middle line can serve as a signal to enter a trend.
The PPC indicator is auto-adjustable and does not have any user settings.
888 BOT #alerts█ 888 BOT #alerts (open source)
This is an Expert Advisor 'EA' or Automated trading script for ‘longs’ and ‘shorts’, which uses only a Take Profit or, in the worst case, a Stop Loss to close the trade.
It's a much improved version of the previous ‘Repanocha’. It doesn`t use 'Trailing Stop' or 'security ()' functions (although using a security function doesn`t mean that the script repaints) and all signals are confirmed, therefore the script doesn`t repaint in alert mode and is accurate in backtest mode.
Apart from the previous indicators, some more and other functions have been added for Stop-Loss, re-entry and leverage.
It uses 8 indicators, (many of you already know what they are, but in case there is someone new), these are the following:
1. Jurik Moving Average
It's a moving average created by Mark Jurik for professionals which eliminates the 'lag' or delay of the signal. It's better than other moving averages like EMA , DEMA , AMA or T3.
There are two ways to decrease noise using JMA . Increasing the 'LENGTH' parameter will cause JMA to move more slowly and therefore reduce noise at the expense of adding 'lag'
The 'JMA LENGTH', 'PHASE' and 'POWER' parameters offer a way to select the optimal balance between 'lag' and over boost.
Green: Bullish , Red: Bearish .
2. Range filter
Created by Donovan Wall, its function is to filter or eliminate noise and to better determine the price trend in the short term.
First, a uniform average price range 'SAMPLING PERIOD' is calculated for the filter base and multiplied by a specific quantity 'RANGE MULTIPLIER'.
The filter is then calculated by adjusting price movements that do not exceed the specified range.
Finally, the target ranges are plotted to show the prices that will trigger the filter movement.
Green: Bullish , Red: Bearish .
3. Average Directional Index ( ADX Classic) and ( ADX Masanakamura)
It's an indicator designed by Welles Wilder to measure the strength and direction of the market trend. The price movement is strong when the ADX has a positive slope and is above a certain minimum level 'ADX THRESHOLD' and for a given period 'ADX LENGTH'.
The green color of the bars indicates that the trend is bullish and that the ADX is above the level established by the threshold.
The red color of the bars indicates that the trend is down and that the ADX is above the threshold level.
The orange color of the bars indicates that the price is not strong and will surely lateralize.
You can choose between the classic option and the one created by a certain 'Masanakamura'. The main difference between the two is that in the first it uses RMA () and in the second SMA () in its calculation.
4. Parabolic SAR
This indicator, also created by Welles Wilder, places points that help define a trend. The Parabolic SAR can follow the price above or below, the peculiarity that it offers is that when the price touches the indicator, it jumps to the other side of the price (if the Parabolic SAR was below the price it jumps up and vice versa) to a distance predetermined by the indicator. At this time the indicator continues to follow the price, reducing the distance with each candle until it is finally touched again by the price and the process starts again. This procedure explains the name of the indicator: the Parabolic SAR follows the price generating a characteristic parabolic shape, when the price touches it, stops and turns ( SAR is the acronym for 'stop and reverse'), giving rise to a new cycle. When the points are below the price, the trend is up, while the points above the price indicate a downward trend.
5. RSI with Volume
This indicator was created by LazyBear from the popular RSI .
The RSI is an oscillator-type indicator used in technical analysis and also created by Welles Wilder that shows the strength of the price by comparing individual movements up or down in successive closing prices.
LazyBear added a volume parameter that makes it more accurate to the market movement.
A good way to use RSI is by considering the 50 'RSI CENTER LINE' centerline. When the oscillator is above, the trend is bullish and when it is below, the trend is bearish .
6. Moving Average Convergence Divergence ( MACD ) and ( MAC-Z )
It was created by Gerald Appel. Subsequently, the histogram was added to anticipate the crossing of MA. Broadly speaking, we can say that the MACD is an oscillator consisting of two moving averages that rotate around the zero line. The MACD line is the difference between a short moving average 'MACD FAST MA LENGTH' and a long moving average 'MACD SLOW MA LENGTH'. It's an indicator that allows us to have a reference on the trend of the asset on which it is operating, thus generating market entry and exit signals.
We can talk about a bull market when the MACD histogram is above the zero line, along with the signal line, while we are talking about a bear market when the MACD histogram is below the zero line.
There is the option of using the MAC-Z indicator created by LazyBear, which according to its author is more effective, by using the parameter VWAP ( volume weighted average price ) 'Z-VWAP LENGTH' together with a standard deviation 'STDEV LENGTH' in its calculation.
7. Volume Condition
Volume indicates the number of participants in this war between bulls and bears, the more volume the more likely the price will move in favor of the trend. A low trading volume indicates a lower number of participants and interest in the instrument in question. Low volumes may reveal weakness behind a price movement.
With this condition, those signals whose volume is less than the volume SMA for a period 'SMA VOLUME LENGTH' multiplied by a factor 'VOLUME FACTOR' are filtered. In addition, it determines the leverage used, the more volume , the more participants, the more probability that the price will move in our favor, that is, we can use more leverage. The leverage in this script is determined by how many times the volume is above the SMA line.
The maximum leverage is 8.
8. Bollinger Bands
This indicator was created by John Bollinger and consists of three bands that are drawn superimposed on the price evolution graph.
The central band is a moving average, normally a simple moving average calculated with 20 periods is used. ('BB LENGTH' Number of periods of the moving average)
The upper band is calculated by adding the value of the simple moving average X times the standard deviation of the moving average. ('BB MULTIPLIER' Number of times the standard deviation of the moving average)
The lower band is calculated by subtracting the simple moving average X times the standard deviation of the moving average.
the band between the upper and lower bands contains, statistically, almost 90% of the possible price variations, which means that any movement of the price outside the bands has special relevance.
In practical terms, Bollinger bands behave as if they were an elastic band so that, if the price touches them, it has a high probability of bouncing.
Sometimes, after the entry order is filled, the price is returned to the opposite side. If price touch the Bollinger band in the same previous conditions, another order is filled in the same direction of the position to improve the average entry price, (% MINIMUM BETTER PRICE ': Minimum price for the re-entry to be executed and that is better than the price of the previous position in a given %) in this way we give the trade a chance that the Take Profit is executed before. The downside is that the position is doubled in size. 'ACTIVATE DIVIDE TP': Divide the size of the TP in half. More probability of the trade closing but less profit.
█ STOP LOSS and RISK MANAGEMENT.
A good risk management is what can make your equity go up or be liquidated.
The % risk is the percentage of our capital that we are willing to lose by operation. This is recommended to be between 1-5%.
% Risk: (% Stop Loss x % Equity per trade x Leverage) / 100
First the strategy is calculated with Stop Loss, then the risk per operation is determined and from there, the amount per operation is calculated and not vice versa.
In this script you can use a normal Stop Loss or one according to the ATR. Also activate the option to trigger it earlier if the risk percentage is reached. '% RISK ALLOWED' wich is calculated according with: '%EQUITY ON EACH ENTRY'. Only works with Stop Loss on 'NORMAL' or 'BOTH' mode.
'STOP LOSS CONFIRMED': The Stop Loss is only activated if the closing of the previous bar is in the loss limit condition. It's useful to prevent the SL from triggering when they do a ‘pump’ to sweep Stops and then return the price to the previous state.
█ ALERTS
There is an alert for each leverage, therefore a maximum of 8 alerts can be set for 'long' and 8 for 'short', plus an alert to close the trade with Take Profit or Stop Loss in market mode. You can also place Take Profit limit and Stop Loss limit orders a few seconds after filling the position entry order.
- 'MAXIMUM LEVERAGE': It is the maximum allowed multiplier of the % quantity entered on each entry for 1X according to the volume condition.
- 'ADVANCE ALERTS': There is always a time delay from when the alert is triggered until it reaches the exchange and can be between 1-15 seconds. With this parameter, you can advance the alert by the necessary seconds to activate it earlier. In this way it can be synchronized with the exchange so that the execution time of the entry order to the position coincides with the opening of the bar.
The settings are for Bitcoin at Binance Futures (BTC: USDTPERP) in 15 minutes.
For other pairs and other timeframes, the settings have to be adjusted again. And within a month, the settings will be different because we all know the market and the trend are changing.
Volume-based Support and ResistanceV1.00
Pre-release; still working on this.
Identify the highest volume candles can plot support/resistance based on them.
Will try to create ranges using them.
3BBands (3 Spirolinas)The script combines 3 single Bollinger bands into one script for easy plotting and range modification. It can be used for analyzing a market with multiple time frames and ranges using Fibonacci series as the range.
ES 30 Second Futures Session Opening Range30 Second Futures Session Open Range Pro
Overview
This Pine Script indicator is designed for futures traders who utilize opening range breakout strategies across multiple global trading sessions. The indicator provides comprehensive session-based opening range analysis with precise 30-second data sampling and advanced 15-point interval projections.
Key Features
Multi-Session Opening Range Analysis
RTH (Regular Trading Hours): 8:30 AM CT - New York session opening range
Globex (Asian Session): 5:00 PM CT - Asian market session opening range
Europe Session: 2:00 AM CT - European market session opening range
Core Functionality
High/Low/Mid Lines: Displays opening range boundaries and midpoint for each session
Customizable Colors: Full color customization for each session's lines
Price Labels: Optional price display on all levels with session identification
Statistics Table: Real-time table showing high, low, and range width for active sessions
Advanced 15-Point Interval System
RTH-Specific Feature: Plots 5 levels above and below RTH opening range at 15-point intervals
Projection Levels: +15, +30, +45, +60, +75 above RTH high and corresponding negative levels below RTH low
Customizable Labels: Toggle price display and session names on interval lines
Color-Coded: Separate colors for upside and downside projections
Enhanced Trading Tools
Breakout Detection: Automatic identification of opening range breakouts with visual signals
Alert System: Built-in alerts for all session breakouts (up and down)
Range Boxes: Optional visual boxes highlighting opening ranges
Multiple Timeframe Support: Works across various chart timeframes
Display Options
Label Customization: Multiple size options (Tiny, Small, Normal, Large)
Session Toggle: Individual on/off controls for each session
Transparency Controls: Adjustable transparency for range boxes
Professional Styling: Clean, professional appearance suitable for live trading
Trading Applications
This indicator is particularly valuable for:
Gap Trading: Identifying key levels after overnight gaps
Breakout Trading: Clear visual confirmation of range breakouts
Support/Resistance: Using opening ranges as dynamic S/R levels
Session Transition: Understanding how price behaves across global sessions
Position Sizing: Using 15-point intervals for precise entry and exit strategies
Technical Specifications
Version: Pine Script v5
Overlay: True (plots directly on price chart)
Max Lines: 500 (accommodates extensive level plotting)
Timezone: America/Chicago (Central Time)
Data Frequency: 30-second precision for opening range calculation
Usage Notes
Designed for various futures contracts (ES, NQ, YM, RTY, etc.)
Best performance on intraday timeframes (30s, 1m, 5m, 15m, 30m)
Opening ranges calculated based on precise 30-second intervals at session starts
All alerts are customizable through TradingView's alert system
Customization Options
The indicator offers extensive customization including:
Color schemes for each session
Label display preferences
Line transparency and thickness
Statistical table positioning
Alert message customization
NQ 65 Point Futures Session 30 Second Opening RangeNQ 65 Point Futures Session Open Range Pro
Overview
This Pine Script indicator is designed specifically for NASDAQ-100 E-mini (NQ) futures traders who utilize opening range breakout strategies across multiple global trading sessions. The indicator provides comprehensive session-based opening range analysis with advanced 65-point interval projections.
Key Features
Multi-Session Opening Range Analysis
RTH (Regular Trading Hours): 8:30 AM CT - New York session opening range
Globex (Asian Session): 5:00 PM CT - Asian market session opening range
Europe Session: 2:00 AM CT - European market session opening range
Core Functionality
High/Low/Mid Lines: Displays opening range boundaries and midpoint for each session
Customizable Colors: Full color customization for each session's lines
Price Labels: Optional price display on all levels with session identification
Statistics Table: Real-time table showing high, low, and range width for active sessions
Advanced 65-Point Interval System
RTH-Specific Feature: Plots 5 levels above and below RTH opening range at 65-point intervals
Projection Levels: +65, +130, +195, +260, +325 above RTH high and corresponding negative levels below RTH low
Customizable Labels: Toggle price display and session names on interval lines
Color-Coded: Separate colors for upside and downside projections
Enhanced Trading Tools
Breakout Detection: Automatic identification of opening range breakouts with visual signals
Alert System: Built-in alerts for all session breakouts (up and down)
Range Boxes: Optional visual boxes highlighting opening ranges
Multiple Timeframe Support: Works across various chart timeframes
Display Options
Label Customization: Multiple size options (Tiny, Small, Normal, Large)
Session Toggle: Individual on/off controls for each session
Transparency Controls: Adjustable transparency for range boxes
Professional Styling: Clean, professional appearance suitable for live trading
Trading Applications
This indicator is particularly valuable for:
Gap Trading: Identifying key levels after overnight gaps
Breakout Trading: Clear visual confirmation of range breakouts
Support/Resistance: Using opening ranges as dynamic S/R levels
Session Transition: Understanding how price behaves across global sessions
Risk Management: Using 65-point intervals for position sizing and target setting
Technical Specifications
Version: Pine Script v5
Overlay: True (plots directly on price chart)
Max Lines: 500 (accommodates extensive level plotting)
Timezone: America/Chicago (Central Time)
Data Frequency: 30-second precision for opening range calculation
Usage Notes
Designed specifically for NQ futures but may work on other instruments
Best performance on intraday timeframes (1m, 5m, 15m, 30m)
Opening ranges calculated based on first 30 seconds of each session
All alerts are customizable through TradingView's alert system
Customization Options
The indicator offers extensive customization including:
Color schemes for each session
Label display preferences
Line transparency and thickness
Statistical table positioning
Alert message customization
Twin Range Filter V2 – Buy/Sell Signals📊 Indicator Name: Twin Range Filter – Buy/Sell Signals
📝 Description:
The Twin Range Filter is a trend-following indicator that combines two adaptive volatility filters to identify potential market reversals and trend continuations. It uses two configurable smoothing periods (fast and slow) to calculate a dynamic range around price, filtering out market noise and highlighting meaningful shifts in direction.
This indicator plots BUY and SELL signals based on price action in relation to the range filter, as well as internal trend conditions.
✅ How It Works:
Long Signal (BUY) is triggered when:
Price is above the filtered range (showing strength), and
Short-term upward momentum is confirmed.
Short Signal (SELL) is triggered when:
Price is below the filtered range (showing weakness), and
Short-term downward momentum is confirmed.
The signals are highlighted using green "Long" and red "Short" labels on the chart.
Background colors reinforce the current directional bias.
⚙️ Inputs:
Fast Period & Range: Adjust sensitivity of the fast range filter.
Slow Period & Range: Adjust smoothing of the slow range filter.
Source: Choose which price to base calculations on (e.g., Close, Open, HL2, etc.)
🔔 Alerts:
Long Signal – A new BUY condition has been detected.
Short Signal – A new SELL condition has been detected.
📌 Use Cases:
Entry timing for swing or intraday trades
Trend confirmation filter
Signal generator in automated strategies (when paired with a strategy scrip
ADR/ATR Ranges & DashboardADR/ATR Ranges & Dashboard
Description:
The ADR/ATR Ranges & Dashboard indicator is a comprehensive tool designed to visualize key market volatility levels and provide traders with a clear daily framework. This script combines Average Daily Range (ADR) and Average True Range (ATR) metrics across multiple timeframes to assist in defining realistic intraday price targets and stop levels.
Key Features:
ADR Levels (Upper/Lower) plotted automatically based on a customizable period.
Daily High/Low and Previous Day High/Low plotted for context and range awareness.
Custom Range High/Low: Define your own time range to track session-specific extremes.
Dashboard Panel summarizing ADR values, distances to key levels, and custom range data.
Multi-timeframe ATR Dashboard (M1, M5, M15, H1, H4, D1) for detailed volatility insight.
Fully customizable colors and line styles (via the Style tab).
Adjustable dashboard font size and position.
How ADR differs from ATR:
ADR calculates the average difference between daily highs and lows over a set number of days — showing how much price typically moves per day.
ATR measures the average range (including gaps) within a given timeframe — providing a more comprehensive view of volatility.
Ideal for:
Day traders, scalpers, and swing traders needing clear intraday structure.
Volatility-based trading strategies (range breakouts, mean reversion, etc.).
Identifying realistic take-profit and stop-loss zones based on historical price behavior.
Created by: Precious Life Dynamics
ICT IPDA Lookback / Cast-forwardThis script automatically displays 20/40/60 daily range highs and lows.
Known as IPDA ranges, a term popularised by Inner Circle Trader (ICT). IPDA = Interbank Price Delivery Algorithm.
You can also add 80 day lines (my own addition) . IPDA labels are shown for Daily highs, and an equivalent line is drawn at IPDA Daily lows - but without the label to keep your chart as clean as possible. You can use this on hourly timeframes as well.
ICT is "flexible" on IPDA data ranges in his mentorship regarding whether you should use the first day of each month, or go recalculate day by day, and that's why this script lets you do both + also has an option to set a hard specified date - useful for more advanced purposes.
You can also Cast-forward the displayed 20/40/60 (+80) IPDA ranges with this tool.
You can use IPDA ranges to forecast Highs and Lows that price will be attracted to on a Daily timeframe and where price is in its P/D range, being in a discount or premium. You can also use this knowledge to help guide lower timeframe scalps.
Longer term traders can reference the 40 and 60 Day Look Back lines for an indication of current market conditions.
ICT Dealing RangeICT Dealing Range
This indicator identifies and plots ICT (Inner Circle Trader) Dealing Ranges - key institutional areas where smart money accumulates or distributes positions before significant moves.
What is a Dealing Range?
A Dealing Range is a significant price area where institutional traders accumulate or distribute their positions. These ranges form through a specific sequence of price movements that indicate institutional order flow:
Bullish Dealing Range Sequence:
1. Initial High (H)
2. Initial Low (L)
3. Higher High (HH)
4. Lower Low (LL)
5. Break above HH (confirmation)
Bearish Dealing Range Sequence:
1. Initial Low (L)
2. Initial High (H)
3. Lower Low (LL)
4. Higher High (HH)
5. Break below LL (confirmation)
My Trading Strategy
Entry Methods:
1. Range Extreme Retests:
- After range formation, wait for price to return to either extreme
- Long entries at range bottom with stops below
- Short entries at range top with stops above
2. Mid-Line Strategy:
- Use the mid-line as a pivot point for reversals
- Long entries on mid-line bounce with stops below
- Short entries on mid-line rejection with stops above
Stop Loss Placement:
- When entering at extremes: Place stops beyond the mid
- When entering at mid-line: Place stops beyond the opposing extreme
- Always respect the structure's boundaries
Take Profit Targets:
- Minimum 2:1 Risk-Reward ratio
- For extreme entries: Target the opposite extreme
- For mid-line entries: Target the nearest extreme
Risk Management
- Never enter without a clear invalidation point
- Maintain minimum 2:1 RR ratio
- Consider market structure and higher timeframe context
Indicator Features
- Auto-detection of dealing range patterns
- Color-coded boxes (green for bullish, red for bearish)
- Optional mid-line display
- Customizable colors and styles
- Adjustable pivot lookback periods
Notes
This tool is based on ICT concepts but should be used in conjunction with other forms of analysis. The dealing range provides a framework for understanding institutional order flow, but proper risk management and market context are essential for successful trading.
Remember: The best trades often come from clean retests of these ranges after their initial formation. Patience in waiting for proper setups is key to successful implementation.
DMR Dynamic Market Range By ANTExplanation of the DMR Dynamic Market Range Script
a. What is This Script and How Is It Useful?
This Pine Script, named "DMR Dynamic Market Range by ANT," is designed for use on TradingView, focusing on dynamically assessing market conditions. It calculates key levels, specifically the high and low of the previous two days, to establish trading zones that assist traders in making informed decisions.
The script highlights:
Previous Day's High and Low : It captures the high and low prices from the previous two days to help set up trading ranges.
Trade Zones : It identifies whether the current price is in a 'tradeable' zone or 'non-tradeable' zone. The zones are determined based on the relationship between the current price, today's open price, and the calculated high and low levels.
Targets and Stop Losses : The script dynamically provides target and stop-loss levels based on user-defined input points, which can help manage risk effectively.
This script is beneficial for traders looking to enter (or avoid) trades based on defined price action criteria and can effectively streamline the analysis process in fast-moving markets.
Customize Input Parameters: (settings)
Adjust the target and stop-loss points based on your risk tolerance and trading style. The default values (30, 70, 100 for targets and 10 for stop-loss) may not suit every trader.
Experiment with different values to find what works best for your trading strategy.
b. How to Effectively Use This Script
The DMR script can be utilized across various trading instruments, including:
Indexes : Suitable for gauging market sentiment and overall trends; can assist in short-term trading strategies.
Options: Helps determine the likely movement of the underlying assets, providing insight into probable volatility and directional bias.
ETFs (Exchange-Traded Funds): Useful for trading diversified portfolios; traders can define entry and exit points relevant to the basket of stocks.
Stocks: Ideal for individual stock trading, as traders can analyze stock movements concerning broader market trends.
When utilizing this script, traders should:
Identify key trading levels before entering trades based on the calculated high and low ranges.
Use the dynamic targets and stop-loss levels to protect capital and maximize potential gains.
Continuously monitor the script's signals and adapt to ongoing market changes.
c. Best Time Frames for Different Instruments
The optimal time frames for using the DMR script can vary based on the trading instrument.
Here’s a summary in tabular format for clearer guidance:
Instrument Best Time Frames
Index 5-minute, 15-minute, 1-hour
Options 1-minute, 5-minute, 15-minute
ETF 5-minute, 15-minute, 1-hour
Stocks 5-minute, 15-minute, 1-hour, Daily
Indexes: Shorter time frames (5 to 15 minutes) can capture quick market movements, while 1-hour frames can provide a broader market overview.
Options Trading: Given the time sensitivity of options, using very short time frames (1-5 minutes) can be effective to seize rapid price movements before expiry.
ETFs: Similar to indices, shorter frames help in effectively tracking movements of the underlying assets.
Stocks: A mix of short (5-15 minutes) for day trading and daily charts for swing trading can provide balanced insights.
Conclusion
Utilizing the DMR Dynamic Market Range script can greatly enhance a trader's ability to analyze market conditions, identify opportunities, and manage risk effectively. By adapting the script through the different listed recommendations, traders can maximize their trading strategy’s effectiveness across various instruments.
[F][IND] - Time Range HighlighterDescription:
Introducing the Time Range Highlighter script for TradingView – a precision tool designed to enhance your chart analysis experience with a focus on simplicity and functionality. This script caters to traders who find value in isolating specific time intervals for a more detailed market study, akin to the concept of trading "macros".
Key Features:
1. Effortless Customization:
Define and highlight your preferred time ranges effortlessly. Tailor the script to align with your trading strategy by setting specific start and end times for enhanced precision.
2. Multi-Interval Support:
Seamlessly analyze multiple time ranges concurrently. Toggle between highlighted intervals with ease, allowing for a comprehensive examination of various market conditions without cluttering your chart.
3. Enable/Disable On-Demand:
Maintain control over the clutter on your chart. The enable/disable feature lets you activate or deactivate the highlighted time ranges at your discretion, ensuring a clean and unobstructed view when needed.
4. Focused Chart Analysis:
By visually emphasizing chosen time intervals, the script facilitates a focused analysis of critical market movements, enabling traders to identify patterns and trends with efficiency. This feature is particularly beneficial for those employing trading "macros" to filter out noise and concentrate on key periods.
Usage Instructions:
1. Apply the Time Range Highlighter script to your TradingView chart.
2. Customize the script settings to define specific time ranges tailored to your trading preferences.
3. Toggle between enabled and disabled states as needed to maintain clarity on your chart.
4. Leverage the script to streamline your chart analysis process and make more informed trading decisions, especially when employing trading "macros" to focus on specific market intervals.
Disclaimer:
This indicator is provided for educational purposes only. Trading involves risk, and users should consult with a financial professional before making any trading decisions.
Your Feedback Matters!
Please feel free to comment or reach out if you have any improvement suggestions or if you would like to request the development of a specific indicator. Your feedback is invaluable!
CofeeShopCrypto CoffeeBreak RSI**This Indicator DOES NOT REPAINT**
For me the RSI who's been a very powerful tool but one of the things that's been missing from it time and time again is the ability to show true dynamic support and resistance that is generated by the movements of the RSI.
This version of the Relative Strength Index is designed to visualize and mark Support and Resistance conditions on the Relative Strength Index (RSI) itself, and leaving behind those known dynamic support and resistance (S/R) zones.
It also has the ability during live marks to show you whether the majority of momentum is to the bullish or bearish side and if there is a conflict between the current momentum and the support or resistance zone that you are inside of. In short it will create the zones during live market.
This means you don't have to wait to only look at previous values you can also make an assessment during live breakouts on current support and resistance levels as well as using previous support and resistance levels as markers for any limits in movement.
Inputs Tab:
Show Dynamic Zone Creator - Gives you a live action SR Generator on your chart at your current bars which extends a bit into the future for a better visual sense of activity.
The color of this area can be set manually or you can let the script color this area automatically.
This Generator helps to plot Support and Resistance Zones on your chart.
If no zone is triggered then it will move on.
If a zone is triggered, it will change to the appropriate color and leave the zone behind as the new candles form.
Show Dynamic Zone Mid Level - This is just a midline of the Zone Creator to get an earlier visualization of what's happening inside the zone when it is very large.
I use this midline as a breakpoint when price and RSI values come back to this level and both break it. If only ONE breaks the level, I do not take it as a confirmation.
Extend RSI support and resistance boxes into the future - this is strictly up to the user which value you set. It will simply extend the zones that were left behind into the future as many bars as you choose. Depending on the chart or asset that you trade and how much volatility there is at the time you should be able to determine a good length for these boxes.
How many bars reflect the dynamic S/R zone - raising this value can overlap more zones using more bars going backwards. This can intensify the color of the current zone being created. The lowest value you should use is 2. But the higher you make this value you will also be able to see previous zones created with more intensity. Raising this value above the RSI value can give you a very nice previous depletion of color on previous zones where you'll be able to watch them fade away and it will intensify the current ones being created.
Only show this many previous support and resistance zones - this is a way to limit the number of zones that are being left behind on your chart which could possibly slow down the activity of calculations and how your chart moves with more indicators on it. Technically you can show 400 to 500 previous zones on your chart but you don't really need to see that many in the past so set this to something that is relative to how far in history you need to reference SR levels.
------------- Lets talk about how to take trades and see false breakouts. -------------
Support Created, Not broken, False Breakout
In the image below you can see how the Dynamic Zone Generator left behind a Support Level however the RSI was unable to break above it.
This creates a price swing on the chart.
The RSI later comes back to this level, however while price breaks this level, the RSI does not.
This confirms that it is a false breakout.
------------------------------------------------------------------------------------------
Now lets take a look at what a confirmed breakout is for a short along with a Continuation of short move. This is quickly followed by a divergence.
In the image below you can see how the RSI was in its ranging area and broke below that range. In this case it would be be below -10. During this time it never created a support level or resistance level underneath it implicating that it has continuous movement.
You can see later that when it broke back inside of the range did not go long instead there was a red resistance area created below the RSI. The RSI then again broke below -10 and it broke through this resistance area below it indicating another quick short entry. This is the setup for a quick continuation. Be careful of these setups as they are usually followed quickly by a divergence.
----------------------------------------------------------------------------------
The Dynamic Zone Creator takes its time to calculate. It cant predict the future so you'll have to just let it do its thing. Once the candles close and they confirm, you'll have the color, and zone size you need.
The Dynamic Zone Creator works against your currently OPEN candles.
It will give you a high and a low area of a zone which you can use in later points of the oscillator to determine if you have valid breakouts and or bounces of price and momentum.
When set to automatic coloring, its zone background and midline will automatically change their colors to match the momentum of the RSI and price.
If there is no support or resistance found, the Zone Creator will simply move onto the next candles in play.
If there IS support or resistance found, the Zone Creator will leave behind a phantom zone or Support or Resistance.
Keep in mind these zones left behind will turn into opposing Support or Resistance depending on if price and momentum break these areas simultaneously.
----------------------------Reason for closed source----------------------------
This indicator will be updated in the future to also produce trendlines, signals, and incorporate different methods of validate pivots and volume by calculations I have created of my own.
To avoid publishing this script more than once and give you all a direct access, without having to find a secondary or tertiary publication with the addons code is protected and will be updated here.
I have put several days into this particular script and will continue over the next few weeks to add in complimentary coding as this version of the script is really just stage one.
IMGBasic - HTF Structure / Order Blocks / Breakers - V1.0IMG Indicators Overview
The IMG Indicators are crafted as comprehensive educational tools for price action traders. They incorporate a variety of concepts including:
1. Multiple Timeframe Analysis
2. Order Blocks (OB)
3. Breakers (BRKR)
4. Fair Value Gaps (FVGs)
5. Overlaps of OB and FVG
6. Overlaps of BRKR and FVG
7. Analysis of Internal and External Liquidity
8. Strategies for Identifying Potential Entries, Stop-loss, and Target Levels
9. Risk Management and Position Sizing
These Price Action concepts can be applied to any market (Stocks / Options / Forex / Futures / Crypto ) and any timeframe.
Introduction to the IMG Basic Indicator
The IMG Basic Indicator serves as the foundational level within the IMG suite of indicators. Its core function is to acquaint traders with elementary price action concepts such as:
1. Higher Timeframe Market Structures through Multiple Timeframe Analysis
2. Higher Timeframe Order Blocks
3. Higher Timeframe Breakers
4. Breaks in Higher Timeframe Market Structure
Higher Timeframe Market Structure:
Market Structure can be defined using several techniques. The IMG indicators employ the Close through High/Low technique, which necessitates a candle close through a structural level to validate a structural break and designate a new range.
Example: H12 Market Structure visualisation on a H12 Chart with annotations:
By selecting a particular Market Structure timeframe in the settings, the indicator immediately illustrates both current and historical market structures for the chosen timeframe across all subordinate timeframes, subject to the limitations of your Tradingview subscription.
Example: H12 Market Structure visualisation on a H1 Chart with annotations:
Higher Timeframe Order Blocks (OB)
An Order Block represents the last candle of the opposite direction preceding a Market Structure Break. For instance, a bullish Order Block is identified as the final bearish candle leading to a bullish market structure break, and vice versa for bearish Order Blocks.
Example: H12 OB visualisation on a H12 Chart with annotations:
When activated, the indicator will highlight the Higher Timeframe Order Blocks responsible for a Market Structure Break on all subordinate timeframes relative to the chosen Market Structure Timeframe.
Note: if multiple OBs exist, the indicator will display the OB closest to the new range extreme
Example: H12 OB visualisation on a H1 Chart with annotations:
Higher Timeframe Breaker Blocks (BRKR)
A Breaker Block is identified as the most recent Order Block that has been breached by price, followed by an opposite Market Structure Break. For example, a bullish Breaker Block is the last bearish Order Block that price has passed through, followed by a bullish structural break, and the inverse is true for bearish Breakers.
Example: H12 Breaker visualisation on a H12 Chart with annotations:
Once enabled, the system will display Higher Timeframe Breaker Blocks after an opposite Market Structure Break is confirmed on all subordinate timeframes.
Example: H12 Breaker visualisation on a H1 Chart with annotations:
ALERTS: Higher Timeframe Market Structure Breaks (HTF MSBs)
The system provides notifications of confirmed Market Structure Breaks based on the selected Higher Timeframe Market Structure Timeframe. For instance, selecting a weekly structure will trigger an alert when price closes through a weekly structural level, and the same logic applies to other timeframes like D, H12, H4, H1 etc.
To enable alerts, right-click on the indicator and select “Add Alert on IMG ...”. You may customise the alert name as desired and then click 'Create' to finalise the alert setup.
General Note:
There is no system, indicator, algorithm, or strategy that can provide absolute certainty in predicting market movements. Use trading indicators as a tool to assist with trading decisions and manage your risk wisely.
For a complete user manual / knowledge base on the IMG Indicators, click on the User Manual link in the signature below
Stay safe and Happy Trading!