Range breaking indicatorDescription
Bull/Bear Area Ratio (last N candles) helps identify potential end-of-range situations by analyzing the relative strength of bullish vs bearish candles over a rolling window of N bars.
Instead of simply counting up or down candles, this script measures the "area" of each candle — the absolute distance between open and close, optionally weighted by volume.
By summing these areas over the last N bars, it calculates the percentage of bullish and bearish energy within that period.
When both sides become balanced (near 50/50), it often signals range exhaustion or possible trend transition.
How it works
Calculates the bullish and bearish area of each candle (abs(close - open), optionally × volume).
Maintains rolling buffers of the last N bars to compute running totals.
Plots both Bullish % (green) and Bearish % (red).
Highlights possible range-ending zones when the bullish ratio nears 50% ± threshold.
Displays a label showing the current balance.
Includes an alert condition when equilibrium is detected.
Inputs
Number of candles (N) – Rolling window length.
Use volume weighting – Multiplies each candle’s area by its volume.
Balance threshold (%) – Sensitivity for detecting equilibrium (default: 10%).
Best use
Combine with volume or volatility indicators to confirm market compression or expansion.
Use on higher timeframes (H1, H4, D1) to detect early signs of accumulation or distribution.
Works across all asset types: crypto, forex, stocks, indices, etc.
Alerts
An alert is triggered when:
“The range of the last N candles is balanced (possible end of range).”
Cari dalam skrip untuk "range"

Range Progress TrackerRANGE PROGRESS TRACKER(RPT)
PURPOSE
This indicator helps traders visually and statistically understand how much of the typical price range (measured by ATR) has already been covered in the current period (Daily, Weekly, or Monthly). It includes key features to assist in trend exhaustion analysis, reversal spotting, and smart alerting.
CORE LOGIC
The indicator calculates the current range of the selected time frame (e.g., Daily), which is:
Current Range = High - Low
This is then compared to the ATR (Average True Range) of the same time frame, which represents the average price movement range over a defined period (default is 14).
The comparison is expressed as a percentage, calculated with this formula:
Range % = (Current Range / ATR) × 100
This percentage shows how much of the “average expected move” has already occurred.
WHY IT MATTERS
When the current range approaches or exceeds 100% of ATR, it means the price has already moved as much as it typically does in a full session.
This indicates a lower probability of continuing the trend with a new high or low, especially when the price is already near the session's high or low.
This setup can signal:
A possible consolidation phase
A reversal in trend
The market entering a corrective phase
SMART ALERTS
The indicator can alert you when:
A new high is made after the range percentage exceeds your set threshold.
A new low is made after the range percentage exceeds your set threshold.
You can adjust the Range % Alert Threshold in the settings to tailor it to your trading style.

Range Filter x Hull SuiteRange Filter x Hull Suite
This indicator is a hybrid of two popular indicators, with a twist; namely the Range Filter (Guikroth version) and the Hull Suite (by Insilico) .
Originally developed as a 1 minute trend following strategy and traded during the New York Session for it's typically high volume / likely trending nature, it provides entry signals based on the following logic:
For bullish entry signals:
The first bullish* candle (*defined by the Range Filter bar color logic, blue by default - which is not necessarily technically a bullish candle as defined by the OHLC values) which appears after the consolidation candles (also defined by the Range Filter bar color logic, orange by default), and where the Hull Suite moving average is also bullish.
For bearish entry signals:
The first bearish* candle (*defined by the Range Filter bar color logic, red by default - which is not necessarily technically a bearish candle as defined by the OHLC values) which appears after the consolidation candles (also defined by the Range Filter bar color logic, orange by default), and where the Hull Suite moving average is also bearish.
The indicator aims to filter out signals where possible consolidation is occurring and comes with styling options and alternative filter options such as a triple moving average trend detection method. Signals can also be filtered by a specific trading session. Standard options for the Range Filter and Hull Suite settings are also able to be customised within the settings menu.
Alerts
Various alerts are built-in, including the custom entry signals unique to this strategy.
Note : The above features listed above are accurate at the time of publishing, but may be altered in future.
Many thanks to guikroth & Insilico for sharing their open source indicators, and also to the original developer of the strategy itself for sharing it.

Range Candles - JDThis tool takes a "RANGE" chart and transforms it into "NORMAL" or "HEIKEN-ASHI" candles.
Instantly giving you a much better visual interpretation of the "range" information!!!
NOTE: due to the nature of Pinescript and how range charts are constructed it's possible the candles are not formed on every tick!!!
When formed though, they don't repaint and are calculated differently for every bar so you get approximately the most accurate view at the price action that Tradingview can offer you!
For compasrison:
this is a view of the "1 minute" chart:
this is the normal "1 range" chart without the candles
this is the same "1 range" chart with Heiken-Ashi candles
this is the normal "1000 range" chart (+/- equal to the 1 minute) without the candles
this is the same "1000 range" chart with Heiken-Ashi candles
JD.
#NotTradingAdvice #DYOR
Disclaimer.
I AM NOT A FINANCIAL ADVISOR.
THESE IDEAS ARE NOT ADVICE AND ARE FOR EDUCATION PURPOSES ONLY.
ALWAYS DO YOUR OWN RESEARCH!
I build these indicators for myself and provide them open source, to use for free to use and improve upon,
as I believe the best way to learn is toghether.

Range Finder Speed CodingThis indicator is based on a Range Filter concept and helps traders identify market direction and strength.
It provides clear information about candle structure, including candle count and range behavior, which helps in understanding price movement more accurately.
The indicator is useful for spotting trend continuation and potential entry zones in ranging and trending markets.
Best suited for intraday and swing trading.
Works well on Forex, Crypto, and Stock markets.
Disclaimer:
This indicator is for educational purposes only. Trading involves risk. Please use proper risk management.

Range Tightening Indicator (RTI)The Range Tightening Indicator (RTI) quantifies price volatility relative to recent price action, helping traders identify low-volatility consolidations that often precede breakouts.
Range Tightening is calculated by measuring the range between each bar’s high and low prices over a chosen lookback period.
A 5-bar period is recommended for shorter-term momentum setups and a 15-bar period is recommended for swing trading. An option for a custom period is available to suit specific strategies. The default look back for custom is 50, ideal for longer term traders.
Other Key Features:
Dynamic Color Coding: The RTI line turns green when volatility doubles after a drop to or below 20, flagging significant volatility shifts commonly seen before breakouts.
Low-Volatility Dots: Orange dots appear on the RTI line when two or more consecutive bars show RTI values below 20, visually marking extended low-volatility periods.
Volatility Zones: Shaded zones provide quick context:
Zone 1 (0-5): Extremely tight volatility, shown in red.
Zone 2 (5-10): Low volatility, shown in light green.
Zone 3 (10-15): Moderate low volatility, shown in green.
The RTI indicator is ideal for traders looking to anticipate breakout conditions, with features that highlight consolidation phases, support momentum strategies, and help improve entry timing by focusing on shifts in volatility.
This indicator was inspired after Deepvue's RMV Indicator, but uses a different calculation. Results may vary.

Range Breakout Signals (Intrabar) [LuxAlgo]The Range Breakout Signals (Intrabar) is a novel indicator highlighting trending/ranging intrabar candles and providing signals when the price breaks the extremities of a ranging intrabar candles.
🔶 USAGE
The indicator highlights candles with trending intrabar prices, with uptrending candles being highlighted in green, and down-trending candles being highlighted in red.
This highlighting is affected by the selected intrabar timeframe, with a lower timeframe returning a more precise estimation of a candle trending/ranging state.
When a candle intrabar prices are ranging the body of the candle is hidden from the chart, and one upper & lower extremities are displayed, the upper extremity is equal to the candle high and the lower extremity to the candle low. Price breaking one of these extremities generates a signal.
The indicator comes with two modes, "Trend Following" and "Reversal", these modes determine the extremities that need to be broken in order to return a signal. The "Trend Following" mode as its name suggests will provide trend-following signals, while "Reversal" will aim at providing early signals suggesting a potential reversal.
🔶 DETAILS
To determine if intrabar prices are trending or ranging we calculate the r-squared of the intrabar data, if the r-squared is above 0.5 it would suggest that lower time frame prices are trending, else ranging.
This approach allows almost obtaining a "settings" free indicator, which is uncommon. The intrabar timeframe setting only controls the intrabar precision, with a timeframe significantly lower than the chart timeframe returning more intrabar data as a result, this however might not necessarily affect the displayed information by the indicator.
🔶 SETTINGS
Intrabar Timeframe: Timeframe used to retrieve the intrabar data within a chart candle. Must be lower than the user chart timeframe.
Auto: Select the intrabar timeframe automatically. This setting is more adapted to intraday charts.
Mode: Signal generation mode.
Filter Out Successive Signals: Allows removing successive signals of the same type, returning a more easily readable chart.

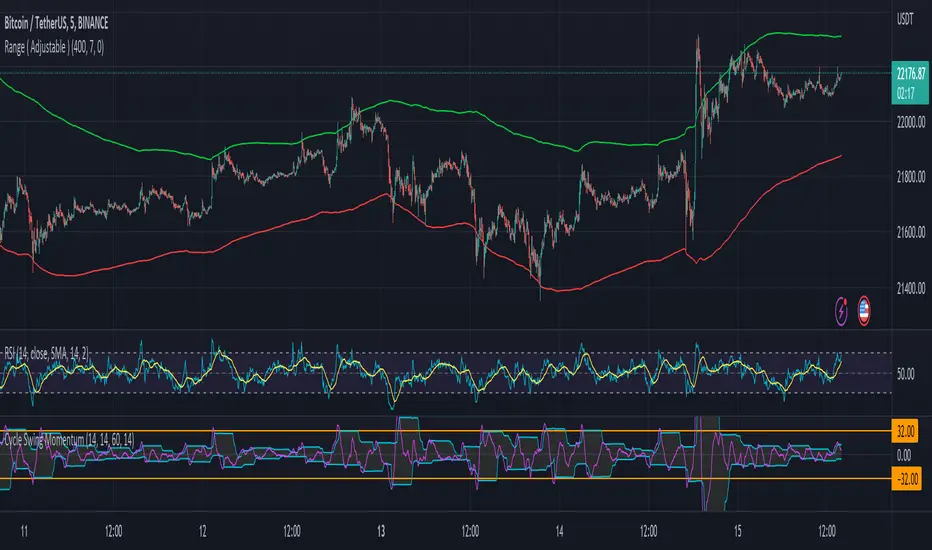
Range ( Adjustable ) HLLSfor range of the price ( Adjustable )
This indicator shows you in what price range it may move.
This indicator is adjustable. You must set your installation to the past of its chart. (depends on timeframe)
Pay attention to adapt it in different time frames and with your strategy.
The function of this indicator is simple.
Based on the first factor (the number of previous candles), you can adjust average range channel with the second factor for height of the channel.

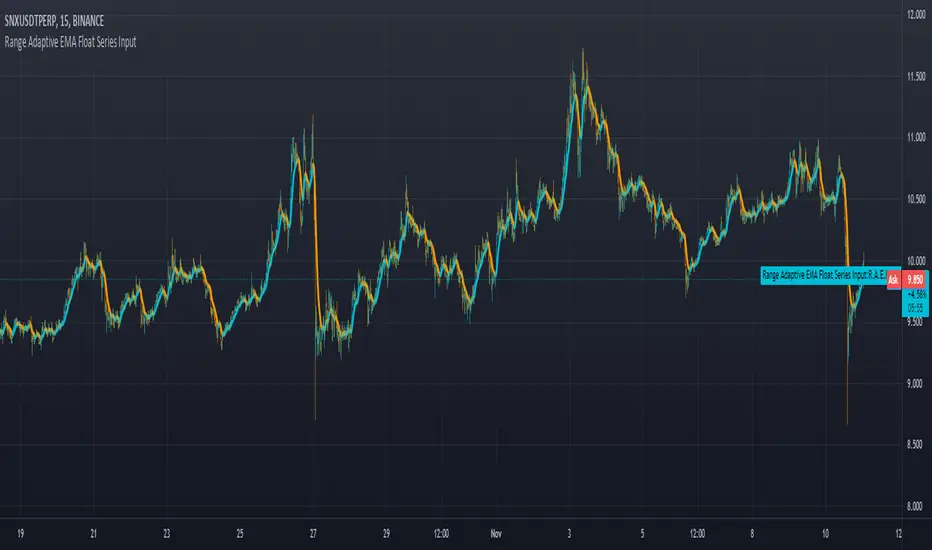
Range Adaptive EMA Float Series Inputuses range and change distance on arrays to allow for more control as well as any choice of input value as a controller for how tightly it grips the input signal.
Range BreakoutThis indicator makes easy to identify a range breakout in both the direction
Expected input is number of days that we should expect the range to be in

Range Box (Nephew_Sam_)Version 1
Creates a box around a specified time range with the ability to extend the lines to a later time.
Next update:
- Background in box
- Remove historical boxes
- Extend lines in future instead of only till current price
There's similar but complex indicators out there, I'll leave this code as open source and you have permission to reuse and not credit me.

Range ColumnsQuite simple, this plots the range of each candle (high - low). My main intention for this study is for weekly or monthly NG1! .


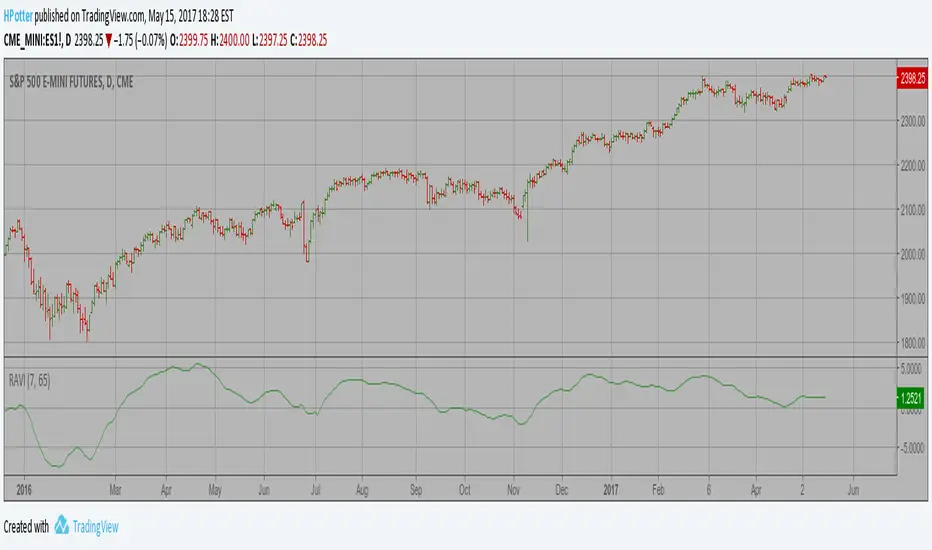
Range Action Verification Index (RAVI) The indicator represents the relative convergence/divergence of the moving
averages of the financial asset, increased a hundred times. It is based on
a different principle than the ADX. Chande suggests a 13-week SMA as the
basis for the indicator. It represents the quarterly (3 months = 65 working days)
sentiments of the market participants concerning prices. The short moving average
comprises 10% of the one and is rounded to seven.
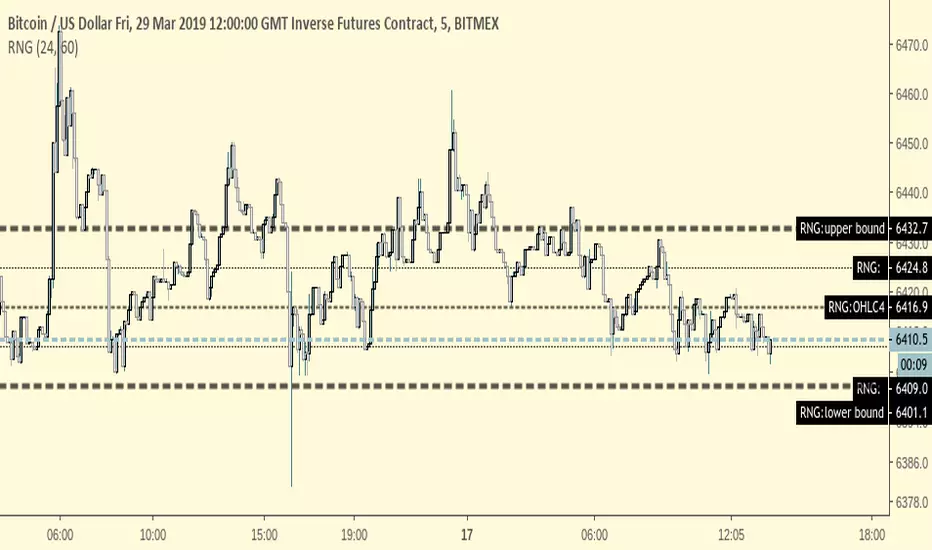
RangeRange finder -- identify a range that price is likely to trade between
Range is calculated by adding/subtracting the average variance from a previous period's OHLC4;
setting examples:
(Average Daily Variance +/- the previous hour's OHLC4)
EMA -- # of Hours: 24
OHLC4 Period(in minutes): 60
(Average 3D Variance +/- the previous half day's OHLC4)
EMA -- # of Hours: 72
OHLC4 Period(in minutes): 720
(Average Weekly Variance +/- the previous day's OHLC4)
EMA -- # of Hours: 168
OHLC4 Period(in minutes): 1440
*for 24/7 markets,
for traditional markets & forex adjust the observed times accordingly
Range Market IndicatorRange Market Indicator is designed to identify and monitor sideways (range-bound) market conditions in a stable and tradeable way.
The indicator automatically detects a price range, locks the support and resistance levels once confirmed, and keeps them fixed until a confirmed breakout occurs. This prevents constant recalculation and eliminates noisy, unreliable ranges.
Key features:
• Automatic detection of valid trading ranges
• Locked support and resistance levels
• Breakout warning and confirmed breakout detection
• Range age (number of bars)
• Support and resistance test count
• Range width percentage
• Range quality classification (Low / Medium / High)
• Visual range box and clean dashboard
The dashboard provides a clear, at-a-glance overview of whether the current market is suitable for range trading or if the range structure has broken.
This indicator does not generate buy or sell signals. It is designed to be used alongside existing strategies and indicators to support decision-making in sideways markets.
Recommended usage:
• Timeframes: 15m – 4H
• Best suited for liquid instruments (stocks, crypto, indices)
• Designed for range trading and accumulation strategies
Disclaimer:
This indicator is for educational and informational purposes only and does not constitute financial advice. Trading involves risk, and past performance does not guarantee future results. Always conduct your own analysis and risk management before making trading decisions.

Predictive Ranges [LuxAlgo]The Predictive Ranges indicator aims to efficiently predict future trading ranges in real-time, providing multiple effective support & resistance levels as well as indications of the current trend direction.
Predictive Ranges was a premium feature originally released by LuxAlgo in 2020.
The feature was discontinued & made legacy, however, due to its popularity and reproduction attempts, we deemed it necessary to release it open source to the community.
🔶 USAGE
The primary purpose of this indicator is to provide potential support & resistance levels on the chart by estimating future trading ranges.
When the price reaches one of the upper/lower levels of the Predictive Ranges we can expect the price to reverse.
If the price exits the predicted range, new levels are given in real-time & they do not repaint. Higher "Factor" values allow returning longer term and wider ranges less susceptible to be exited.
🔹 Estimating Trend Directions
Users are able to easily estimate trend directions by looking at the central levels of the predictive ranges, which represent an estimate of the price central tendency.
If this central level increases it means the price is up-trending, if it is decreasing price is down-trending.
🔶 SETTINGS
Length: ATR Length used for the indicator calculation. Higher values will tend to return ranges of equal width.
Factor: Control the ranges width. Higher values will return less frequent ranges, each having a higher width.
Timeframe: Indicator timeframe output.
Source: Input source of the indicator. It is recommended to use input sources on the same scale as the price.

Dynamic Range Filter with Trend Candlesticks (Zeiierman)█ Overview
Dynamic Range Filter with Trend Candlesticks (Zeiierman) is a volatility-responsive trend engine that adapts in real-time to market structure, offering a clean and intelligent visualization of directional bias. It blends dynamic range calculation with customizable smoothing techniques and layered trend confirmation logic, making it ideal for traders who rely on clear trend direction, structural range analysis, and momentum-based candlestick signals.
By measuring scaled volatility over configurable lengths and applying advanced moving average techniques, this indicator filters out market noise while preserving true directional intent. Complementing this, a dual-trend system (range-based and candle-based) enhances clarity and responsiveness, particularly during shifting market conditions.
█ How It Works
⚪ Scaled Volatility Band Calculation
At the core lies a volatility engine that constructs adaptive range bands around price using smoothed high/low calculations. The bands are dynamically adjusted using:
High/Low Smoothing – Applies a moving average to the raw high and low data before calculating the range.
Scaled Range Volatility – A 2.618 multiplier scales the distance between smoothed highs and lows, forming a responsive volatility envelope.
Band Multiplier – Controls how wide the upper/lower range bands extend from the mean.
This filtering process minimizes false signals and highlights only structurally meaningful moves.
⚪ Multi-Type Smoothing Engine
Users can choose from a wide array of smoothing algorithms for trend construction, including:
HMA (default), SMA, EMA, RMA
KAMA – Adapts to market volatility using efficiency ratios.
VIDYA – Momentum-sensitive smoothing using CMO logic.
FRAMA – Dynamically adjusts to fractal dimension in price.
Super Smoother – Ideal for eliminating aliasing in range signals.
This provides the trader with fine-tuned control over reactivity vs. smoothness.
⚪ Trend Detection (Dual Engine)
The indicator includes two independent trend tracking systems:
Main Trend Filter – Based on adaptive volatility band shifts.
Candle Trend Filter – A second-tier confirmation using smoothed candle data, ideal for directional candles and confirmation entries.
█ How to Use
⚪ Trend Confirmation
Use the Trend Line and colored candlesticks for high-probability entries in the trend direction. The more trend layers that align, the higher the confidence.
⚪ Reversal Zones
When the price reaches the outer bands or fails to break them, look for candle color shifts or a crossover in the range to anticipate possible reversals or consolidations.
█ Settings
Scaled Volatility Length – Controls the lookback used to stabilize the base volatility band.
MA Type & Length – Choose and fine-tune the smoothing method (HMA, EMA, KAMA, etc.)
High/Low Smoother – Pre-smoothing for structural high/low banding.
Band Multiplier – Adjusts the width of the dynamic bands.
Trend Length (Candles) – Length used for candle-based trend confirmation.
-----------------
Disclaimer
The content provided in my scripts, indicators, ideas, algorithms, and systems is for educational and informational purposes only. It does not constitute financial advice, investment recommendations, or a solicitation to buy or sell any financial instruments. I will not accept liability for any loss or damage, including without limitation any loss of profit, which may arise directly or indirectly from the use of or reliance on such information.
All investments involve risk, and the past performance of a security, industry, sector, market, financial product, trading strategy, backtest, or individual's trading does not guarantee future results or returns. Investors are fully responsible for any investment decisions they make. Such decisions should be based solely on an evaluation of their financial circumstances, investment objectives, risk tolerance, and liquidity needs.

Midnight Opening Ranges[TDL]Midnight Opening Range Indicator for TradingView
Description:
The Midnight Opening Range Indicator as taught by Micheal J. Huddleston is a powerful tool designed for traders who want to analyze price action during the critical midnight to 00:30 timeframe. This indicator highlights the opening range for both the current day and previous days, providing valuable insights into market behavior during this specific period. It also calculates and displays deviations from the opening range, as well as allows for custom opening prices to be set, making it highly adaptable to your trading strategy.
Key Features:
Today's Opening Range (00:00 - 00:30):
The indicator plots the high and low of the price range between 00:00 and 00:30 for the current day.
This range is highlighted on the chart, making it easy to identify the initial market movement and potential support/resistance levels.
Previous Days' Opening Ranges:
The indicator also displays the opening ranges for previous days, allowing you to how price reacts off of previous days ranges not just todays.
This feature helps in identifying patterns or recurring behaviors in the market in which price uses this range and previous days ranges throughout the trading day.
Deviations from the Opening Range:
The indicator calculates and plots deviations from the opening range, both above and below the high and low of the range.
These deviations can be used to identify potential breakout or reversal points, giving you an edge in anticipating market moves.
Custom Opening Prices:
The indicator allows you to set custom opening prices, which can be useful if you want to analyze the market based on a specific reference point rather than the default midnight opening.
This feature is particularly useful for traders who follow alternative trading sessions or have specific entry criteria.
Customizable Visuals:
The indicator offers customizable colors and styles for the opening range, deviations, and custom opening prices, allowing you to tailor the visual representation to your preferences.
How to Use:
Identify Key Levels: Use the highlighted opening range to identify key support and resistance levels for the day.
Monitor Deviations: Watch for price movements beyond the opening range deviations to spot potential breakouts or reversals.
Previous Range Data: Use previous days to identify areas of potential AMD.
Set Custom Prices: Adjust the custom opening price to align with your trading strategy or session preferences.
Ideal For:
Day Traders: Perfect for traders who focus on the early hours of the market to capture initial momentum.
Swing Traders: Useful for identifying key levels that could influence price action over several days.
Algorithmic Traders: Can be integrated into automated trading systems to trigger trades based on the opening range and deviations.
Conclusion:
The Midnight Opening Range Indicator is an essential tool for any trader looking to gain an edge in the market by focusing on the critical midnight to 00:30 timeframe. With its ability to highlight opening ranges, calculate deviations, and accommodate custom opening prices, this indicator provides a comprehensive view of market behavior during this pivotal period. Whether you're a day trader, swing trader, or algorithmic trader, this indicator will help you make more informed trading decisions.

Custom Range Creator + Normalized Oscillators (Obv, Rsi, Mfi) Hello Traders!
Custom Range Creator is a specialized trading tool designed for traders who incorporate range analysis into their trading strategy.
Once you set the desired number of past candles or provide a manual input, the indicator will automatically draw a range for you. This unique feature allows you to customize the range based on the highest and lowest points within a specified number of bars, known as the "Dynamic Range." Furthermore, you have the flexibility to define up to three additional ranges manually using custom inputs. The lines and labels associated with these ranges can be fully customized in terms of style, color, and width to align with your personal preferences.
Dynamic Range Capabilities:
The indicator automatically generates a range by default, identifying the highest and lowest points within the last 200 bars. However, you have the ability to define the number of bars back by adjusting the setting in the menu. Moreover you can define the range based on either the wicks or the bodies of the candles.
The range includes the following components:
☀ Range High: The highest price point within the selected number of bars in the past
☀ Range Low: The lowest price point within the selected number of bars in the past
☀ Range Mid-Point: The calculated middle value between the Range High and Range Low
☀ First Quartile (Q1): The midpoint between the Range Low and the Range Mid-Point, effectively identifying the 25% level within the range
☀ Third Quartile (Q3): The midpoint between the Range Mid-Point and the Range High, identifying the 75% level within the range
By incorporating these critical levels within a price range, our Dynamic Range provides you with a comprehensive view of how the market evolves, enabling you to make more informed trading decisions.
Manual Ranges Capabilities:
In addition to the Dynamic Range, you can manually define up to three more ranges. By specifying your desired high and low price values as inputs, the system automatically draws the range based on your inputs. Once drawn, you can further adjust the range using the bar offset option, which allows you to shift the entire range backward or forward by a specified number of bars.
Each manually defined range includes the following components:
☀ Range High: Your user-defined highest price point
☀ Range Low: Your user-defined lowest price point
☀ Range Mid-Point: The calculated middle value between the Range High and Range Low
☀ First Quartile (Q1): The midpoint between the Range Low and the Range Mid-Point, identifying the 25% level within the range
☀ Third Quartile (Q3): The midpoint between the Range Mid-Point and the Range High, identifying the 75% level within the range
This allows you to precisely define your desired price range and visually represent it on the chart. The customizable manual ranges provide you with a powerful tool for analyzing price dynamics and identifying potential support and resistance levels.
Both Dynamic Range and Manual Ranges Capabilities:
a) Timeframe-Adaptive: This indicator dynamically adjusts to your selected timeframe. Whether you are a day trader or a long-term investor, this tool adapts to meet your needs.
b) Complete Customization: You have the flexibility to customize every aspect of "Custom Range Indicator". You can modify the color, style, and width of each of the five lines to seamlessly integrate them into your chart setup. Choose from various line styles, including solid, dashed, or dotted, and select colors that suit your visual preferences. Additionally, you can customize the color and text of the labels. Additionally, you can utilize the bar offset option to fine-tune the placement of the range within your analysis.
c) Hide Lines and Labels: You have the option to hide each line or label of the range individually, or hide the entire range with labels or without labels. This customization feature allows you to focus on specific aspects of the chart and declutter the visual representation of the ranges when needed.
Normalized Oscillators
Normalization is a process applied in data handling and statistics, and in the context of trading indicators, it can be incredibly useful. Trading indicators such as Volume, the Relative Strength Index (RSI), the Money Flow Index (MFI), and On Balance Volume (OBV), often vary in their range and scale.
Normalization adjusts these values to fit within a specific range, making different indicators directly comparable and aiding in the interpretation of their relationship and impact on price action. This can offer additional insights for traders, making it easier to identify trends, patterns, and potential trading signals across different indicators.
This indicator offers a selection of three oscillators to normalize and Volume Data:
☀Volume: The amount of a particular asset that is traded within a particular period.
☀Relative Strength Index (RSI): A momentum oscillator that measures the speed and change of price movements. It is typically used to identify overbought or oversold conditions in a market.
☀Money Flow Index (MFI): A momentum indicator that uses price and volume data to identify overbought or oversold signals in an asset.
☀On Balance Volume (OBV): A technical trading momentum indicator that uses volume flow to predict changes in price. It does this by cumulatively adding volume on days when the price increases, and subtracting volume on days when the price decreases.
This script also offers aesthetic customizations for the plot, which can enhance readability and visual appeal:
✔"Plot Color": This input lets users select the color of the plotted line on the chart, allowing for personalization and better visual differentiation when multiple indicators are used.
✔"Plot Width": Users can also adjust the thickness of the plotted line, enhancing visibility based on individual preference or screen resolution.
Why is useful the Normalization?
Normalization plays a crucial role in trading as it helps bring together diverse sets of information to support more informed decision-making. For instance, observing the correlation between the price chart and oscillators like On Balance Volume (OBV) near range levels can provide valuable insights.
Consider this example using a daily (1D) Ethereum (ETH) chart:
We observe that the price is at a Range Quarter, making a higher high while the OBV makes a higher low. This scenario presents a significant degree of confluence. The price is at a critical range level and there is a bearish divergence between the OBV and the price. Such confluence often indicates a potential shift in market dynamics, and as observed, the price trends lower subsequently.
Below is the same scenario represented on a linear chart, providing a clearer visualization:
Normalization enables us to make these comparisons more accurately, ultimately leading to more reliable trading signals and better trading outcomes. By adjusting the scale of various indicators to a standard range, traders can directly compare and correlate them to price action, making it easier to spot trends, divergences, and other key market patterns.
Keep attention!
It is important to note that no trading indicator or strategy is foolproof, and there is always a risk of losses in trading. While this indicator may provide useful information for making conclusions, it should not be used as the sole basis for making trading decisions. Traders should always use proper risk management techniques and consider multiple factors when making trading decisions.

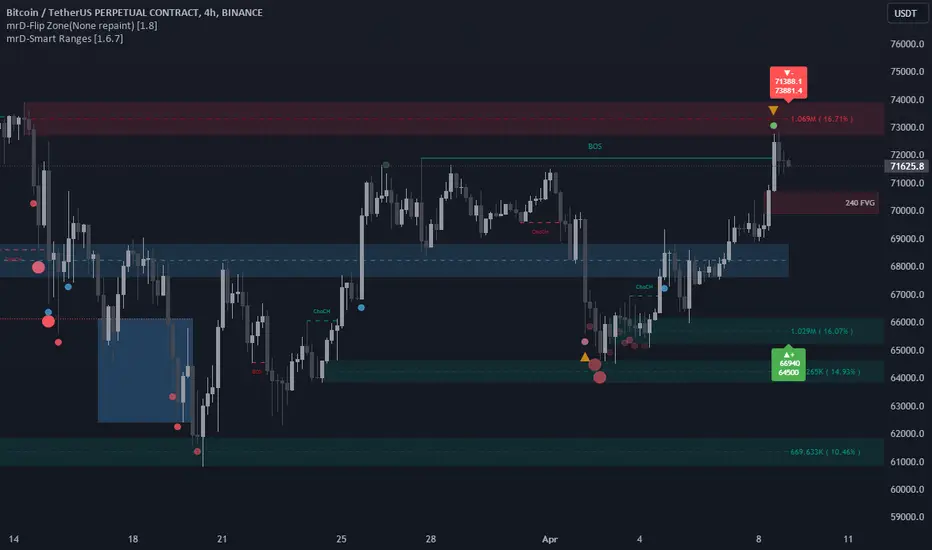
mrD-Smart RangesmrD-Smart Ranges aims to offer a complete strategy based on Order Blocks. Ranges signals based on order volume are highlighted, from which smart ranges are suggested to provide potential entries.
This script also includes warnings for each signal marked.
🔶 SETTINGS
Pair Strategy: Select the desired from the list. Change the chart to the one specified in the Strategy.
Current TF Order Blocks: Allows the user to select how many most recent Internal Order Blocks appear in the current time frame on the chart.
Order Block Filter: Allows the user to select how the script mitigates an Order Block.
Hide Overlap: Allows the user to display overlapping Order Blocks.
Show Metrics: Allows the user to display volume % metrics within the Order Blocks.
Show Volume Box: Allows the user to display buy/sell activity within Order Blocks.
High Timeframe: Allows the user to choose a higher or lower timeframe to find the Signals.
Show Failed Buy Sell: Allows the user to display the Signals.
Show HTF Box: Allows the user to display a higher or lower timeframe Order Blocks.
🔶 DETAILS
Order blocks are formed after a slight bearish order block, these can provide an opportunity to change polarity, thus acting as a potential support/resistance level.
A retest/retrace on the order block, combined with order volume between the current timeframe and from the higher timeframe will establish the conditions for smart ranges are suggested to provide potential entries.
🔶 USAGE
mrD-Smart Ranges aims to provide users with a minimalistic screen next to the optimal ranges to keep in mind to find trading setups as shown below.
Here we can see a suggested Sell range and display a label to confirm this range
Signal(s) that can be used for potential entries only during range retest are order blocks.
Users can search for more potential entry ranges based on larger timeframes in the settings: High Timeframe
In the image above, we can see that the price has generated potential orange and bearish entry signals. A confirmation signal with a red label is displayed on the chart when the price retests the Sell range.
Note: While range retests can still work well if they occur later in price action, it's best to look for signals only when price retests the range at the outset rather than retesting it. second price.
The logic of generating signal ranges using different rules is described below:
- Define order blocks in the current timeframe.
- Define the order blocks with the largest volume in the current timeframe.
- Define order blocks in larger timeframes in High Timeframe settings
- Define order blocks with the largest volume in larger timeframes in High Timeframe settings
Entry Range: The combination of the highest volume order blocks in the current timeframe and the highest volume order blocks in the larger timeframe.
🔶General disclaimer:
Trading stocks, futures, forex, options, ETFs, cryptocurrency, or any other financial instrument has huge potential rewards and risks.
You must be aware of the risks and willing to accept them to invest in stocks, futures, forex, options, ETFs, or cryptocurrencies.
Don't trade with money you can't afford to lose.
This is not an offer or an offer to Buy/Sell stocks, futures, Forex, options, ETFs, cryptocurrencies, or any other financial instrument.
Do not represent that any account will or is likely to achieve profit or loss of any kind.
The past performance of any trading system or method is not necessarily indicative of future results.
My Scripts/Indicators/Ideas/Algos/Systems are only for educational purposes!
Trend Range Detector (Zeiierman)█ Overview
Trend Range Detector (Zeiierman) is a market structure tool that identifies and tracks periods of price compression by forming adaptive range boxes based on volatility and price movement. When prices remain stable within a defined band, the script dynamically draws a range box; when prices break out of that structure, the box highlights the breakout in real-time.
By combining a volatility-based envelope with a custom weighted centerline, this tool filters out noise and isolates truly stable zones — providing a clean framework for traders who focus on accumulation, distribution, breakout anticipation, and reversion opportunities.
Whether you're range trading, spotting trend consolidations, or looking for volatility contractions before major moves, the Trend Range Detector gives you a mathematically adaptive, visually intuitive structure that maps the heartbeat of the market.
█ How It Works
⚪ Range Formation Engine
The core of this indicator revolves around two conditions:
Distance Filter: The maximum distance between all recent closes and a dynamic centerline must remain within a volatility envelope.
Volatility Envelope: Based on an ATR(2000) multiplied by a user-defined factor to account for broader market volatility trends.
If both conditions are satisfied over the most recent length bars, a range box is drawn to visually anchor the zone.
⚪ Dynamic Breakout Coloring
When price breaks out of the top or bottom of the active range box, the box color shifts in real-time:
Blue Boxes represent areas where price has remained within a defined volatility envelope over a sustained number of bars. These zones reflect stable, low-volatility periods, often associated with consolidation, equilibrium, or market indecision.
Green Boxes for bullish breakouts.
Red Boxes for bearish breakdowns.
This allows traders to visually spot transitions from consolidation to expansion phases without relying on lagging signals.
█ Why Use a Weighted Close Instead of SMA?
A standard Simple Moving Average (SMA) treats all past closes equally, which works well in theory, but not in dynamic, fast-shifting markets. In this script, we replace the traditional SMA with a speed-weighted average that reflects how aggressively the market has moved bar-to-bar.
⚪ Here's why it matters:
Bars with higher momentum (larger price differences between closes) are given more weight.
Slow, sideways candles (typical in noise or low volume) contribute less to the calculated centerline.
This method creates a more accurate snapshot of market behavior, especially during volatile phases. As a result, the indicator adapts to market conditions more effectively, helping traders identify real consolidation zones, not just average lines distorted by flat bars or noise.
█ How to Use
⚪ Range Detection
Boxes form only when price remains consistently close to the speed-weighted mean.
Helps identify sideways zones, consolidations, and low-volatility structures where price is “charging up.”
⚪ Breakout Confirmation
Once price exits the top or bottom boundary, the box immediately highlights the direction of the break.
Use this signal in conjunction with your own momentum, volume, or trend filters for higher-confidence trades.
█ Settings
Minimum Range Length: Number of candles required for a valid range to form.
Range Width Multiplier: Adjusts the envelope around the weighted average using ATR(2000).
Highlight Box Breaks: Enables real-time coloring of breakouts and breakdowns for immediate visual feedback.
-----------------
Disclaimer
The content provided in my scripts, indicators, ideas, algorithms, and systems is for educational and informational purposes only. It does not constitute financial advice, investment recommendations, or a solicitation to buy or sell any financial instruments. I will not accept liability for any loss or damage, including without limitation any loss of profit, which may arise directly or indirectly from the use of or reliance on such information.
All investments involve risk, and the past performance of a security, industry, sector, market, financial product, trading strategy, backtest, or individual's trading does not guarantee future results or returns. Investors are fully responsible for any investment decisions they make. Such decisions should be based solely on an evaluation of their financial circumstances, investment objectives, risk tolerance, and liquidity needs.
