Asteroid Belt SpaceManBTCAsteroid Belt SpaceManBTC
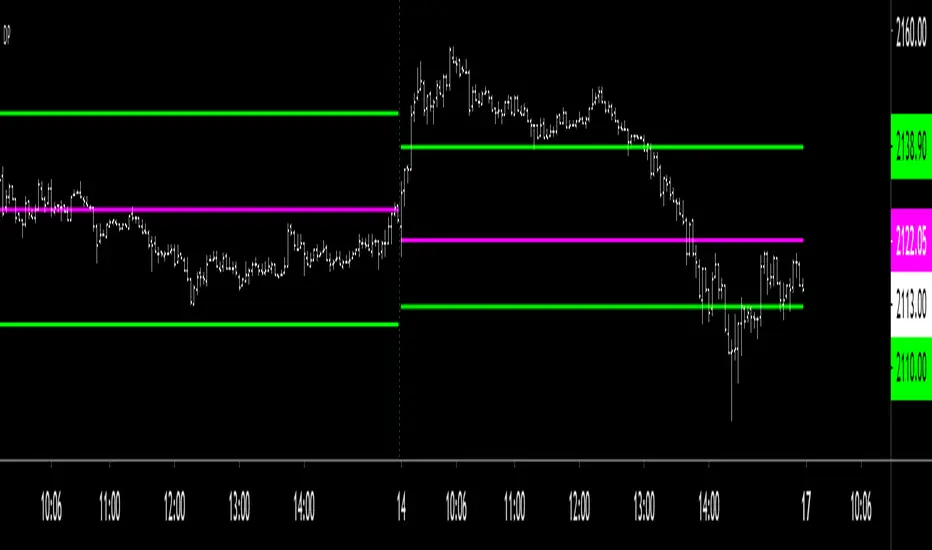
Asteroid Belt is a trend analysis tool that provides 3 areas of importance, upper, lower, and main belt. The belts provide areas
of key interest that will likely cause a reaction on any asset that is being charted.
Within The Belt
There are 2 ways to play the belt, when trending in either direction, entering the belt can be seen as an area to buy a pullback, providing a strong entry in the trend. The Upper Belt will suffice in the strongest of trends, the middle of the belt indicates a trend that is still strong. A tap of the lowest belt is a weaker trend but often the bottom of any uptrend.
The other way to play the belt from within is play the range from one belt to the other usually the lower belt to the upper belt for a full range play is successful and the mid belt should be used to take partial profits/determine the strength of the move to the other side of the belt.
Responsiveness
3 Types of responsiveness, Fast, Slow and Normal. Slow being the default as its my preffered. The Slow belt will highlight entries with higher probability of causing reaction.
Normal is the best for reliable entries with less patience, it can be recommended for those who are faster to react to directional changes.
Fast belt should only really be used on the Higher timeframe trends as their pull backs can take significantly longer and therefore provides a reliable entry for a quicker than usual high time frame execution.
Dynamic Colors
This is a simple calculation which will be advanced in the future, it can be used to determine the strength of a trend in the belt, highlighting uptrend and downtrends when enabled. Can be disabled in settings.
Auto Aggregator is the primary difference by providing its own calculations very different to how previous auto calculations have worked in spacemanbtc indicators, this aggregator is a work in progress but should produce results that can be replicated accross all coins. Doing so allows for chart by chart switching and is useful for anyone who is in need of quick trend analysis. This can be disabled for manual fine tuning. On by default for new users to learn with.
To Do:
Add outer reversion belts for a full trading system.
Improve dynamic coloring logic.
Improve Auto Aggregator logic.
Penunjuk Pine Script®