Tokyo Sessions HighlighterOverview
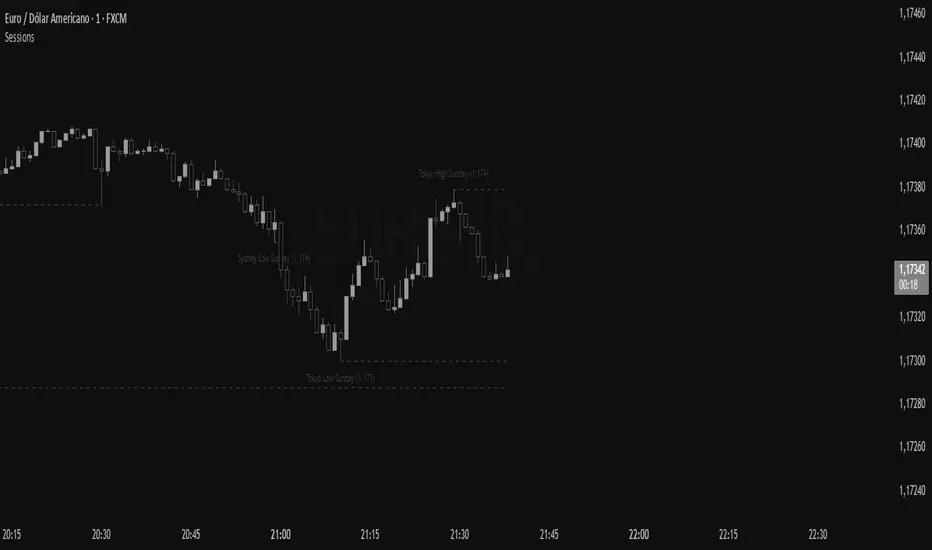
This indicator provides a clean, visual representation of the Asian (Tokyo) trading session by highlighting its specific price range. It is designed to help traders identify the initial intraday range and key liquidity levels established during the Tokyo open.
Features
Dynamic Range Box: Automatically plots a box from the session's highest high to its lowest low.
Real-Time Updates: The box height and price labels update live as new session extremes are reached during the designated hours.
Professional Aesthetic: Features a minimalist gray fill, solid black borders, and black text for a clean, professional look on both light and dark chart themes.
Instant Data: Displays a label at the bottom of the box showing the exact price range in the format: Tokyo (Lowest Value - Highest Value).
How To Use
Settings: Adjust the Tokyo Session Time and Timezone in the indicator inputs to match your broker's server time or local requirements.
Strategy: Use the highlighted range to identify potential breakouts or to treat the session high and low as institutional liquidity zones for the London and New York sessions.
Customization: You can adjust the colors and transparency of the box through the script settings menu.
Penunjuk Pine Script®