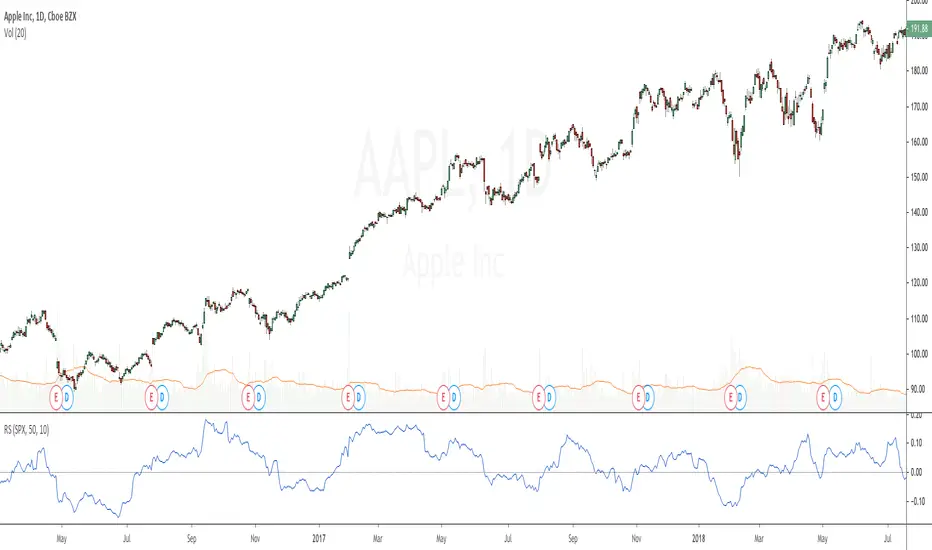
Relative strength to Index set up as per Leaf_WestRelative Strength to index as used by Leaf_West. If you follow his methods be aware of the different moving averages for the different time periods. From Leaf_West: "on my weekly and monthly R/S charts, I include a 13 EMA of the R/S (brown dash line) and an 8 SMA of the 13 EMA (pink solid line). The indicator on the bottom of the weekly/monthly charts is an 8 period momentum indicator of the R/S line. The red horizontal line is drawn at the zero line.
For daily or 130-minute time periods (or shorter), my R/S charts are slightly different - the moving averages of the R/S line include a 20EMA (brown dash line), a 50 EMA (blue dash line) and an 8 SMA of the20 EMA (pink solid line). The momentum indicator is also slightly different from the weekly/monthly charts – here I use a 12 period calculation (vs 8 SMA period for the weekly/monthly charts)." Leaf's methods do evolve and so watch for any changes to the preferred MAs etc..
Cari dalam skrip untuk "relative strength"

Relative StrengthRelative strength is a ratio between two assets, most often a stock and a market average (index). This implementation uses the method described here and the second method described here to calculate its value: "To calculate the relative strength of a particular stock, divide the percentage change over some time period by the percentage change of a particular index over the same time period". This indicator oscillates around zero. If the value is greater than zero, the investment has been relatively strong during the selected period; if the value is less than zero, the investment has been relatively weak. The period and the comparative symbol can be set in the settings for the indicator (the defaults are 50 and SPX), there you can also find an option to turn on a moving average.
Relative Strength/Weakness ArrowsHello everyone,
This Script is designed to show relative strength or relative weakness. It takes the stock your looking at and compares it to the sector it is in and to SPY. It evaluates strength or weakness on every candle. In this specific script it is only designed for the communications sector(XLC), so all the names I have inputted into the script fall within XLC. It works for all timeframes. It really helps me stay in trades longer as even though stock might be consolidating it can still be weak, making me more confident in holding. Each green arrow shows that the stock is relatively strong compared to SPY and its SECTOR, in this case, XLC. Each red arrow means that the stock is relatively weak to the market and its sector. When there are no arrows on the candles, then the stock is following the market and its sector. Tell me what yall think.
Just add it to your chart, go to any of the stocks within XLC and it will populate arrows based on relative strength and relative weakness. The weakness and strength is based on movement of price using ATR. So if the price of the stock is moving up and so is the sector it will only populate based on how large the move is. So if SPY had ATR of 1 and it moved up .50c that means the stock you're looking at would need to move more than .50c in the same candle if it also had an ATR or 1.
You can add or delete tickers in the code by going to the list of symbols and adding or removing them. Just remember that if you add a stock that doesn't fall within XLC then the arrows wont represent strength/weakness properly.

Relative Strength Index (RSI) + Realtime DivergencesRelative Strength Index (RSI) + Realtime Divergences
This version of the RSI indicator includes the following features:
- Optional divergence lines drawn directly onto the oscillator in realtime.
- Configurable alerts to notify you when divergences occur.
- Configurable lookback periods to fine tune the divergences drawn in order to suit different trading styles and timeframes.
- Background colouring option to indicate when the RSI oscillator has crossed above or below its centerline.
- Alternate timeframe feature allows you to configure the oscillator to use data from a different timeframe than the chart it is loaded on.
- Fadeout oscillator feature will fade out all but the most recent history, leaving your chart free of visual noise.
- Flip oscillator feature can be used with the Tradingview 'Flip chart' feature (Alt+i) in order to flip both the chart and the oscillator, too. This feature is to help traders manually spot divergences that may have a strong natural bias in one direction.
- Optional centerline and range bands.
- Various optional moving average types, bollinger bands etc.
This indicator adds additional features onto the standard RSI whose core calculations remain unchanged. Namely, the configurable option to automatically, quickly and clearly draw divergence lines onto the oscillator for you as they occur in realtime. It also has the addition of unique alerts, so you can be notified when divergences occur without spending all day watching the charts. Furthermore, this version of the RSI comes with configurable lookback periods, which can be configured in order to adjust the sensitivity of the divergences, in order to suit shorter or higher timeframe trading approaches.
What is the Relative Strength Index ( RSI )?
Investopedia describes the Relative Strength Index as follows:
“The relative strength index (RSI) is a momentum indicator used in technical analysis. RSI measures the speed and magnitude of a security's recent price changes to evaluate overvalued or undervalued conditions in the price of that security. The RSI is displayed as an oscillator (a line graph) on a scale of zero to 100. The indicator was developed by J. Welles Wilder Jr. and introduced in his seminal 1978 book, New Concepts in Technical Trading Systems.
The RSI can do more than point to overbought and oversold securities. It can also indicate securities that may be primed for a trend reversal or corrective pullback in price. It can signal when to buy and sell. Traditionally, an RSI reading of 70 or above indicates an overbought situation. A reading of 30 or below indicates an oversold condition.”
The RSI is also commonly used to spot divergences.
You can read more about the RSI and its calculations here
What are divergences?
Divergence is when the price of an asset is moving in the opposite direction of a technical indicator, such as an oscillator, or is moving contrary to other data. Divergence warns that the current price trend may be weakening, and in some cases may lead to the price changing direction.
There are 4 main types of divergence, which are split into 2 categories;
regular divergences and hidden divergences. Regular divergences indicate possible trend reversals, and hidden divergences indicate possible trend continuation.
Regular bullish divergence: An indication of a potential trend reversal, from the current downtrend, to an uptrend.
Regular bearish divergence: An indication of a potential trend reversal, from the current uptrend, to a downtrend.
Hidden bullish divergence: An indication of a potential uptrend continuation.
Hidden bearish divergence: An indication of a potential downtrend continuation.
How do traders use divergences in their trading?
A divergence is considered a leading indicator in technical analysis , meaning it has the ability to indicate a potential price move in the short term future.
Hidden bullish and hidden bearish divergences, which indicate a potential continuation of the current trend are sometimes considered a good place for traders to begin, since trend continuation occurs more frequently than reversals, or trend changes.
When trading regular bullish divergences and regular bearish divergences, which are indications of a trend reversal, the probability of it doing so may increase when these occur at a strong support or resistance level . A common mistake new traders make is to get into a regular divergence trade too early, assuming it will immediately reverse, but these can continue to form for some time before the trend eventually changes, by using forms of support or resistance as an added confluence, such as when price reaches a moving average, the success rate when trading these patterns may increase.
Typically, traders will manually draw lines across the swing highs and swing lows of both the price chart and the oscillator to see whether they appear to present a divergence, this indicator will draw them for you, quickly and clearly, and can notify you when they occur.
Setting alerts.
With this indicator you can set alerts to notify you when any/all of the above types of divergences occur, on any chart timeframe you choose.
Configurable pivot periods.
You can adjust the default pivot periods to suit your prefered trading style and timeframe. If you like to trade a shorter time frame, lowering the default lookback values will make the divergences drawn more sensitive to short term price action.
Disclaimer: This script includes code from the stock RSI by Tradingview as well as the Divergence for Many Indicators v4 by LonesomeTheBlue.

Relative Strength vs SPX
This indicator calculates the ratio of the current chart's price to the S&P 500 Index (SPX), providing a measure of the stock's relative strength compared to the broader market.
Key Features:
Dynamic High/Low Detection: Highlights periods when the ratio makes a new high (green) or a new low (red) based on a user-defined lookback period.
Customizable Lookback: The lookback period for detecting highs and lows can be adjusted in the settings for tailored analysis.
Visual Overlay: The ratio is plotted in a separate pane, allowing easy comparison of relative strength trends.
This tool is useful for identifying stocks outperforming or underperforming the S&P 500 over specific timeframes.

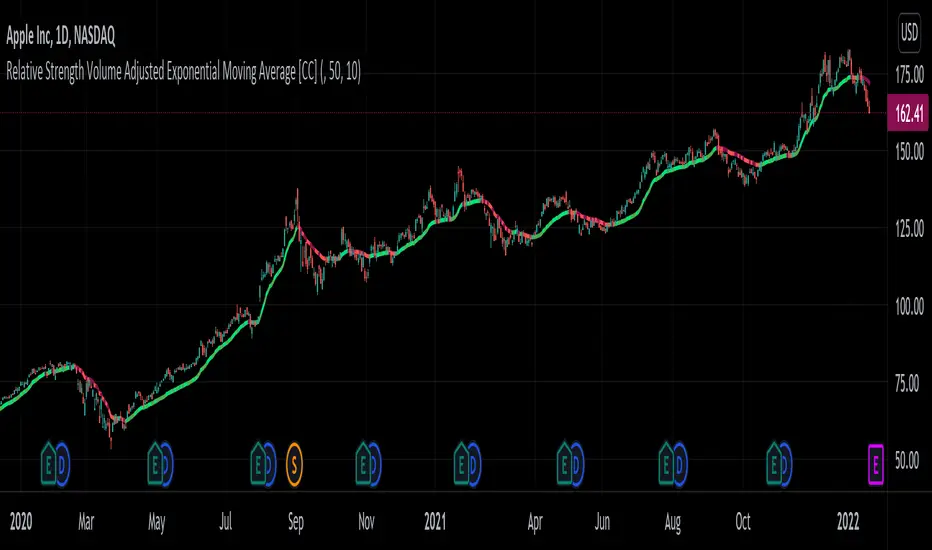
Relative Strength Volume Adjusted Exponential Moving Avg [CC]The Relative Strength Volume Adjusted Exponential Moving Average was created by Vitali Apirine (Stocks and Commodities Feb 2022 pgs 14-18) and this is very similar of course to the last Relative Strength Exponential Moving Average . It works under the same concept with using overbought and oversold methods to adjust the moving average and with this particular version you will notice that sudden drops or increases won't follow super closely so this can be useful along with the other as a good complementary indicator to use with each other to determine the short and medium term trend and to give good entry and exit points. I have strong buy and sell signals in addition to normal ones so darker colors are strong and lighter colors are normal. Buy when the indicator line turns green and sell when it turns red.
Let me know if there are any other indicators or scripts you would like to see me publish!
Relative Strength ComparisonThis script plots the ratio between a ticker and the selected index. Currently, I have US equities indexes listed + BTC. It's a great way to check for relative strength, determine if absolute highs relative to the ratio are being made, etc.
Additionally, optional comparison of the RSI is included. I was just testing something out but figured I'd leave in here because why not. If you use this, enable the 1.0 line.
Script is a bit slow, will try to optimize eventually.

Momentum of Relative strength to Index Leaf_West styleMomentum of Relative Strength to index as used by Leaf_West. This is to be used with the companion Relative Strength to Index indicator Leaf_West Style. Make sure you use the same index for comparison. If you follow his methods be aware of the different moving averages for the different time periods. From Leaf_West: "on my weekly and monthly R/S charts, I include a 13 EMA of the R/S (brown dash line) and an 8 SMA of the 13 EMA (pink solid line). The indicator on the bottom of the weekly/monthly charts is an 8 period momentum indicator of the R/S line. The red horizontal line is drawn at the zero line.
For daily or 130-minute time periods (or shorter), my R/S charts are slightly different - the moving averages of the R/S line include a 20EMA (brown dash line), a 50 EMA (blue dash line) and an 8 SMA of the20 EMA (pink solid line). The momentum indicator is also slightly different from the weekly/monthly charts – here I use a 12 period calculation (vs 8 SMA period for the weekly/monthly charts)." Leaf's methods do evolve and so watch for any changes to the preferred MAs etc..

Sector relative strength and correlation by KaschkoThis script provides a quick overview of the relative strength and correlation of the symbols in a sector by showing a line chart of the close prices on a percent scale with all symbols starting at zero at the left side of the chart. It allows a great deal of flexibility in the configuration of the sectors and symbols in it. The standard preset sectors cover the most important futures markets and their symbols.
However, up to ten sectors with up to ten symbols each can be freely configured. Each sector is defined by a single line that has the following format:
Sector name:Symbol suffix:List of comma separated symbols
For example, the first predefined sector is defined as follows.
Energies:1!:CL,HO,NG,RB
1. The name of the sector is "Energies"
2. The suffix is "1!", i.e., to each symbol in the list "1!" is appended to get the continous future for the given symbol root. When using stock, forex or other symbols, simply leave the suffix empty.
3. The list of comma separated symbols is "CL,HO,NG,RB", i.e. crude oil, heating oil, natural gas and gasoline. As the suffix is "1!", the actual symbols whose prices are shown are "CL1!","HO1!","NG1!" and "RB1!"
You can choose to use settlement-as-close and back-adjusted contracts. The sector can also be determined automatically ("Auto-select"). In this case, it is determined to which sector the symbol currently displayed in the main chart belongs and the script displays it in the context of the other symbols in the sector.
By selecting a suitable chart time frame and time range, you can quickly determine which symbols in the sector are stronger or weaker and which are more or less strongly correlated.
The following symbols are best suited for a quick trial, as the sectors are preset for these:
CL1!,ES1!,6A1!,6B1!,6c1!,6E1!,6J1!,6M1!,6N1!,6S1!,GC1!,GF1!,HE1!,HG1!,HO1!,LBR1!,LE1!,NG1!,NQ1!,PA1!,PL1!,RB1!,SI1!,YM1!,ZB1!,ZC1!,ZF1!,ZL1!,ZM1!,ZN1!,ZO1!,ZR1!,ZS1!,ZT1!,ZW1!,CC1!,CT1!,DX1!,KC1!,OJ1!,SB1!,RTY1!
You can also use the script to compare any symbols (e.g. different shares) with each other. Preferably use the "Custom" sector for this.

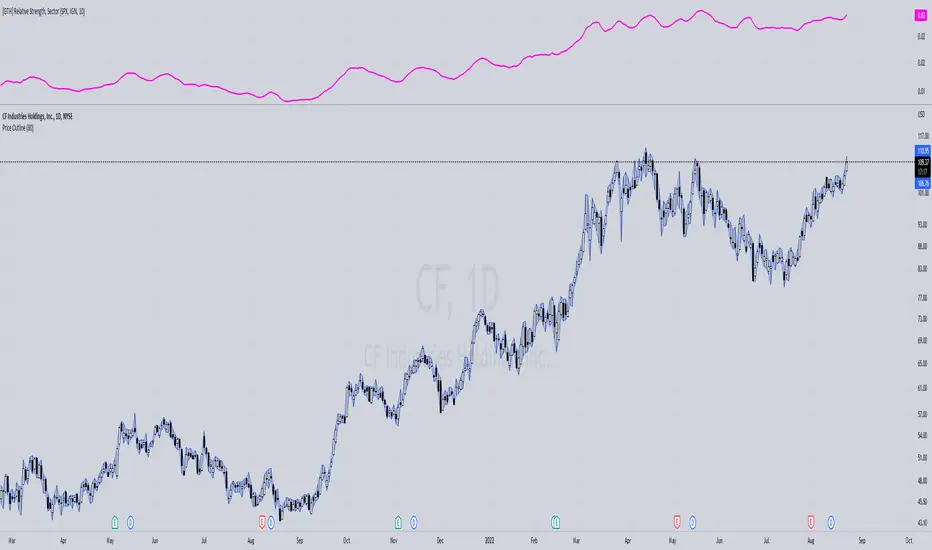
[GTH] Relative Strength, SectorsDisplays the Relative Strength (RS) of a symbol in relation to some common sector ETFs, SPX and NDX (select from drop-down list). This is done by dividing the symbol's price by the chosen sector ETF's price.
You can also select a symbol of your choice to compare against.
Interpretation:
RS line ascending: symbol performs stronger than the sector ETF.
RS line decending: symbol performs weaker than the sector ETF.
In case of error reports: please be specfic. Thanks.
Adaptive Relative Strength (ARS by Premal Parekh)Dear All,
This is my first public script modified to adapt the concept of Mr. Premal Parekh on Adaptive Relative Strength - ARS)
The original Script is developed by modhelius.
I have proved the version as per my requirement and included concept of ARS.
This script will remove the manual calculation task which is required on daily basis to calculate number of sessions from ARS Date.
Hope this script will be helpful.
If yes, do hit like button and share with your friends.
Ashish Kesarkar
India

Relative Strength vs S&P 500 (SPX/ES) Relative Strength vs S&P 500
This indicator measures the relative performance of an asset compared to the S&P 500, helping traders and investors identify whether an asset is outperforming or underperforming the broader market.
The calculation is based on a price ratio between the selected asset and the S&P 500, optionally normalized to a base value (100) for easier interpretation.
How to read it:
Above the baseline (100) → the asset is outperforming the S&P 500
Below the baseline (100) → the asset is underperforming the S&P 500
Rising line → strengthening relative performance
Falling line → weakening relative performance
Why it’s useful:
Helps focus on market leaders, not just assets that “look cheap”
Filters trades and investments in the direction of relative strength
Useful for swing trading, long-term investing, and portfolio allocation
Widely used in institutional and professional asset management
This indicator is best used as a trend and selection filter, in combination with technical setups (support/resistance, VWAP, structure).

Relative StrengthRelative strength is a calculation of the price trend of a stock or a financial instrument in comparison to another instrument, stock, or industry. It shall be determined by taking the price of one commodity and dividing it by another.
Relative strength is a strategy used for determining value stocks and is used in momentum investing as well. It involves investing in stocks that have done well, in relation to their index or benchmark. For example, a relative strength investor might pick technology companies that have outperformed the Nasdaq Composite Index or large-cap stocks that are lagging against the S&P 500 index(Adjustable in the settings).
This indiator will give you a plot for relative strength between the current pair with another pair (adjustable in the settings), with a plotshape for RSNHBP & RSNH
Features :
1. Relative Strength
2. Double EMA of Relative Strength
3. RSNHBP & RSNH
How to use it :
1. Adjust All the settings parameter
2. For Alerting, Just use any alert function call, it will give you an alert of RSNHBP and RSNH

Relative Strength Universal
Relative strength is a ratio between two assets, generally it is a stock and a market average (index). RS implementation details are explained here .
This script automatically decides benchmark index for RS calculation based on market cap input values and input benchmark indices values.
Relative strength calculation:
"To calculate the relative strength of a particular stock, divide the percentage change over some time period by the percentage change of a particular index over the same time period". This indicator value oscillates around zero. If the value is greater than zero, the investment has been relatively strong during the selected period; if the value is less than zero, the investment has been relatively weak.
In this script, You can input market cap values and all are editable fields. If company market cap value is grater than 75000(Default value) then stock value will be compared with Nifty index. If company market cap is between 75000 and 25000 then stock value will be compared with midcap 150 to calculate RS. If marketcap is greater than 5000 and less than 25000 then RS will be calculated based on smallcap250. If marketcap is less than 5000 and greater than 500 then it will be compared with NIFTY_MICROCAP250

Relative Strength vs Benchmark SPYRelative Strength vs Benchmark (SPY)
This indicator compares the performance of the charted symbol (stock or ETF) against a benchmark index — by default, SPY (S&P 500). It plots a Relative Strength (RS) ratio line (Symbol / SPY) and its EMA(50) to visualize when the asset is outperforming or underperforming the market.
Key Features
📈 RS Line (blue): Shows how the asset performs relative to SPY.
🟠 EMA(50): Smooths the RS trend to highlight sustained leadership.
🟩 Green background: Symbol is outperforming SPY (RS > EMA).
🟥 Red background: Symbol is underperforming SPY (RS < EMA).
🔔 Alerts: Automatic notifications when RS crosses above/below its EMA — signaling new leadership or weakness.
How to Use
Apply to any stock or ETF chart.
Keep benchmark = SPY, or switch to another index (e.g., QQQ, IWM, XLK).
Watch for RS crossovers and trends:
Rising RS → money flowing into the asset.
Falling RS → rotation away from the asset.
Perfect for sector rotation, ETF comparison, and momentum analysis workflows.

Relative Strength with S&P500Relative Strength (RS) - S&P500
Relative Strength with compare to SPX - US S&P 500. This indicator shows Strength compare to SPX.

Relative StrengthRelative Strength show the quotient (ratio) between a numerator (Your Security) and a common denominator (SPX, BTC, ...).
I inspired myself from already established indicators. But I've made my own because I had some issues with others.
Sometimes the moving average weren't fixed but where floating through the window.
Sometimes the colors (Up, Down) were inaccurate because the compiler didn't notice infinitesimal changes (0.0001 > 0.0002)
Thanks.
(The Relative Strength indicator is at the top of the chart.)

Relative StrengthRelative Strength Colored
This script plots Relative strength Compared to TSLA Index.
You can change it to your requirement .

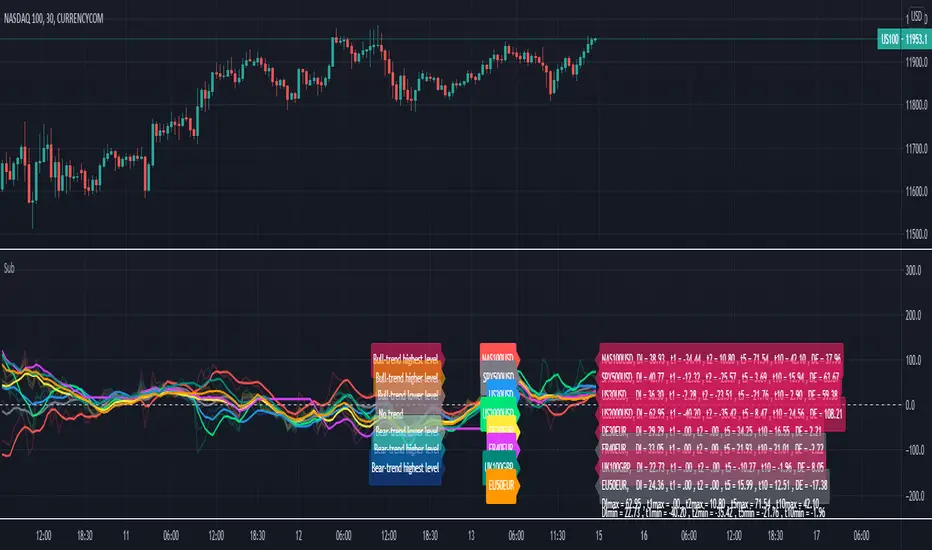
Relative Strength Index of EU and US Stock Index Trends quality//Relative Strength Index of European and US Stock Index Trends quality
//This indicator reveals the relative strength of European and US stock index futures.
//take Bull trend as an example , the current closed price>EMA20 value and the current closed price >20th previous bar closed price( deduction price),
//it's defined as a lower level bull trend .If the current price EMA20>EMA60, it's defined as a higher level bull trend .If the EMA20>EMA60>EMA120,it's defined as the highest level bull trend.
//You can choose to draw the curve with the deviation rate of the original major indexes to 20EMA, or draw the deviation rate with the average value (default value is 5 bars).
//In addition, a more technical method is added to analyze the deviation changes of the major indexes.The deviation rate changing velocity value, parameter tan (abbreviated by t) of 1, 2, 5, 10 is introduced.
//You can have the option of calculate the tan using average value of 5 candlesticks or original value.
//Taking tan1 as an example, it indicates how much the deviation rate between the current price and the previous candlestick has changed.
//The indicator of the index color and the description of the trend quality color can be switched off in option.
//In addition, this code color scheme is only suitable for black background (the code color needs to be changed by yourself if you use white background).

Relative Strength Index @ inflowjetRelative Strength Index 80/20 with extra 30/70 area and 50% dashed line

Relative Strength RankRelative Strength Rank Indicator
( ( Long Term Price Change + Short Term Price Change ) / 2 ) / 10 Day ATR

