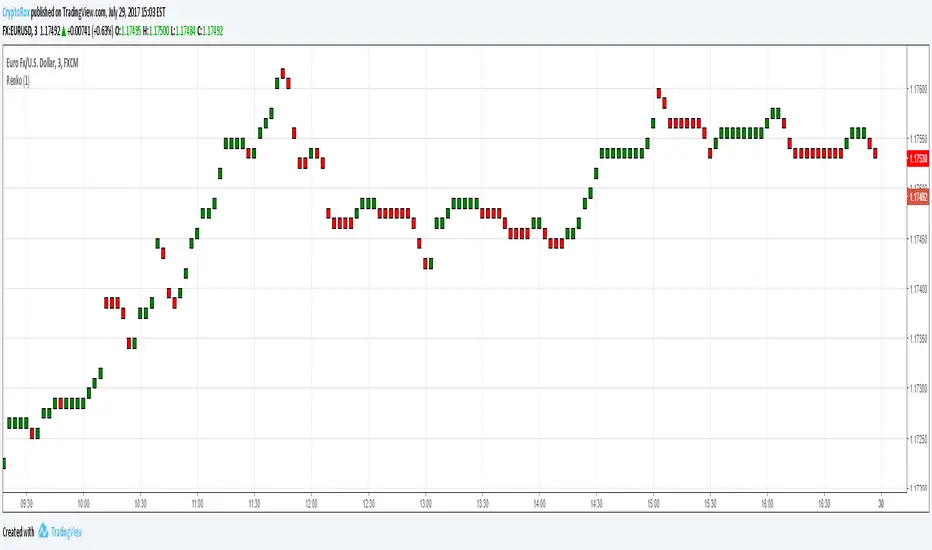
Renko CandlesticksRenko charts are awesome . They reduce noise by only painting a brick on the chart when price moves by a specified amount up/down. When the price reverses, it must go twice the specified amount before a brick is painted. Time is not a factor, just price movement. Sometimes however, you want the pros of a renko chart, but on a regular candlestick chart. This indicator attempts to do just that.
A band is placed around price action showing the upper and lower bounds of what would be the current renko brick. The band only goes up/down when the price action itself moves up/down by the amount you specify. There are several ways of specifying the amount:
Fixed Price Amount: As the name says, you enter the brick size amount, i.e. the amount the price has to move before being in a new brick.
% of Price: This method will calculate the amount the price has to move as a percentage of the price itself. This way as price goes up/down, your brick size will adjust accordingly. Recommended values would be around 1% or less.
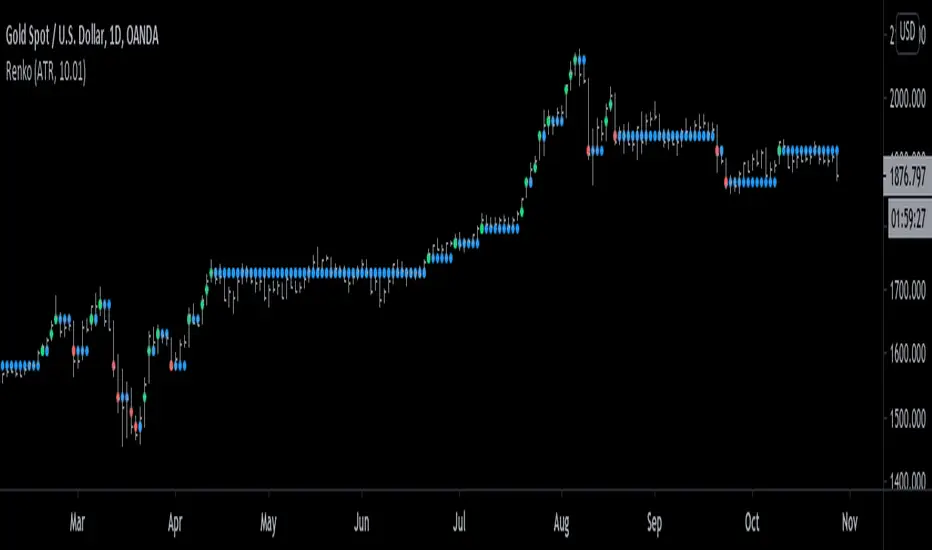
% of ATR: This option will make the brick size a percentage of the Average True Range. You can specify the ATR time frame to be different from your current time frame as well as the ATR length. For instance you could be on a 10 minute chart but specify the ATR to be daily with a length of 3 and a percentage amount of 15. This would make your brick size 15% of the Average True Range for the last 3 days. Recommended values are 10 to 20%.
Use this indicator on any time frame, even the 1 minute as the renko bands span the price action the same way on any time frame easily letting you know whether or not the price has moved appreciably, regardless of how much time has passed.
You can also set alerts easily, simply set the alert to crossing and choose “Renko Candlesticks” instead of “Value”. You will then see the options for the renko upper and lower bounds.
Tested on Bitcoin with the following values:
Fixed Price Amount: 30 ($30)
% of Price: 0.45 (if Bitcoin is $7000 then the brick size would be $31.50)
% of ATR: 15%, ATR Time Frame: 1D, ATR Length: 3 (3 days)
Cari dalam skrip untuk "renko"

Renko Level Strategy 2Renko Level Strategy
Main change of my previous strategy, that it look to one level of RENKO and use ATR value from each previous candle.
I think it is more correct than use levels that appears in first candle of new RENKO level, cause it base on current volatility, but not on volatility that was many candles ago.

[RS]Renko Overlay V0Renko Overlay:
tf: Timeframe to use.
mode: ATR or Traditional .
modeValue: can be whole number for ATR mode (ex:.15) or floating point value for Traditional (ex:.0.12345) .
showOverlay: Display renko bars.
showBarColors: Display Bar Colors.
showMa: display Renko based ma.
MA_length: moving average length.
note: should use with scale series only toggled on, so it doesnt strech.

Renko AccelerationRenko is a very useful charting method for analyzing stock movement. It does a great job of filtering out all the excess noise so that all we're left with is pure price action. But, what about time? Time is a fundamental part of chart analysis and we are only seeing part of the picture. After all, shouldn't we take a very different approach to trading signals from a block that renders in 2 seconds as opposed to a block that renders in 30 minutes?
This indicator provides the best of both worlds, enabling us to correlate the passing of time with price movement and clearly see when squeezes and breakouts occur.
As the indicator turns up to green we can see that volatility is on the move and the market is accelerating (breakout), and as it turns down to red the market is stagnating (squeeze). There is also an alternate 'Precise' view which renders the exact time per block for more granular analysis.

Renko Strategy with Ema against price crossover/underRenko Strategy with Ema against price crossover/under
RenkoNow you can plot a "Renko" chart on any timeframe for free! As with my previous algorithm, you can plot the "Linear Break" chart on any timeframe for free!
I again decided to help TradingView programmers and wrote code that converts a standard candles / bars to a "Renko" chart. The built-in renko() and security() functions for constructing a "Renko" chart are working wrong. Do not try to write strategies based on the built-in renko() function! The developers write in the manual: "Please note that you cannot plot Renko bricks from Pine script exactly as they look. You can only get a series of numbers similar to OHLC values for Renko bars and use them in your algorithms". However, it is possible to build a "Renko" chart exactly like the "Renko" chart built into TradingView. Personally, I had enough Pine Script functionality.
For a complete understanding of how such a chart is built, you can read to Steve Nison's book "BEYOND JAPANESE CANDLES" and see the instructions for creating a "Renko" chart:
Rule 1: one white brick (or series) is built when the price rises above the base price by a fixed threshold value or more.
Rule 2: one black brick (or series) is built when the price falls below the base price by a fixed threshold or more.
Rule 3: if the rise or fall of the price is less than the minimum fixed value, then new bricks are not drawn.
Rule 4: if today's closing price is higher than the maximum of the last brick (white or black) by a threshold or more, move to the column to the right and build one or more white bricks of equal height. A new brick begins with the maximum of the previous brick.
Rule 5: if today's closing price is below the minimum of the last brick (white or black) by a threshold or more, move to the column to the right and build one or more black bricks of equal height. A new brick begins with the minimum of the previous brick.
Rule 6: if the price is below the maximum or above the minimum, then new bricks are not drawn on the chart.
So my algorithm can to plot Traditional Renko with a fixed box size. I want to note that such a "Renko" chart is slightly different from the "Renko" chart built into TradingView, because as a base price I use (by default) close of first candle. How the developers of TradingView calculate the base price I don’t know. Personally, I do as written in the book of Steve Neeson.
The algorithm is very complicated and I do not want to explain it in detail. I will explain very briefly. The first part of the get_renko () function — // creating lists — creates two lists that record how many green bricks should be and how many red bricks. The second part of the get_renko () function — // creating open and close series — creates open and close series to plot bricks. So, this is a white box - study it!
As you understand, one green candle can create a condition under which it will be necessary to plot, for example, 10 green bricks. So the smaller the box size you make, the smaller the portion of the chart you will see.
I stuffed all the logic into a wrapper in the form of the get_renko() function, which returns a tuple of OHLC values. And these series with the help of the plotcandle() annotation can be converted to the "Renko" chart. I also want to note that with a large number of candles on the chart, outrages about the buffer size uncertainty are heard from the TradingView blackbox. Because of it, in the annotation study() set the value of the max_bars_back parameter.
In general, use this script (for example, to write strategies)!

Renko + CandlesThis indicator has been designed to show you both candle chart and Renko chart in one place.
I think most of you are familiar with candle chart which is working with the time and price movements but Renko chart is based on price differences and is not related to the "time" parameter.
so if you see a Renko brick is appear up(or down) to the previous brick it means that a certain and fixed price movement has been occurred (which mostly calculate by ATR). and also this indicator works in any time frame.
Remember because we want both charts we have time parameter in this indicator, and if the price doesn't move up or down a certain percentage from previous bars, it will plot a renko bar beside the previous one.
you can use this indicator to see if the price moves up or down.
Or you can determine the important support and resistances with much less noises.
it can be used as a confirmation for you to keep your positions or exit.
go ahead and discover it...
If you have any questions, don't hesitate! ask in the comments section below.

Renko Candles & Trend System [racer8]Brief:
Renko Candles & Trend System (RCTS) allows traders to have a renko chart alongside their main chart.
This is an off-chart version of my previous indicator called "Renko Dots" with an extra component (SMA).
A true masterpiece, I'm very proud of it. I put a lot of work into it 😝
RCTS has 3 parameters:
Renko Method - Traditional or ATR. These are 2 different ways to calculate Renko.
Renko Length - Length controls traditional Renko bar's fixed price range or controls the ATR period.
SMA Length - Simple moving average of all Renko values.
Signals:
Renko can be either green candle (bullish), red candle (bearish), or dots (neutral).
When Renko is above sma, go long.
When Renko is below sma, go short.
Fire icon (🔥) indicates that Renko crossed sma.
You may change this icon to pretty much any icon you like by copying & pasting any emoji/icon off the internet into the emoji parameter.
Here's a link to save you time: getemoji.com
Or here's a quick list of some icons to copy & paste into the emoji parameter:
Smileys 😄️ 😉 🥰 😝 😎
Gestures 👌 ✌️ 🤟 👍 👊 🙏
Animals 🐱 🦊 🐻 🐼 🐮 🐷
Other 😈 👺 🤡 💀 👽 🤖 🎃 ❤️ 💛 💙
***(This is a hand-picked list I made including only my favorites)
What is a Renko chart?
A Renko chart is a special chart that modifies a regular price chart's information about the close price and transforms it into Renko values that are plotted as Renko boxes on a chart. These boxes typically have a fixed range, say 10 pips for example. Or 1 ATR.
For more information on Renko charts : www.investopedia.com
Just for fun, I've included the following features:
- A heart emoji in the short title (💙)
- A heart made out of @s in the script's code
- A nice quote in the script's code
Have fun.
Hit the like button!
Stay safe.
Enjoy and happy halloween guys & girls 😉

Renko Candles OverlayHello All,
For long time I got many request for Renko Candles and now here it's, Renko Candles Overlay . I tried to make almost everything optional, so you can play with the options as you want.
Let see the options:
Method: the option for brick scaling method: ATR, ATR/2, ATR/4, Percent, Traditional
- ATR Period: period for Average True Range and it's valid if the method is ATR
- ATR/2 Period: period for Average True Range and it's valid if the method is ATR/2
- ATR/4 Period: period for Average True Range and it's valid if the method is ATR/4
- Traditional: User-defined brick size, it's valid if the method is Traditional
- Percent: Percent of Close price, it's valid if the method is Percent
if the method is not Traditional (fixed brick size) then Brick size is calculated/updated when new bricks added. so The box sizes may be different because of the calculation is dynamic.
Levels & Lines for new Bricks: if you enable this option then the script shows the levels for new brick
Change Bar Color: optionally the script changes the bar color by using direction of the bricks
and some other options for coloring.
The script shows the bricks for visible area, which is approximately 280 candles. so if you change the width and number of the bricks then number of bricks that is shown is adjusted automatically to fit the screen. you can see the examples below:
The script shows the levels to new brick as a line and label:
Because of real-time bar is not confirmed until the candle close, the script shows the bricks as Unconfirmed , and unconfirmed bricks shown in different color:
You can change the width of the bricks (width is 10 in following example):
Optionally candle colors are changde by the direction of the bricks:
If you have any recommendation then please drop a comment under the script ;)
Enjoy!

Renko Simple OverlaySimple Renko Overlay that attempts to deal with the delay present in the Renko function while still using brick size from the Renko function.

Renko CandlesThis is a script to place Renko candles on your chart alongside another candle type or more importantly, using the variables from this script, you can build a strategy using Renko candles that will depict true/proper entries and exits in a strategy when using the backtest feature.
We hope this helps!
Renko Dots [racer8]Description:
The idea behind this indicator is to have the Renko chart alongside with your main chart. What this indicator does is that it plots the values from the Renko Chart directly onto your main chart. So, you don't have to switch between Renko and OHLC charts anymore!
Parameters:
Renko Dots has to 2 parameters: Method & Length.
Method can be either Traditional or ATR. These are 2 different styles of Renko. Personally, I prefer ATR.
Length controls traditional Renko bar's fixed price range or controls the ATR period.
Signal Interpretation:
These Renko values are plotted as "Renko Dots" on your chart. The dots can be either green, red, or blue depending on market movements.
Green - new Renko bar (bullish)
Red - new Renko bar (bearish)
Blue - no new Renko bar (consolidation)
What is a Renko chart?
A Renko chart is a special chart that modifies a regular price chart's information about the close price and transforms it into Renko values that are plotted as Renko boxes on a chart. These boxes typically have a fixed range, say 10 pips for example. So if price moves at least 10 pips, a box is formed. Alternatively, the box's range can be set to the ATR....so in this case, each box represents a move of 1 ATR.
For more information on Renko charts, visit Investopedia.com, here's the link: www.investopedia.com
Renko Dots' advantages over standard Renko chart:
- Can compare & apply it to other price charts (ohlc, candlesticks, line charts)
- Can apply it to other modified price charts (Heikin-Ashi, Renko, Line-Break)
- Can use it to trade alongside with the main chart
- Works across all instruments/markets and all time frames
- Plots consolidation (blue dots) ... (standard Renko doesn't consider time)
Enjoy :)
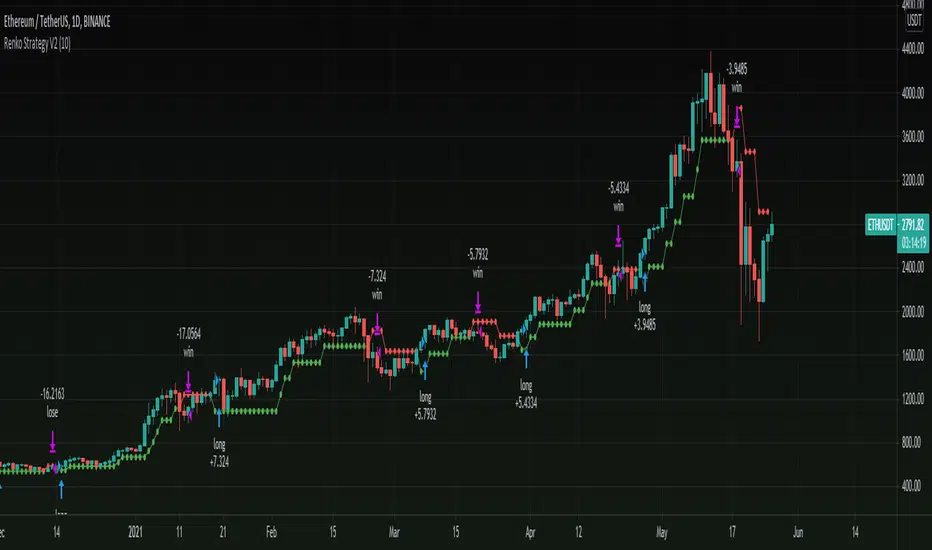
Renko Strategy V2Version 2.0 of my previous renko strategy using Renko calculations, this time without using Tilson T3 and without using security for renko calculations to remove repaint!
Seems to work nicely on cryptocurrencies on higher time frames.
== Description ==
Strategy gets Renko values and uses renko close and open to trigger signals.
Base on these results the strategy triggers a long and short orders, where green is uptrending and red is downtrending.
This Renko version is based on ATR, you can Set ATR (in settings) to adjust it.
== Notes ==
Supports alerts.
Supports backtesting time ranges.
Shorts are disabled by default (can be enabled in settings).
Link to previous Renko strategy V1:
Stay tuned for version V3 in the future as i have an in progress prototype, Follow to get updated:
www.tradingview.com
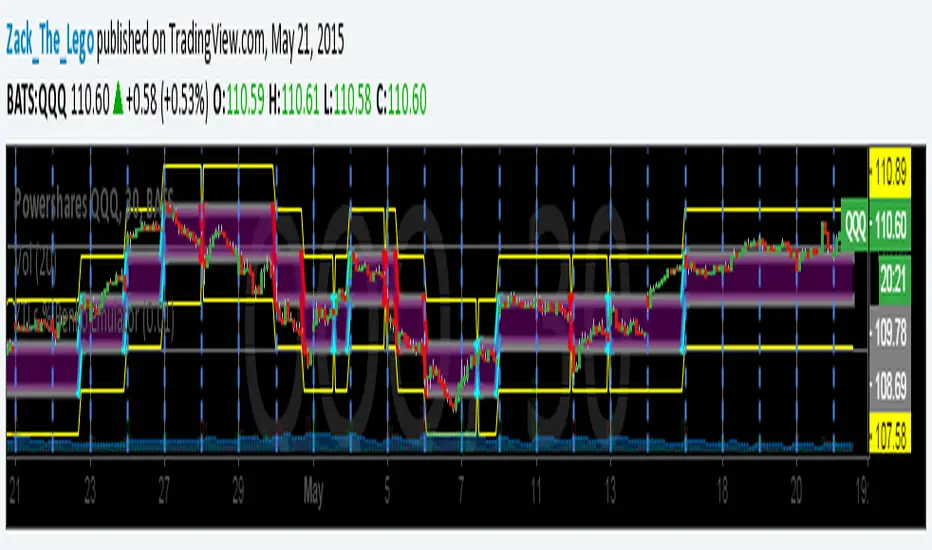
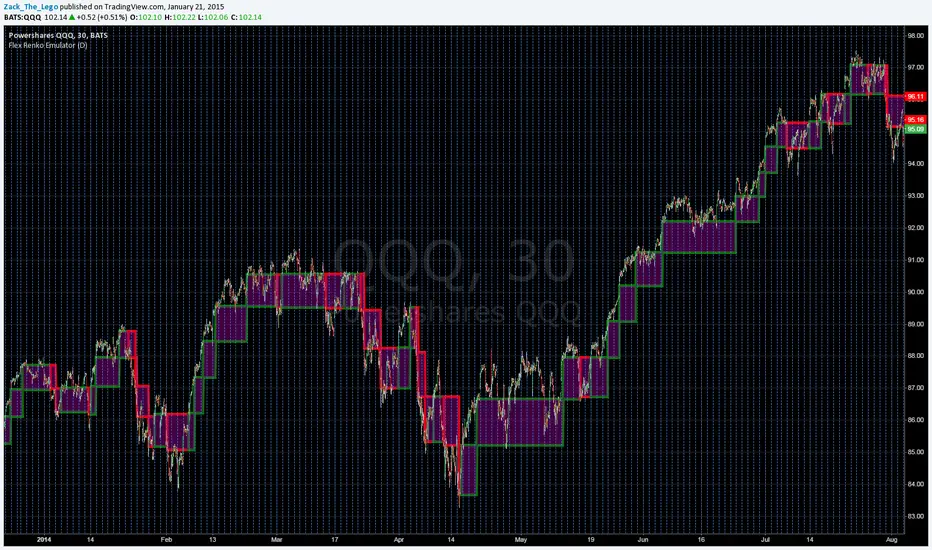
ZTLs Percentage-based Renko EmulatorHere is another version of my Flex Renko script. It is uses percentage-based brick sizes to draw the Renkos instead of ATR or static brick sizes. What makes the percentage-based drawing style great is that one doesn't need to adjust stops so many times like they would with a ATR based Renko. It also makes moving between tickers smooth as well as one doesn't have to adjust the brick-size for each name.
to use: By default the setting is ".001" or 10 basis points. So ".01" is 1 percent or 100 basis points and so-forth. This style is perfect for those traders who make trades on a percentage basis over a price-level basis. It's also good for percentage-based stops.
The yellow lines represent where the price needs to go to draw another Renko brick.
Renko RSIThis is live and non-repainting Renko RSI tool. The tool has it’s own engine and not using integrated function of Trading View.
Renko charts ignore time and focus solely on price changes that meet a minimum requirement. Time is not a factor on Renko chart but as you can see with this script Renko RSI created on time chart.
Renko chart provide several advantages, some of them are filtering insignificant price movements and noise, focusing on important price movements and making support/resistance levels much easier to identify.
As source Closing price or High/Low can be used.
Traditional or ATR can be used for scaling. If ATR is chosen then there is rounding algorithm according to mintick value of the security. For example if mintick value is 0.001 and brick size (ATR/Percentage) is 0.00124 then box size becomes 0.001. And also while using dynamic brick size (ATR), box size changes only when Renko closing price changed.
Renko RSI is calculated by own Renko RSI algorithm.
Alerts added:
Renko RSI moved below Overbought level
Renko RSI moved above Overbought level
Renko RSI moved below Oversold level
Renko RSI moved above Oversold level
RSI length is 2 by default, you can set as you wish.
You better to use this script with the following one:
Enjoy!

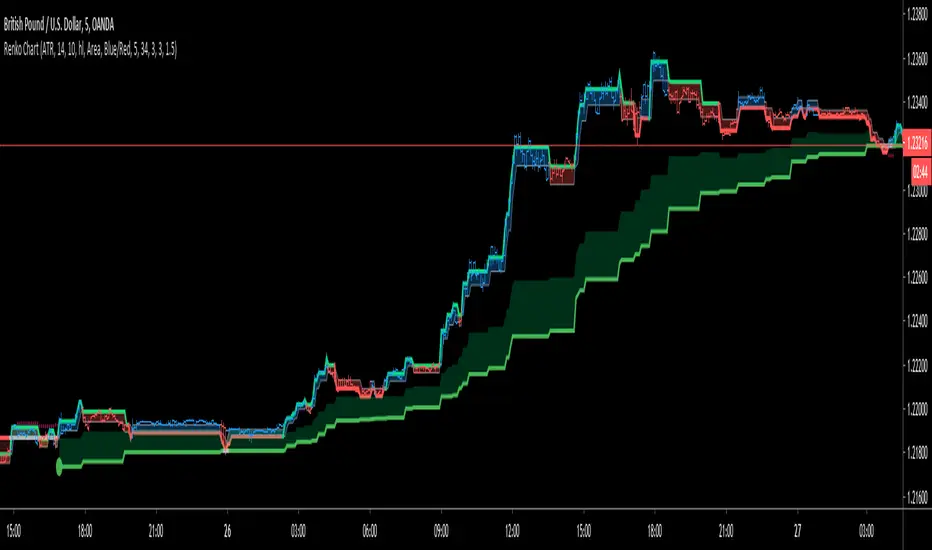
Renko ChartHello All. This is live and non-repainting Renko Charting tool. The tool has it’s own engine and not using integrated function of Trading View.
Renko charts ignore time and focus solely on price changes that meet a minimum requirement. Time is not a factor on Renko chart but as you can see with this script Renko chart created on time chart.
Renko chart provide several advantages, some of them are filtering insignificant price movements and noise, focusing on important price movements and making support/resistance levels much easier to identify.
in the script Renko Trend Line with threshold area is included. and also there is protection from whipsaws, so you can catch big waves with very good entry points. Trend line is calculated by EMA of Renko closing price.
As source Closing price or High/Low can be used. Traditional or ATR can be used for scaling. If ATR is chosen then there is rounding algorithm according to mintick value of the security. For example if mintick value is 0.001 and brick size (ATR/Percentage) is 0.00124 then box size becomes 0.001. And also while using dynamic brick size (ATR), box size changes only when Renko closing price changed.
Renko bar can be seen as area or candle and also optionally bar color changes when Renko trend changed.
Soon other Renko scripts (Renko RSI, Renko Weis Wave, Renko MACD etc) are coming ;)
ENJOY!
Renko Weis Wave VolumeThis is live and non-repainting Renko Weis Wave Volume tool. The tool has it’s own engine and not using integrated function of Trading View.
Renko charts ignore time and focus solely on price changes that meet a minimum requirement. Time is not a factor on Renko chart but as you can see with this script Renko RSI created on time chart.
Renko chart provide several advantages, some of them are filtering insignificant price movements and noise, focusing on important price movements and making support/resistance levels much easier to identify.
As source Closing price or High/Low can be used.
Traditional or ATR can be used for scaling. If ATR is chosen then there is rounding algorithm according to mintick value of the security. For example if mintick value is 0.001 and brick size (ATR/Percentage) is 0.00124 then box size becomes 0.001. And also while using dynamic brick size (ATR), box size changes only when Renko closing price changed.
This tool is based on the Weis Wave described by David H. Weis (a Wyckoff specialist). The Weis Waves Indicator sums up volumes in each wave. This is how we receive a bar chart of cumulative volumes of alternating waves and The cumulative volume makes the Weis wave charts unique.
If there is no volume information for the security then this tool has an option to use “True Range” instead of volume .
Better to use this script with the following one:
Enjoy!

Renko Price Bars Overlay// Shows the price renko bars (or range bars) instead of the PERIOD renko
// bars that are integrated into Trading View. The normal renko bars that
// Trading View offers only consider the drawing of a new brick when the
// price closes above or below the required brick size. This can produce
// misleading charts since depending on the time interval of a chart, new
// bricks may or may not be drawn. True price renko bars will draw a new
// brick immediately upon the price exceeding the next target brick size.
// When running this script in "Traditional" mode, the painting of the
// brick overlay band is INDEPENDENT of the chart interval. If price
// exceeds the required target price for the next brick, the band is
// updated immediately, instead of waiting for the price bar on the chart
// interval to close first. The brick starting anchor point will attempt
// to be a "nice number" at a round interval for the chart ticker. For
// example, if viewing EURUSD with the box size equal to 50 ticks/pips,
// the open and close prices will take the form of 1.2100, 1.2150, 1.2200,
// 1.2250, and so on. This is the same behavior as the normal traditional
// Renko bars in Trading View and other major trading platforms such as
// Meta Trader.
// Use the tick size in traditional mode to specify the block size, in
// ticks. This may give interesting results in FOREX pairs... as the tick
// size in Trading View may be 0.00001 instead of the normal pip size of
// 0.0001, so a 10 pip block size may be '100', and not the expected '10'.
// FOREX futures should work in the manner expected, a 10 pip block size
// will indeed equal 0.0010.
// The "ATR" mode functions differently than the Trading View built in
// version. The block size is updated each time the range is exceeded.
// In Trading View, when using the ATR mode, the ATR is the last ATR
// value calculated on the ENTIRE data interval, and is applied to all
// past data. You can see this when you press the '+' sign of the ticker
// in the top left of the chart window and you will see the brick size
// as a constant, the brick size is not a function of the ever changing
// ATR value of the price action. The block size of this script is not
// updated for each price candle (i.e. each 1HR on a 1HR chart), instead
// it is updated only when the price thresholds are exceeded requiring a
// the band to be updated. At that point the current ATR is considered
// and the brick size is updated.
// Options exist to show the current high and low of the brick, and to
// show the required levels that the price must exceed to draw a new
// brick and update the band.
Please leave comments if you notice any bugs or would like any new features added. I don't find much use for plotting the H/L of the current renko candle, but I have seen some request it in the past.
Cheers.

Flex Renko Emulatorupdate:
As far as my algorithm design will take me this is it. So It's complete in my eyes. Here is a "working" version of something I've been looking for for a long time: "Flex" Renko Charting.
Bricks' sizes are determined by ATR and are set by simply choosing a resolution for the ATR calculation. No need to go in and choose renko granulation(resolution) AND brick size. Renko granulation is current chart resolution. Feel free to send me feedback on how to manage the reversal bricks' calculation or any other thoughts and ideas.
Replace the "close" in the main body of the renko calculation with 'high' and 'low' to get more consistent paintings across different aggregations since renkos aren't technically based off closing prices but where the price has been. Of course it's all a matter of preference:
Brick1 = high >
nz(Brick1) + BrickSize ? nz(Brick1) + BrickSize : low <
nz(Brick1) - BrickSize ?
nz(Brick1) - BrickSize
: nz(Brick1)
Renko Chart Alerts with PivotsAdd alerts to renko charts to be notified when:
new brick
brick up
brick down
direction change
direction change up
direction change down
Also shows pivots based on brick reversals. Alerts also available for:
pivot breakout
pivot high breakout
pivot low breakout
You can hide the plots for pivot high/low and breakouts in the style tab of the settings for the indicator.
To add the alerts:
add the indicator to your renko chart
click add alert
click the condition dropdown and choose Renko Alerts
you should see all the alerts there and you can add any one or more to your chart

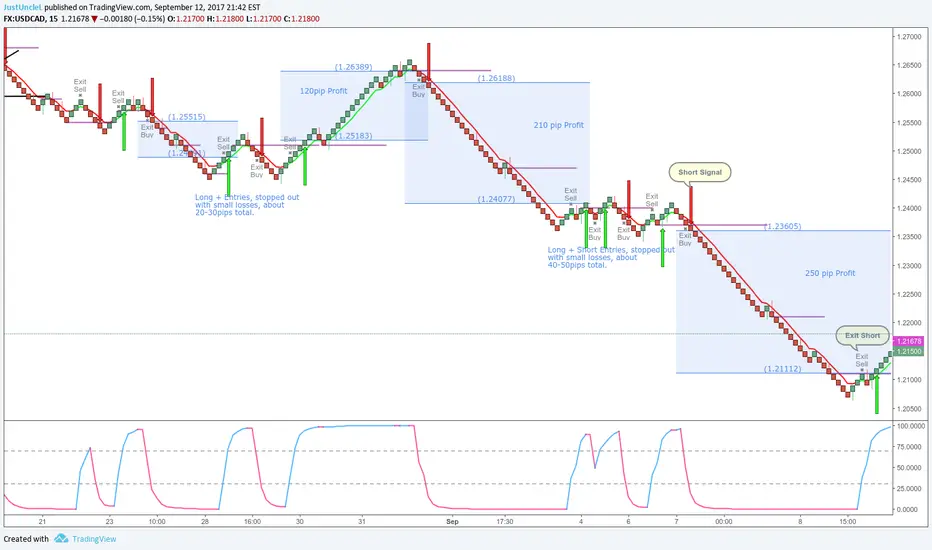
Renko+Moving Average+RMI Alert R3 by JustUncleLThis script idea is designed to be used with 10pip brick (recommended) Renko charts. It combines the Renko price action with a directional coloured EMA (default length 6) and a RMI (instead of the usual RSI) indicator to provide entry and exit signals. RMI is bit like RSI with a built-in momentum factor and works well with Renko.
Signals can optionally be filtered by Daily or Weekly Open, where by only trade long above open and short below open (this option is enabled by default). Exit occur when EMA or RMI reverses direction, or optionally (disabled by default) when the Renko prints a brick in the reverse direction. Each Entry and Exit signal creates an Alertcondition that can be picked up by the TradingView Alarm system.
TIP: To get 10pip Bricks set Renko to "Traditional" type bricks and 0.001 for non-JPY currency pairs, and 0.1 for JPY currency pairs. Also set chart Time frame to 5min or 15mins.
References:
TheLark Relative Momentum Index (RMI)