Retest Support Resistance Signals [ChartPrime]The Retest Support Resistance Signals Indicator is a powerful tool designed to assist traders in identifying key support and resistance levels within the market. Most importantly and uniquely it identifies retests of these structures and displays them on the trader's chart. By utilizing a combination of pivot points and price action analysis, this indicator offers valuable insights for both signal-based and support/resistance trading strategies.
Key Features & settings:
Retest Confirmation: The indicator waits for a break above a support or resistance level and observes subsequent price action. If price retraces and forms a wick below the level, followed by a bounce, the indicator identifies it as a retest and labels it as "R" to indicate potential support or resistance confirmation.
This indicator combines the benefits of signal-based trading and support/resistance analysis, providing users with a versatile trading tool suitable for various strategies.
Retest Weaker Toggle: Users have the option to enable or disable the retest weaker feature. When enabled, the indicator considers a support or resistance level weaker if it experiences a test. When disabled, the indicator assumes that a bounce may occur from the level.
Pivot Detection Customization: Users can adjust the pivot detection method based on either wicks or bodies. This flexibility allows traders to adapt the indicator to different market conditions and preferences. The trader can also customize the number of bars used for pivot detection on both the left and right sides. This feature enables traders to fine-tune the indicator's sensitivity and responsiveness.
Users also have control over how support or resistance levels are managed on the chart. They can choose to either stop updating the levels (freeze) or completely remove them (delete) from the chart.
Breakout Threshold Setting: Traders can adjust the breakout threshold until deletion setting. This setting determines the number of successful breakouts through a support or resistance level required to remove it from the chart. This feature helps filter out weaker levels and focus on more significant ones.
Shown above we see the retest labels in action denoted with an R label
This indicator can be a useful addition to an SR trader's toolkit. Identifying when a level in the market is retested can reveal interesting information about the underlying strength of a trend. This indicator has been designed with the two major schools of thought; a level gets weaker the more it's tested vs stronger the more it's tested. We have designed this therefore to be versatile and adapt to both thought procceses. The R labels should be taken and considered as a larger part of an analysis process and not followed blindly.
Cari dalam skrip untuk "retest"

Breaks and Retests - Free990Strategy Description: "Breaks and Retests - Free990"
The "Breaks and Retests - Free990" strategy is based on identifying breakout and retest opportunities for potential entries in both long and short trades. The idea is to detect price breakouts above resistance levels or below support levels, and subsequently identify retests that confirm the breakout levels. The strategy offers an automated approach to enter trades after a breakout followed by a retest, which serves as a confirmation of trend continuation.
Key Components:
Support and Resistance Detection:
The strategy calculates pivot levels based on historical price movements to define support and resistance areas. A lookback range is used to determine these key levels.
Breakouts and Retests:
The system identifies when a breakout occurs above a resistance level or below a support level.
It then waits for a retest of the previously broken level as confirmation, which is often a better entry opportunity.
Trade Direction Selection:
Users can choose between "Long Only," "Short Only," or "Both" directions for trading based on their market view.
Stop Loss and Trailing Stop:
An initial stop loss is placed at a defined percentage away from the entry.
The trailing stop loss is activated after the position gains a specified percentage in profit.
Long Entry:
A long entry is triggered if the price breaks above a resistance level and subsequently retests that level successfully.
The entry condition checks if the breakout was confirmed and if a retest was valid.
The long entry is only executed if the user-selected direction is either "Long Only" or "Both."
Short Entry:
A short entry is triggered if the price breaks below a support level and subsequently retests that level.
The short entry is only executed if the user-selected direction is either "Short Only" or "Both."
sell_condition checks whether the support has been broken and whether the retest condition is valid.
An initial stop loss is placed when the trade is opened to limit the risk if the trade moves against the position.
The stop loss is calculated based on a user-defined percentage (stop_loss_percent) of the entry price.
pinescript
Copy code
stop_loss_price := strategy.position_avg_price * (1 - stop_loss_percent / 100)
For long positions, the stop loss is placed below the entry price.
For short positions, the stop loss is placed above the entry price.
Trailing Stop:
When a position achieves a certain profit threshold (profit_threshold_percent), the trailing stop mechanism is activated.
For long positions, the trailing stop follows the highest price reached, ensuring that some profit is locked in if the price reverses.
For short positions, the trailing stop follows the lowest price reached.
Code Logic for Trailing Stop:
Exit Execution:
The strategy exits the position when the price hits the calculated stop loss level.
This includes both the initial stop loss and the trailing stop that adjusts as the trade progresses.
Code Logic for Exit:
Summary:
Breaks and Retests - Free990 uses support and resistance levels to identify breakouts, followed by retests for confirmation.
Entry Points: Triggered when a breakout is confirmed and a retest occurs, for both long and short trades.
Exit Points:
Initial Stop Loss: Limits risk for both long and short trades.
Trailing Stop Loss: Locks in profits as the price moves in favor of the position.
This strategy aims to capture the momentum after breakouts and minimize losses through effective use of stop loss and trailing stops. It gives the flexibility of selecting trade direction and ensures trades are taken with confirmation through the retest, which helps to reduce false breakouts.
Original Code by @HoanGhetti

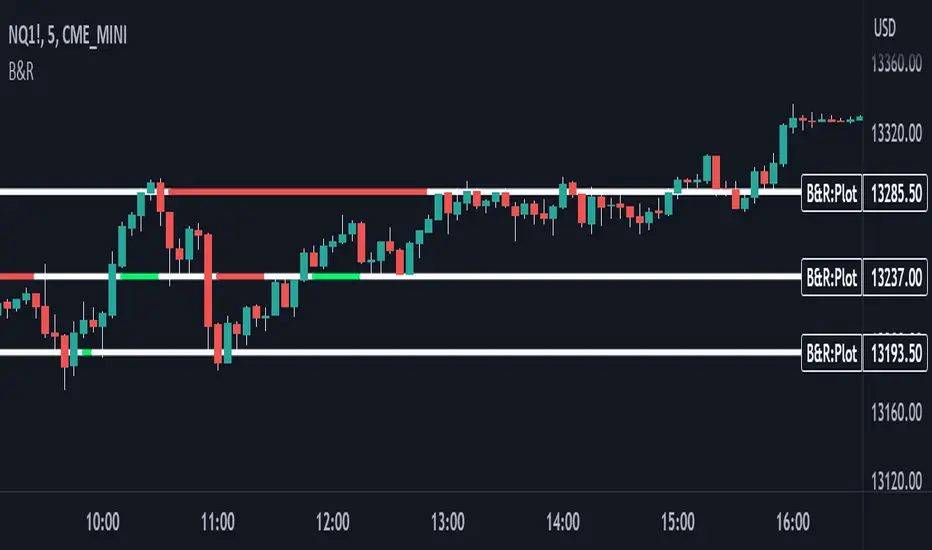
Breakouts with Tests & Retests [LuxAlgo]The Breakouts Tests & Retests indicator highlights tests and retests of levels constructed from detected swing points. A swing area of interest switches colors when a breakout occurs.
Users can control the sensitivity of the swing point detection and the width of the swing areas.
🔶 USAGE
When a Swing point is detected, an area of interest is drawn, colored green for a bullish swing and red when bearish.
A test is confirmed when the opening price is situated in the area of interest, and the closing price is above or below the area, depending on whether it is a bullish or bearish swing. Tests are highlighted with a solid-colored triangle.
A breakout is confirmed when the price closes in the opposite position, below or above the area, in which case the area will switch colors.
If the opening price is located within the area and the closing price closes outside the area, in the same direction as the breakout, this is considered a retest . Retests are highlighted with a hollow-colored triangle.
Note that tests/retests do not act on wicks. The main factor is that the opening price is in the area of interest, while the closing price is outside.
🔹 Area Of Interest Width
The user can adjust the width of the swing areas. Changing the " Width " is a fast and easy way to find different areas of interest.
A higher "Multiple" setting would return a wider area, allowing price to develop within it for a longer period of time and potentially provide later test signals.
When a swing area is broken, a higher "Width" setting can make it more complicated for the price to break it again, allowing a swing area to remain valid for a longer period of time thus potentially providing more retest signals.
🔶 DETAILS
Generally, only one bullish/bearish pattern can be active at a time. This means that no more than 1 bullish or bearish area will be active.
The " Display " settings, however, can help control how areas of different types are displayed.
Bullish AND Bearish: Both, bullish and bearish patterns can be drawn at the same time
Bullish OR Bearish: Only 1 bullish or 1 bearish pattern is drawn at a time
Bullish: Only bullish patterns
Bearish: Only bearish patterns
🔹 Test/Retest Labels
The user can adjust the settings so only the latest test/retest label is shown or set a minimum number of bars until the next test/retest can be drawn.
🔹 Maximum Bars
Users can set a limit of bars for when there is no test/retest in that period; the area of interest won't be updated anymore and will be available and ready for the next Swing.
An option for pulling the area back to the last retest is included.
🔶 SETTINGS
Display: Determines which swing areas are displayed by the indicator. See the "DETAILS" section for more information
Multiple: Adjusts the width of the areas of interest
Maximum Bars: Limit of bars for when there is no test/retest
Display Test/Retest Labels: Show all labels or just the last test/retest label associated with a swing area
Minimum Bars: Minimum bars required for a subsequent test/retest label are allowed to be displayed
Set Back To Last Retest: When after "Maximum Bars" no test/retest is found, place the right side of the area at the last test/retest
🔹 Swings
Left: x amount of wicks on the left of a potential Swing need to be higher/lower for a Swing to be confirmed.
Right: The number of wicks on the right of a potential swing needs to be higher/lower for a Swing to be confirmed.
🔹 Style
Bullish: color for test period (before a breakout) / retest period (after a breakout)
Bearish: color for test period (before a breakout) / retest period (after a breakout)
Label Size

Breakout and Retest Signals [AlgoAlpha]OVERVIEW
This script detects breakout and retest signals by identifying key pivot points in price action and analyzing their relationship with historical swing highs and lows. It highlights breakout structures using ATR-based tolerance levels and volume analysis to confirm potential trend continuations or reversals. The script marks significant price levels with dynamic boxes and dashed lines to help traders visualize breakout and retest areas effectively.
CONCEPTS
The script relies on pivot point analysis, a technique used to identify significant price levels where the market has previously reversed. It dynamically tracks a set number of recent swing highs and lows, allowing traders to see if the price is revisiting a previously significant level. The concept of breakouts and retests is widely used in technical analysis to determine potential entry points. A breakout occurs when the price moves beyond a resistance or support level, and a retest happens when the price returns to test that level before continuing in the breakout direction. This script enhances that analysis by incorporating ATR-based tolerance levels, ensuring that price zones are not too large.
FEATURES
Breakout and Retest Markings : Highlights breakout and retest areas with shaded boxes, allowing traders to visualize where price action is confirming key levels.
Volume Delta and Ratio : Analyzes volume at breakout levels to gauge the strength of the move, displaying volume delta information for additional context. The script also displays the ratio of selling to buying at the retest along traders to make better judgement on their entries.
Multi-Timeframe Adaptability : Dynamically adjusts volume analysis to align with the appropriate lower timeframe, ensuring reliable volume comparisons.
Alerts for Breakout and Retest Events : Traders can receive real-time notifications when bullish or bearish breakout retests are detected.
USAGE
This script is best suited for traders looking to identify strong breakout and retest setups across different timeframes. Users can customize the pivot detection period and swing point memory to adjust sensitivity based on their trading style. The ATR length and multiplier allow further refinement of breakout tolerance, reducing noise in volatile markets. The breakout zones are displayed as shaded boxes, where traders can assess whether a price retest is occurring under favorable conditions. Alerts can be set to notify traders of potential trade opportunities.

Support & Resistance With Breakout & RetestIntro
The Breakout Retest Indicator is a valuable tool utilized to confirm the occurrence of a proper breakout so you know when to enter on a retest. It analyses the price movement of an asset and identifies a breakout when the price level surpasses the inputted support and resistance values.
Conditions
The indicator operates based on simple yet reliable conditions. Once a candle closes above or below the specified line, the next candle's closure above or below without touching the high or low levels confirms the breakout. The indicator subsequently changes its color, signaling a long or short position. Upon retesting, it reverts to its original color.
Need Your Help
I am sharing this indicator to solicit your input in improving it. As a committed developer, I have ambitious plans for enhancing the indicator's functionality. To that end, I welcome your suggestions and ideas to build indicators that can contribute to the success of people's strategies.
Future Ideas
Some of the potential improvements that I plan to incorporate include the implementation of zones. Users will be able to define zones that require breaking above or below for a confirmed breakout. Additionally, a volume check will provide additional confirmation by evaluating the volume level relative to the breakout. Lastly, close above or below feature will ensure that a certain number of ticks, percentage, or price level has been breached to confirm the breakout.
Range Average Retest Model [LuxAlgo]The Range Average Retest Model tool highlights setups from the range average retest entry model, a model using the retest of the average between two opposite swing points as an entry.
This tool uses long-term volatility coupled with user-defined multipliers to filter out swing areas and set take profit and stop loss levels for all trades.
Key features include:
Draw up to 165 swing areas and their associated trades
Filter out swing areas using Pivot Length , Selection Mode and Threshold parameters
Filter out trades with Maximum Distance and Minimum Distance parameters
Enable or disable swing areas and select default colors
Enable or disable overlapping trades and change the default colors for Take Profit and Stop Loss zones
🔶 USAGE
The "Range Average Retest Model" is an entry model that enters a position when the price retests the average made between two swing points. Users can determine the period of the detected swing points from the "Pivot Length" setting.
The conditions for long or short trades, regardless of whether the swing area is bullish or bearish, are as follows:
Long positions: the current bar close is below the swing area average and the last bar close was above it.
Short positions: the current bar close is above the swing area average price and the last bar close was below it.
Each trade is displayed on the chart with a line connecting it to its swing area highlighting the range average, a green area for the take profit, and a red area for the stop loss.
Both the Take Profit and Stop Loss levels are calculated by applying your own multiplier in the settings panel to the long-term volatility measure, in this case, the average true range over the last 200 bars.
Trades will remain open until they reach either the Stop Loss or Take Profit price levels.
🔹 Filtering Swing Areas
The daily chart of the Nasdaq-100 futures (NQ) with pivot length 2 and bullish selection mode: it only detects bullish swing areas, but they are smaller and more numerous.
Traders can manipulate the behavior of the swing areas from the settings panel.
The Selection mode will filter areas by bias: it will detect bullish areas, bearish areas, or both.
The Threshold parameter is applied to the long-term volatility to filter out areas where the average prices are too close together; the higher the value, the greater the difference between the average prices must be.
🔹 Trades
3-minute chart of the Nasdaq-100 futures (NQ) with pivot length 5, bearish selection mode maximum distance 4, and stop loss 2: many trades detected with very asymmetric risk/reward.
The behavior of the trades is also manipulated from the settings panel.
The maximum and minimum distance parameters specify the number of bars a trade must be away from a swing area.
The Take Profit and Stop Loss parameters are applied to the long-term volatility to obtain their respective price levels.
🔹 Overlapping Trades
Same chart as before, but with overlapping trades: messy, right?
By default the tool does not show overlapping trades, this allows for a cleaner chart.
In the settings panel traders can enable overlapping mode, in which case the tool will show all available trades.
Traders must be aware that the chart can be very crowded.
🔶 SETTINGS
🔹 Swings
Pivot Length: How many bars are used to confirm a swing point. The larger this parameter is, the larger and fewer swing areas will be detected.
Selection Mode: Swing area detection mode, detect only bullish swings, only bearish swings, or both.
Threshold: Swing area comparator. This threshold is multiplied by a measure of volatility (average true range over the last 200 bars), for a new swing area to be detected it must have an average level that is sufficiently distant from the average level of any untouched swing area, this parameter controls that distance.
🔹 Trades
Maximum distance: Maximum distance allowed between a swing area and a trade.
Minimum distance: Minimum distance allowed between a swing area and a trade.
Take profit: The size of the take profit - this threshold is multiplied by a measure of volatility (the average true range over the last 200 bars).
Stop loss: The size of the stop-loss: this threshold is multiplied by a measure of volatility (the average true range over the last 200 bars).

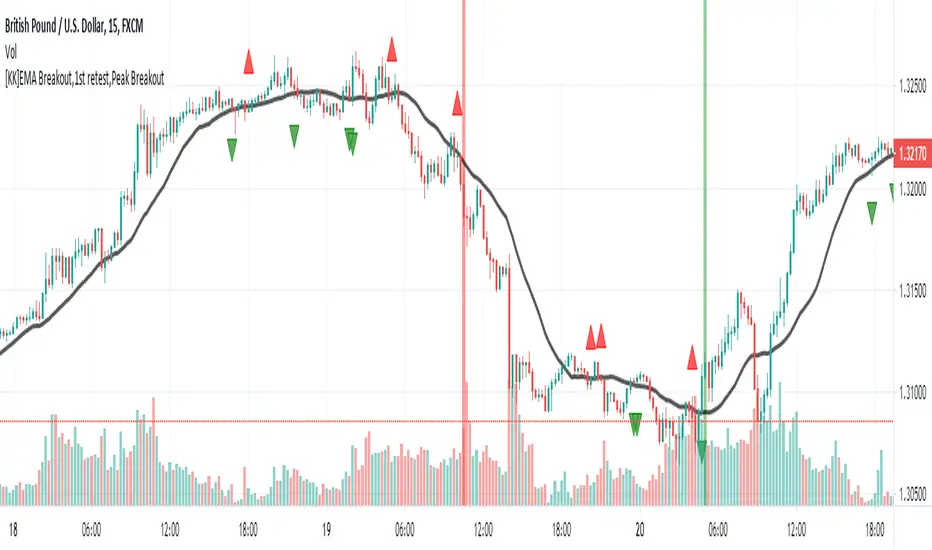
[KK]EMA Breakout,1st retest,Peak BreakoutThis script gives Signal based on 3 parameters
(1) Exponential Moving average breakout
(2)Retest after Breakout
(3) Peak Breakout after retest for conformation
Recommended Settings:
(1) EMA Length = 20 period
(2)Left Bars= Right Bars = 4
(3)15min chart resolution
Note: Default setting is what recommended.
Interpretation:
(1)Green Background = Higher Peak Breakout candle after conformed retest
(2)Red Background = Lower Peak Breakout candle after conformed retest
(3) Green circle = 1st Upward Breakout candle after conformed retest ( if previous breakout is Downward)
(4)Red circle = 1st Downward Breakout candle after conformed retest ( if previous breakout is Upward)
Note: you can additionally add backgrounds for EMA breakout and conformed Retest from code.
Signals:
(1)Long = When Green circle
(2)Short = When Red circle
This script works with any ticker id. Best Use for Equity and Forex Markets. Also, added alert condition for green and red circle.
P.S.: Thanks to @RagingRocketBull for source code for breakout candles
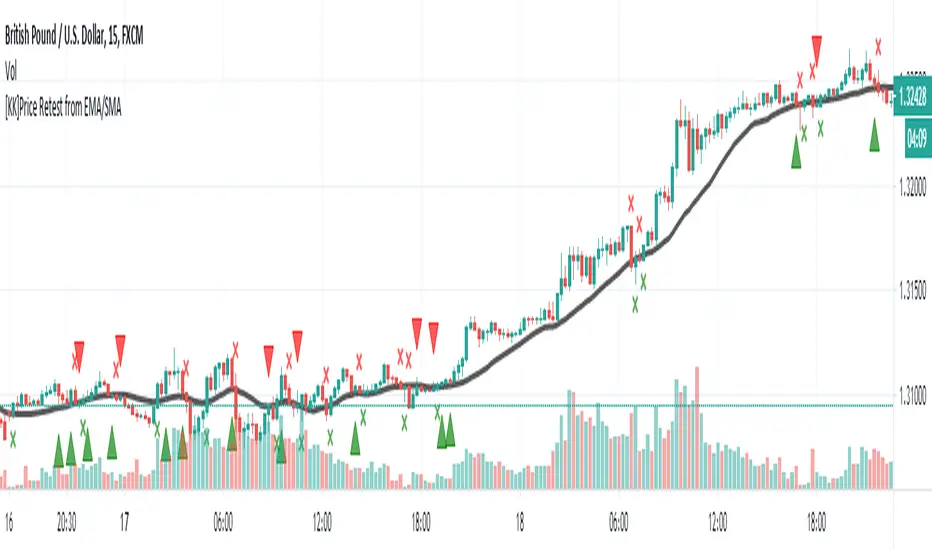
[KK]Price Retest from EMAScript show fractals on chart when price retest after breaking Exponential Moving Average.
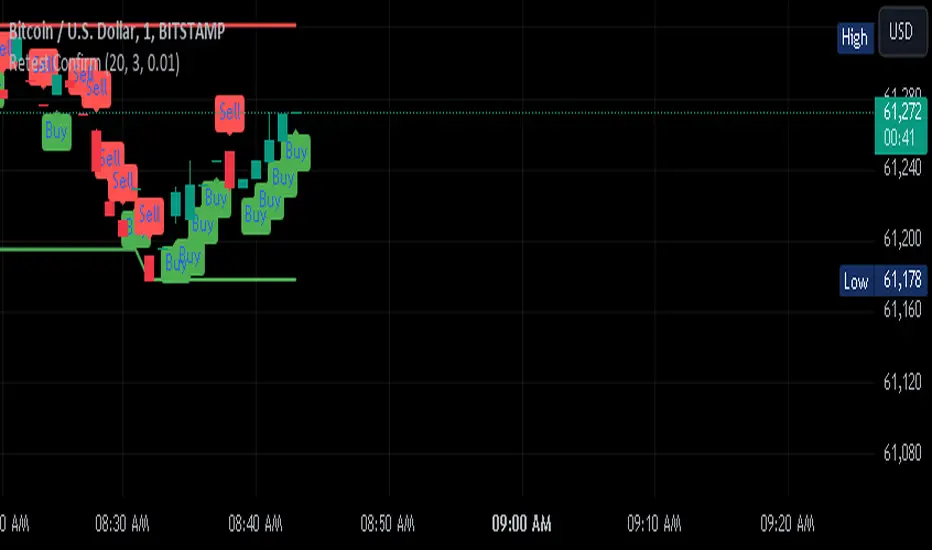
Retest Confirm Point TibbuCreating a "Retest Confirm Point" indicator that generates buy and sell signals involves defining criteria to confirm that a price retest is valid before issuing a trade signal. This generally requires identifying a key level (such as support, resistance, or a trendline), detecting a retest of this level, and then confirming the validity of the retest.
Here’s a Pine Script example to help you create such an indicator. This script identifies and confirms retests of previous highs and lows, and generates buy and sell signals based on those retests: Explanation:
Recent High and Low:
The script identifies the highest and lowest prices over a specified lookback period.
These levels are plotted on the chart as reference points.
Retest Conditions:
Retest High: The closing price is within a buffer range around the recent high.
Retest Low: The closing price is within a buffer range around the recent low.
Confirmation:
Confirm High: The closing price reaches a new high over a set number of bars after the retest condition.
Confirm Low: The closing price reaches a new low over a set number of bars after the retest condition.
Signals:
Buy Signal: Issued when a confirmed retest of the recent high occurs.
Sell Signal: Issued when a confirmed retest of the recent low occurs.
Customization:
Lookback Period: Adjust to determine the historical range for finding recent highs and lows.
Confirmation Bars: Change the number of bars used to confirm the retest.
Retest Buffer: Adjust the percentage buffer to fine-tune the retest conditions.
Testing and Optimization:
Backtest: Always backtest the strategy on historical data to ensure it behaves as expected.
Adjust Parameters: Modify parameters based on the asset, timeframe, and market conditions.
Feel free to modify this script further based on your specific trading strategy and needs. If you need help with any additional features or further customization, let me know!
ChatGPT can make mistakes. Check important info.
ENIGMA Signals with Retests Select higher Time FrameENIGMA Signals with Retests – Script Description
The "ENIGMA Signals with Retests" script is a unique indicator designed for traders who prefer precision trading based on price action retests of key levels derived from higher timeframes. This tool is ideal for those employing multi-timeframe analysis strategies, helping them detect high-probability trade entries when the price interacts with significant support and resistance levels.
What Does This Script Do?
This indicator identifies key levels from a higher timeframe selected by the user (e.g., 4-hour or daily), then tracks price action on lower timeframes to provide actionable buy and sell signals when the price retests these levels. It visually plots the key levels on the chart and triggers alerts for potential trade opportunities when conditions are met.
How It Works
Key Level Detection:
The script uses custom functions to detect recent swing highs and swing lows on the selected higher timeframe (such as 4H or Daily). These levels represent potential areas of support and resistance where price reactions are likely to occur.
Multi-Timeframe Analysis:
The indicator leverages the request.security() function to retrieve price data from the user-defined higher timeframe and plots horizontal lines on the chart for the most recent swing highs and lows.
Retest-Based Signals:
Once the key levels are plotted, the script continuously monitors the price on the lower timeframe:
A Buy Signal is triggered when the price closes below a key high level and then moves back above it, indicating a potential bullish retest.
A Sell Signal is triggered when the price closes above a key low level and then moves back below it, indicating a potential bearish retest.
These retest signals are displayed as green and red arrows on the chart, helping traders identify optimal entry points.
Alerts for Retests:
The script includes built-in alert conditions that notify traders when a valid retest signal occurs. This allows traders to react promptly without constantly monitoring the chart.
How to Use the Script
Select Your Key Timeframe:
From the input settings, choose a higher timeframe that suits your trading style (e.g., 4H for intraday trading or Daily for swing trading).
Adjust Visual Preferences:
Customize the line style (solid, dashed, or dotted) and length of the plotted levels.
Toggle labels for the levels on or off as per your preference.
Trade Execution:
Once a retest signal appears on the lower timeframe, consider entering a trade in the direction of the signal. The buy signal suggests a potential long entry, while the sell signal indicates a potential short entry.
Set Alerts:
Use the alert conditions provided to get notified whenever a valid retest occurs. This helps in reducing screen time and improving trading efficiency.
Underlying Concepts
This script is grounded in the principles of support and resistance, retests, and breakout trading. By focusing on multi-timeframe key levels, it aligns with widely used trading concepts like:
Breakout and Retest: Entering trades after a confirmed breakout and successful retest of a significant level.
Swing Highs and Lows: Recognizing swing points to identify strong price reaction zones.
Multi-Timeframe Confluence: Enhancing trade probability by ensuring that the signals on lower timeframes correspond with key levels from higher timeframes.
Why This Script Is Unique
Unlike many generic trend-following or scalping indicators, "ENIGMA Signals with Retests" offers:
Precision Signals: It only provides signals when specific retest conditions are met, reducing false signals and noise.
Multi-Timeframe Customization: Users can tailor the higher timeframe to their strategy, making it versatile for various trading styles.
Alert Functionality: Alerts are integrated, allowing traders to stay updated without constantly monitoring the charts.
This script is perfect for traders looking for a systematic way to trade retests of key levels across multiple timeframes. Whether you're a scalper, day trader, or swing trader, "ENIGMA Signals with Retests" can help improve your precision and timing in the market.

Specter Trend Cloud [ChartPrime]⯁ OVERVIEW
Specter Trend Cloud is a flexible moving-average–based trend tool that builds a colored “cloud” around market direction and highlights key retest opportunities. Using two adaptive MAs (short vs. long), offset by ATR for volatility adjustment, it shades the background with a gradient cloud that switches color on trend flips. When price pulls back to retest the short MA during an active trend, the script plots diamond markers and extends dotted levels from that retest price. If price later breaks through that level, the extension is terminated—giving traders a clean visual of valid vs. invalid retests.
⯁ KEY FEATURES
Multi-MA Core Engine:
Choose from SMA, EMA, SMMA (RMA), WMA, or VWMA as the base. The indicator tracks both a short-term MA (Length) and a longer twin (2 × Length).
Volatility-Adjusted Offset:
Both MAs are shifted by ATR(200) depending on trend direction—pulling them down in uptrends, up in downtrends—so the cloud reflects realistic breathing room instead of razor-thin bands.
Gradient Trend Cloud:
Between the two shifted MAs, the script fills a shaded region:
• Aqua cloud = bullish trend
• Orange cloud = bearish trend
Gradient intensity increases toward the active edge, providing a visual sense of strength.
Trend Flip Logic:
A flip occurs whenever the short MA crosses above or below the long MA. The cloud instantly changes color and begins tracking the new regime.
Retest Detection:
During an ongoing trend (no flip), if price retests the short MA within a 5-bar “cooldown,” the tool:
• Marks the retest with diamond shapes below/above the bar.
• Draws a dotted horizontal line from the retest price, extending into the future.
Automatic Level Termination:
If price later closes through that dotted level, the line disappears—keeping only active, respected retest levels on your chart.
⯁ HOW IT WORKS (UNDER THE HOOD)
MA Calculations:
ma1 = MA(src, Length), ma2 = MA(src, 2 × Length).
Trend = ma1 > ma2 (bull) or ma1 < ma2 (bear).
ATR shift offsets both ma1 and ma2 by ±ATR depending on trend.
Cloud Fill:
Plots ma1 and ma2 (invisible for long MA). Uses fill() with semi-transparent aqua/orange gradient between the two.
Retest Logic:
• Bullish retest: ta.crossover(low, ma1) while trend = bull.
• Bearish retest: ta.crossunder(high, ma1) while trend = bear.
Only valid if at least 5 bars have passed since last retest.
When triggered, it stores bar index and price, draws diamonds, and extends a dotted line.
Level Clearing:
If current high > retest upper line (bearish case) or low < retest lower line (bullish case), that line is deleted (stops extending).
⯁ USAGE
Use the cloud color as the higher-level trend bias (aqua = long, orange = short).
Look for diamonds + dotted lines as pullback/retest zones where trend continuation may launch.
If a retest level holds and price rebounds, it strengthens confidence in the trend.
If a retest level is broken, treat it as a warning of weakening trend or possible reversal.
Experiment with MA Type (SMA vs. EMA, etc.) to align sensitivity with your asset or timeframe.
Adjust Length for faster flips on low timeframes or smoother signals on higher ones.
⯁ CONCLUSION
Specter Trend Cloud combines trend detection, volatility-adjusted shading, and retest visualization into a single tool. The gradient cloud provides instant clarity on direction, while diamonds and dotted retest levels give you tactical entry/retest zones that self-clean when invalidated. It’s a versatile trend-following and confirmation layer, adaptable across multiple assets and styles.

CleanBreak Lines (Break + First Retest)CleanBreak lines draws one robust support line (green) from swing lows and one robust resistance line (red) from swing highs, then optionally signals a confirmed break and the first clean retest back to that line. Lines are scored with a transparent W-Score (0–100) so traders can judge quality at a glance. The script is non-repainting and uses only confirmed bar data.
What it does
Auto-builds two trendlines that aim to represent meaningful support and resistance.
Uses a median-based slope so outliers and single spikes do not distort the line.
Computes a W-Score per line from three things: touches, span (how long it held), and respect (staying on the correct side).
Optionally triggers a single, tightly-gated signal on Break + First Retest.
How it works (plain English)
Detect recent swing highs and swing lows.
Fit one line through highs and one through lows using a robust, median-style slope estimate.
Score each line: more clean touches and longer span raise the W-Score; frequent violations lower it.
A break requires a candle close beyond the line by a small ATR margin.
A first retest requires price to come back to the line within a limited number of bars and hold on close.
A single arrow may print on that confirmed retest, with optional alerts.
What it is not
Not a prediction model and not a promises-of-profit tool.
Not a multi-signal spammer: by design it aims to allow one retest entry per break.
Not a regression channel or machine-learning system.
How to use
At a glance: treat the green line as candidate support and the red line as candidate resistance.
Conservative approach: wait for a break on close and then the first retest to hold; use the arrow as a prompt, not a command.
Context-only mode: hide arrows in Style if you want the lines and W-Score only.
Inputs (brief)
Core: Swing Length, Max Pivots, Min Touches, Min Span Bars.
Scoring: Touches Max (cap), Weights for touches vs span, Min W-Score to arm.
Break and Retest: Break Margin x ATR, Retest Tolerance x ATR, Retest Window (bars).
Visuals: Show Labels, Show Table, Line Width, Fade When Refit.
Recommended presets
Cleaner, fewer signals: Min Touches 4–5, Min Span Bars 100–150, Min W-Score 70–80, Break Margin 0.40–0.60 ATR, Retest Tolerance 0.10–0.15 ATR, Retest Window 8–12 bars.
Lines-only: keep defaults and uncheck the two plotshapes in Style.
Alerts
CB Long Retest: break above the red line and first retest holds.
CB Short Retest: break below the green line and first retest holds.
Use “Once per bar close” for consistency.
On-chart table (if enabled)
RES / SUP: W-Score and distance from price in ATR terms.
Status: “Waiting Long RT”, “Waiting Short RT”, or “Idle”.
Thresholds: MinScore and Retest bars for quick context.
Timeframes
Works well on 1h to 1D. On very low timeframes, raise Break Margin x ATR to reduce whipsaw effects. On higher timeframes, increase Min Touches and Min Span Bars.
Non-repainting policy
All logic uses confirmed pivots and confirmed bar closes.
Breaks and retests are validated on close; alerts reference only confirmed conditions.
No lookahead in any request.security call.
Original implementation focused on a median-based robust slope for auto trendlines, plus a transparent W-Score and a single retest gate.
Disclosure
This script is for education and charting. It does not guarantee outcomes, and past behavior does not imply future results. Always validate on historical data and practice risk management.

Support and Resistance Logistic Regression | Flux Charts💎 GENERAL OVERVIEW
Introducing our new Logistic Regression Support / Resistance indicator! This tool leverages advanced statistical modeling "Logistic Regressions" to identify and project key price levels where the market is likely to find support or resistance. For more information about the process, please check the "HOW DOES IT WORK ?" section.
Logistic Regression Support / Resistance Features :
Intelligent S/R Identification : The indicator uses a logistic regression model to intelligently identify and plot significant support and resistance levels.
Predictive Probability : Each identified level comes with a calculated probability, indicating how likely it is to act as a true support or resistance based on historical data.
Retest & Break Labels : The indicator clearly marks on your chart when a detected support or resistance level is retested (price touches and respects the level) or broken (price decisively crosses through the level).
Alerts : Real-time alerts for support retests, resistance retests, support breaks, and resistance breaks.
Customizable : You can change support & resistance line style, width and colors.
🚩 UNIQUENESS
What makes this indicator truly unique is its application of logistic regression to the concept of support and resistance. Instead of merely identifying historical highs and lows, our indicator uses a statistical model to predict the future efficacy of these levels. It analyzes underlying market conditions (like RSI and body size at pivot formation) to assign a probability to each potential S/R zone. This predictive insight, combined with dynamic, real-time labeling of retests and breaks, provides a more robust and adaptive understanding of market structure than traditional, purely historical methods.
📌HOW DOES IT WORK ?
The Logistic Regression Support / Resistance indicator operates in several key steps:
First, it identifies significant pivot highs and lows on the chart based on a user-defined "Pivot Length." These pivots are potential areas of support or resistance.
For each detected pivot, the indicator extracts relevant market data at that specific point, including the RSI (Relative Strength Index) and the Body Size (the absolute difference between the open and close price of the candle). These serve as input features for the model.
The core of the indicator lies in its logistic regression model. This model is continuously trained on past pivot data and their subsequent behavior (i.e., whether they were "respected" as support/resistance multiple times). It learns the relationship between the extracted features (RSI, Body Size) and the likelihood of a pivot becoming a significant S/R level.
When a new pivot is identified, the model uses its learned insights to calculate a prediction value—a probability (from 0 to 1) that this specific pivot will act as a strong support or resistance.
If the calculated probability exceeds a user-defined "Probability Threshold," the pivot is designated a "Regression Pivot" and drawn on the chart as a support or resistance line. The indicator then actively tracks how price interacts with these levels, displaying "R" labels for retests when the price bounces off the level and "B" labels for breaks when the price closes beyond it.
⚙️ SETTINGS
1. General Configuration
Pivot Length: This setting defines the number of bars used to determine a significant high or low for pivot detection.
Target Respects: This input specifies how many times a level must be "respected" by price action for it to be considered a strong support or resistance level by the underlying model.
Probability Threshold: This is the minimum probability output from the logistic regression model for a detected pivot to be considered a valid support or resistance level and be plotted on the chart.
2. Style
Show Prediction Labels: Enable or disable labels that display the calculated probability of a newly identified regression S/R level.
Show Retests: Toggle the visibility of "R" labels on the chart, which mark instances where price has retested a support or resistance level.
Show Breaks: Toggle the visibility of "B" labels on the chart, which mark instances where price has broken through a support or resistance level.

Breaks and Retests with Volatility Stop [HG]The "Breaks and Retests with Volatility Stop " indicator is a powerful tool designed to assist traders in identifying key support and resistance levels, breakouts, retests, and potential trend reversals. This indicator combines two essential components: support and resistance detection, and a Volatility Stop indicator for improved risk management. Below are the key features of this indicator:
**Support and Resistance Detection:**
- **Lookback Range:** Users can customize the lookback range, determining how many bars are considered when identifying support and resistance levels. This allows for flexibility in capturing short-term or longer-term levels.
- **Bars Since Breakout:** The indicator helps traders spot retests by allowing them to specify the number of bars that should occur since a breakout before considering it a potential retest.
- **Retest Detection Limiter:** Traders can set a limit on how many bars should be actively checked during a potential retest event. This feature prevents retest alerts from occurring too late, ensuring more accurate results.
- **Breakouts and Retests:** Users can choose to display or hide breakout and retest events separately, tailoring the indicator to their specific trading strategy.
- **Repainting Options:** The indicator offers three repainting options: "On," "Off: Candle Confirmation," and "Off: High & Low." This provides flexibility in choosing the repainting behavior that suits your trading style.
**Styling Options:**
- **Outline and Extend:** Traders can customize the appearance of support and resistance boxes by selecting outline styles and extension preferences.
- **Label Types and Sizes:** The indicator offers two label types, "Full" and "Simple," allowing traders to choose the level of detail displayed on the chart. Additionally, users can adjust the label size for better visibility.
- **Customizable Colors:** Support and resistance levels can be color-coded to match your preferred charting style, enhancing visibility and clarity.
- **Override Text Color:** If desired, traders can override the text color for labels, providing further customization of the indicator's appearance.
**Alerts and Notifications:**
- The indicator generates various alerts and notifications to keep traders informed about critical market events, including:
- New Support and Resistance Levels
- Support and Resistance Breakouts
- Support and Resistance Retests
- Potential Support and Resistance Retests
**Volatility Stop Indicator:**
- The "Breaks and Retests with Volatility Stop " indicator also includes a Volatility Stop component, which helps traders manage risk by indicating potential stop-loss levels based on market volatility. The Volatility Stop is color-coded to reflect the current trend direction, making it easy to identify potential trend reversals.
In summary, this TradingView indicator is a comprehensive tool designed to enhance your technical analysis and trading decisions. It provides support and resistance levels, breakout and retest alerts, and incorporates a Volatility Stop indicator for risk management, making it a valuable addition to any trader's toolkit.

200 EMA Breakout & Retest Strategy200 EMA Breakout & Retest Strategy
This script is designed for traders who rely on the 200 EMA as a key indicator for trend direction and trade setups. The strategy identifies potential buy and sell opportunities based on breakouts and subsequent retests of the 200 EMA.
How It Works
EMA Breakout Detection:
The script monitors when the price crosses and closes above or below the 200 EMA.
No signal is generated immediately upon the breakout.
Retest Confirmation:
After the breakout, the price must retrace to touch the 200 EMA.
A valid signal occurs only when the price touches the EMA and the candle closes above (for buy) or below (for sell).
Trade Signal Generation:
Once the retest is confirmed:
A Buy Signal is generated if the price closes above the 200 EMA after the retest.
A Sell Signal is generated if the price closes below the 200 EMA after the retest.
The script calculates:
Stop Loss: Placed at the low of the candle for a buy signal and at the high of the candle for a sell signal.
Take Profit: Based on a customizable Risk-Reward Ratio (default is 1:2).
Visual Indicators:
The 200 EMA is plotted on the chart for reference.
Buy/Sell signals are displayed as labels on the chart.
Stop loss and take profit levels are drawn using dotted lines.
Customization Options
EMA Length: Adjustable (default is 200).
Risk-Reward Ratio: Customizable to suit different trading styles.
Who Is This For?
This strategy is ideal for traders who:
Prefer trading with the trend using EMA-based strategies.
Look for precise entry points with confirmation from retests.
Require automated calculation of risk-reward levels.

Dynamic Volume Clusters with Retest Signals (Zeiierman)█ Overview
The Dynamic Volume Clusters with Retest Signals indicator is designed to detect key Volume Clusters and provide Retest Signals. This tool is specifically engineered for traders looking to capitalize on volume-based trends, reversals, and key price retest points.
The indicator seamlessly combines volume analysis, dynamic cluster calculations, and retest signal logic to present a comprehensive trading framework. It adapts to market conditions, identifying clusters of volume activity and signaling when the price retests critical zones.
█ How It Works
⚪ Volume Cluster Detection
The indicator dynamically calculates volume clusters by analyzing the highest and lowest price points within a specified lookback period.
Cluster Logic:
Bright Lines (Strong Red/Green):
These indicate that the price has frequently revisited these levels, creating a dense cluster.
Such areas serve as support or resistance, where significant historical trading has occurred, often acting as barriers to price movement.
Traders should consider these levels as potential reversal zones or consolidation points.
Faded or Darker Lines:
These lines indicate areas where the price has less historical activity, suggesting weaker clustering.
These zones have less market memory and are more likely to break, supporting trend continuation and rapid price movement.
⚪ Candle Color Logic (Market Memory)
Blue Candles (High Cluster Density):
Candles turn blue when the price has revisited a particular area many times.
This signals a highly clustered zone, likely to act as a barrier, creating consolidation or range phases.
These areas indicate strong market memory, potentially rejecting price attempts to break through.
Green or Red Candles (Low Cluster Density):
Once the price breaks out of these dense clusters, the candles turn green (bullish) or red (bearish).
This suggests the price has moved into a less clustered territory, where the path forward is clearer and trends are likely to extend without immediate resistance.
⚪ Retest Signal Logic
The indicator identifies critical retest points where the price crosses a cluster boundary and then reverses. These points are essential for traders looking to catch continuation or reversal setups.
⚪ Dynamic Price Clustering
The indicator dynamically adapts the clustering logic based on price movement and volume shifts.
Uses a dynamic moving average (VPMA) to maintain adaptive cluster levels.
Integrates a Kalman Filter for smoothing, reducing noise, and improving trend clarity.
Automatically updates as new data is received, keeping the clusters relevant in real-time.
█ How to Use
⚪ Trend Following & Reversal Detection
Use Retest signals to identify potential trend continuation or reversal points.
⚪ Trading Volume Clusters and Market Memory
Identify Key Zones:
Focus on bright, saturated cluster lines (strong red or green) as they indicate high market memory, where price has spent significant time in the past.
These zones are likely to exhibit a more choppy market. Apply range or mean reversion strategies.
Spot Potential Breakouts:
Faded or darker cluster lines indicate areas of low market memory, where the price has moved quickly and spent less time.
Use these areas to identify possible trend setups, as they represent lower resistance to price movement.
⚪ Interpreting Candle Colors for Market Phases
Blue Candles (High Cluster Density):
When candles turn blue, it signals that the price has revisited this area multiple times, creating a dense cluster.
These zones often trap price movement, leading to consolidations or range phases.
Use these areas as caution zones, where price can slow down or reverse.
Green or Red Candles (Low Cluster Density):
Once the price breaks out of these clustered zones, the candles turn green (bullish) or red (bearish), indicating lower market memory.
This signals a trend initiation with less immediate resistance, ideal for momentum and breakout trades.
Use these signals to identify emerging trends and ride the momentum.
█ Settings
Range Lookback Period: Sets the number of bars for calculating the range.
Zone Width (% of Range): Determines how wide the volume clusters are relative to the calculated range.
Volume Line Colors: Customize the appearance of bullish and bearish lines.
Retest Signals: Toggle the appearance of Triangle Up/Down retest markers.
Minimum Bars for Retest: Define the minimum number of bars required before a retest is valid.
Maximum Bars for Retest: Set the maximum number of bars within which a retest can occur.
Price Cluster Period: Adjusts the sensitivity of the dynamic clustering logic.
Cluster Confirmation: Controls how tightly the clusters respond to price action.
Price Cluster Start/Peak: Sets the minimum and maximum touches required to fully form a cluster.
-----------------
Disclaimer
The content provided in my scripts, indicators, ideas, algorithms, and systems is for educational and informational purposes only. It does not constitute financial advice, investment recommendations, or a solicitation to buy or sell any financial instruments. I will not accept liability for any loss or damage, including without limitation any loss of profit, which may arise directly or indirectly from the use of or reliance on such information.
All investments involve risk, and the past performance of a security, industry, sector, market, financial product, trading strategy, backtest, or individual's trading does not guarantee future results or returns. Investors are fully responsible for any investment decisions they make. Such decisions should be based solely on an evaluation of their financial circumstances, investment objectives, risk tolerance, and liquidity needs.

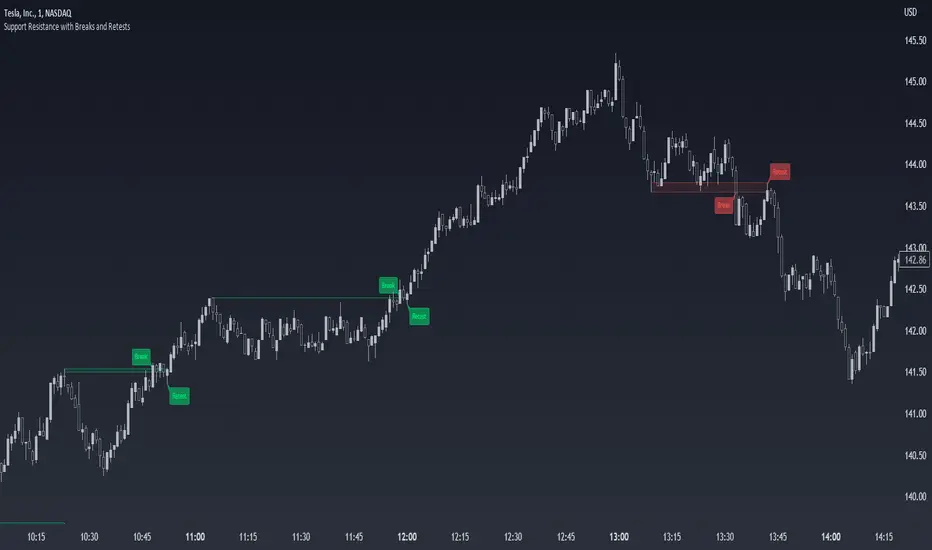
Support Resistance with Breaks and RetestsThe Break and Retest indicator strives to provide a visual aid for spotting areas of continuation and pullbacks. Support and resistance levels are drawn out automatically and have sequential conditions in place to determine a breakout following an eventual retest. Additionally, there are methods in place that try and detect liquidation events and still output a retest.
Although there are options to adjust repaint settings, "potential labels" are structured in a way to detect live ongoing retest events and therefore will be the only thing in the script that will be forced to repaint.
🔳 Settings
Lookback Range: Lookback period to trigger a new support/resistance level when pivot conditions are met.
Bars Since Breakout: How many bars since breakout in order to detect a retest.
Retest Detection Limiter: Whenever a potential retest is detected, the indicator knows that a retest is about to happen. In that given situation, this input grants the ability to raise the limit on how many bars are allowed to be actively checked while a potential retest event is active. For example, if you see the potential retest label, how many bars do you want that potential retest label to be active for to eventually confirm a retest?
🔳 Repaint Options
By default, the break and retest system uses the current close value to determine a condition. (Repaints by default)
On: Allows repainting
Off - Bar Confirmation: Prevents repainting and generates alerts when the bar closes. (1 candle later)
Off - High & Low: Prevents repainting, but in return utilizes both the high and low values instead of the close which may yield a higher outcome and inaccurate results.
🔳 How it works
In the background, calculations aren't searching for the perfect retest within the zone but instead focuses its attention towards price fluctuation around the zones. This allows the indicator to yield more results than it would otherwise.
The chart below provides an example of how potential retests are established. These are updated constantly until a retest is confirmed, and deleted if not. If a potential retest is active and the next candle drops below the value when the potential retest was detected, a retest is placed..
🔳 Alerts
byquan Indicator A - EMA20 Early Retest BUY (Trend Filter)Indicator A – EMA20 Early Retest (Trend-Filtered Buy Setup)
Overview
Indicator A – EMA20 Early Retest is a trend-following tool designed to identify early pullback buy opportunities using only EMA structure, without relying on candlestick patterns.
The indicator focuses on:
EMA alignment
EMA momentum
Controlled pullbacks
Early retests before a full breakout
It is designed to generate one signal per trend leg, helping reduce noise and repeated entries.
⚠️ This indicator is intended for educational and analytical purposes only. It does not provide trading advice or guarantee any performance.
Core Concept
The logic behind Indicator A is based on a simple observation:
In a healthy uptrend, EMA20 often pulls back after a strong move, then retests near its previous peak before continuing.
Instead of waiting for a breakout or reacting late, this indicator attempts to highlight early retest zones, where momentum may resume while risk remains relatively controlled.
EMA Structure Used
The indicator uses three exponential moving averages:
EMA20 → short-term momentum
EMA50 → medium-term trend
EMA100 → higher timeframe structure
Only the EMA values themselves are used.
No candle shapes, wicks, or price patterns are involved.
Buy Conditions (High-Level)
A BUY signal is considered only when all of the following steps occur in sequence:
1. EMA20 Crosses Up
EMA20 must cross above EMA50 or EMA100, signaling the start of a potential bullish momentum phase.
This event initializes a new setup.
2. EMA20 Builds a Peak
After the cross:
EMA20 continues rising
The indicator tracks the highest EMA20 value
The peak is considered valid only after EMA20 starts declining for more than one step, helping avoid minor fluctuations
3. Deep Pullback Requirement
EMA20 must pull back by a minimum percentage of the total move from:
the cross point → to the EMA20 peak
This pullback depth is configurable (default: 25%).
Shallow pullbacks are ignored.
4. Early Retest Zone
After a valid pullback, the indicator waits for EMA20 to rise again and reach approximately 90% of the previous EMA20 peak.
This is called an early retest:
The peak does not need to be broken
Momentum resumption is detected before a full breakout
5. Trend Filter (Critical)
A BUY signal is allowed only if:
EMA50 is above EMA100
This filter ensures that signals are aligned with the broader trend structure and helps avoid counter-trend setups.
If the early retest occurs while this condition is not met, the setup is discarded permanently.
Signal Behavior
Only one BUY signal is generated per EMA20 trend cycle
After a signal (or a discarded setup), the indicator locks and waits for a new EMA20 cross
This design prevents repeated or clustered signals
Inputs Explained
Pullback Depth (%)
Defines how deep EMA20 must retrace from its peak before a retest is considered.
Early Retest Ratio
Defines how close EMA20 must return to its previous peak (default: 90%).
These parameters allow users to adapt the indicator to different timeframes or market conditions.
How to Use the Indicator
Indicator A is best used as:
A trend continuation confirmation tool
A confluence layer, combined with:
Higher timeframe analysis
Risk management rules
Personal trading plans
It is not designed to:
Predict market direction
Replace risk management
Act as a standalone trading system
Timeframes & Markets
The indicator can be applied to:
Forex
Crypto
Indices
Stocks
Performance and behavior may vary depending on:
Market volatility
Timeframe
EMA sensitivity
Users are encouraged to observe and test the indicator in their own environment.
Final Notes
This script is intentionally designed to be:
Rule-based
Conservative
Noise-resistant
All logic is deterministic and transparent.
There are no repainting elements.
Always evaluate indicators as part of a broader analytical framework.
Past behavior does not imply future results.

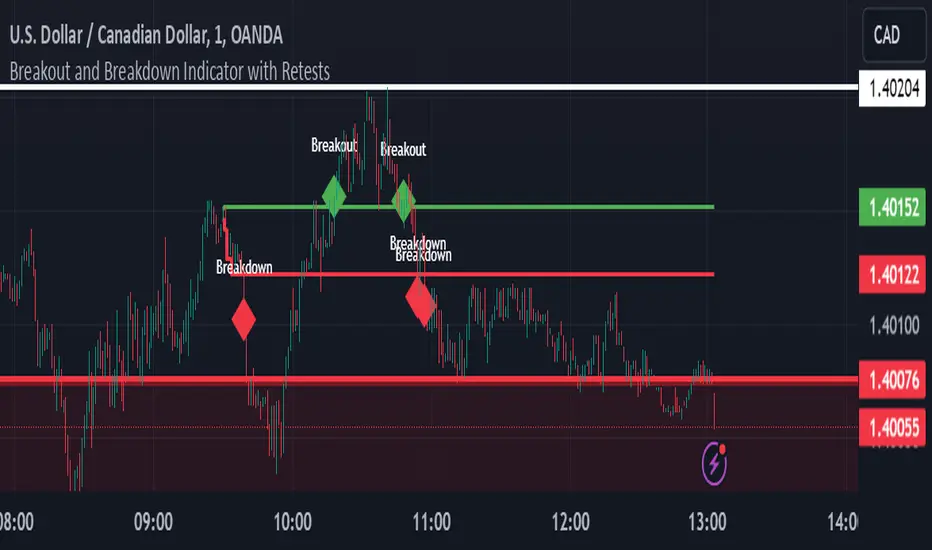
Breakout and Breakdown Indicator with RetestsThis indicator is designed to help traders identify high-probability breakout and breakdown points based on the first 5 minutes of market activity (9:30 am to 9:35 am). It works effectively on both the 1-minute and 5-minute timeframes, making it ideal for day traders and scalpers.
This indicator is a better indicator of my previous 5-Minute Opening Range Breakout indicator.
Key Features:
Dynamic Support and Resistance Lines: Automatically plots the highest and lowest price levels from 9:30 am to 9:35 am, providing essential support and resistance zones.
Breakout/Breakdown Detection: Identifies and marks successful breakout and breakdown points only after a confirmed retest, ensuring more accurate signals.
Visual Markers: Uses customizable green diamonds for successful breakouts and red diamonds for successful breakdowns, allowing easy identification on the chart.
Customization Options:
Change Colors: You can personalize the color of the breakout and breakdown markers, the label text, and the lines drawn from the 9:30 am to 9:35 am window.
Adapt to Your Chart: Adjust the indicator to match your preferred charting theme, ensuring it blends seamlessly with your trading setup.
How It Works:
Plots Key Levels: Identifies the highest and lowest prices during the first 5 minutes of trading (9:30 am to 9:35 am) and plots them on the chart.
Monitors Retests: Waits for a retest of these levels before confirming a breakout or breakdown.
Labels Breakouts/Breakdowns: After a retest, successful breakouts are marked with green diamonds and "Breakout" text, while breakdowns are marked with red diamonds and "Breakdown" text.
Why Use This Indicator?
Avoid False Signals: The retest requirement helps filter out false breakouts and breakdowns, offering more reliable trading signals.
Works Across Timeframes: Suitable for both 1-minute and 5-minute charts, allowing flexibility for different trading styles.
Some what Customizable: Adjust colors to fit your charting preferences and enhance visual clarity.
Recommended Use: Combine this indicator with other technical analysis tools, such as volume, candlestick patterns, or moving averages, for more informed trading decisions.
VWAP Retest + EMA9 Cross + Candle Pattern V2📈 VWAP Retest + EMA9 Cross + Candle Pattern Strategy_V2
Setup: This intraday momentum strategy combines 3 core elements:
• VWAP Retest: Price retests VWAP within a small buffer zone
• EMA9 Crossover: EMA9 crosses above VWAP within the last 3 bars
• Bullish Candle Pattern: At least one bullish signal — Hammer, Engulfing, or Momentum candle
A trade is triggered only during the US morning session (9:30–12:30 EST) and only if price is above yesterday’s high, suggesting strong momentum.
⚙️ Strategy Settings
• Initial Capital: $100,000
• Position Sizing: 10% of equity per trade
• Commission: 0.03% per trade
• Slippage: 1 tick
• Take Profit: +3% from entry
• Stop Loss: 0.5% below VWAP at entry
• Forced Exit: 1:00 PM EST
📊 Strategy Logic
• VWAP Retest Filter ensures entry is near a value zone.
• EMA9 Cross Confirmation aligns short-term momentum with volume-weighted price.
• Bullish Candle Patterns provide price action confirmation:
○ ✅ Hammer
○ ✅ Bullish Engulfing
○ ✅ Large momentum body
• Above Yesterday’s High (YH) acts as a bullish bias filter.
🧪 Backtest Results (Jan 2023 – Oct 2025)
• Total Trades: 120
• Win Rate: 52.5%
• Profit Factor: 1.18
• Max Drawdown: 1.22%
• Net P&L: +$1,064 (+1.06%)
Due to chart data limits, only part of the period may be visible on publication charts.
🔍 Chart Visuals
This strategy plots:
• VWAP (white) and EMA9 (orange)
• Candle pattern markers:
○ “H” = Hammer
○ “BE” = Bullish Engulfing
○ “M” = Momentum Candle
• “SETUP” label when all conditions are met
• YH/YL labels for context — previous day’s high/low
💡 Use Case
This setup is designed for intraday momentum scalping, ideal for traders who:
• Trade morning breakouts
• Use VWAP as a dynamic support/resistance
• Want clear, rule-based entries based on both trend and price action
Educational and research use - not financial advice.

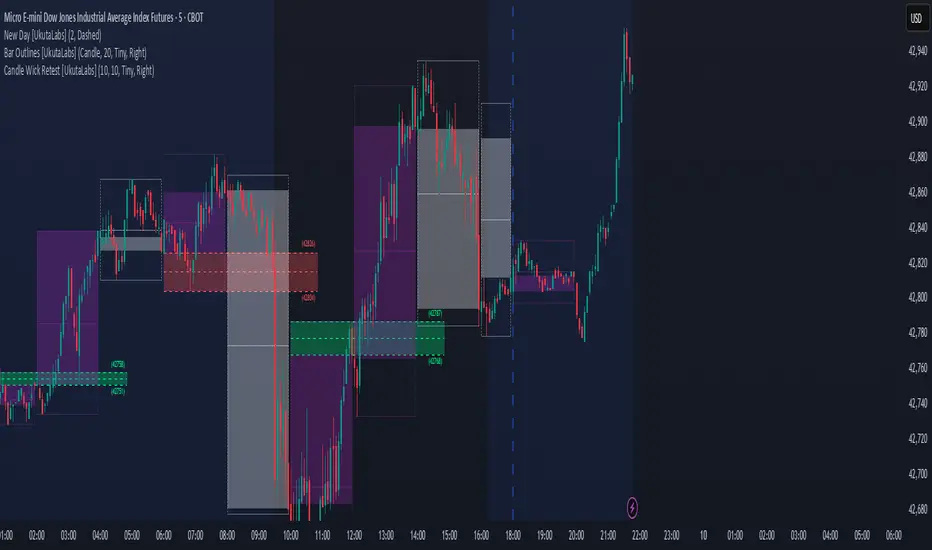
Candle Wick Retest [UkutaLabs]█ OVERVIEW
The Candle Wick Retest Indicator identifies untested wicks in real time that occur when there is an imbalance in the number of buyers and sellers at a price-level. This imbalance occurs when a market exchange receives too many of one kind of order, and not enough of its counterpoint.
Candle Wick Retest is a powerful trading indicator that will automatically identify and label strong ranges on traders’ charts that can be incorporated into a wide variety of different trading strategies.
█ USAGE
The script automatically identifies and measures real-time ranges of imbalance between buying and selling pressure in the market using real-time price-action information. These levels indicate potential Supply and Demand zones which serve to help the trader identify areas where price has changed direction in the past due to an imbalance of buyers and sellers.
The script also allows users to mirror higher time frame Candle Wick Retests onto lower time frame charts to gain a stronger understanding of key levels on another scale.
█ SETTINGS
Configuration
- Show Labels: Determines whether or not identification labels are drawn on the chart.
- Max CW Display: Determines the number of Candle Wick Retests that will be drawn on the chart. This is for each higher timeframe option that is toggled, not the total.
Current Time Frame
- Wick Retest (On/Off): Determines whether wick retests will be drawn from the current time frame chart.
- Wick Retest Bullish Color: Determines the color of bullish wick retests from the current time frame.
- Wick Retest Bearish Color: Determines the color of bearish wick retests from the current time frame.
5 Minute (Higher Timeframe)
- Wick Retest (On/Off): Determines whether wick retests will be drawn from the 5 minute chart.
- Wick Retest Bullish Color: Determines the color of bullish wick retests from the 5 minute time frame.
- Wick Retest Bearish Color: Determines the color of bearish wick retests from the 5 minute time frame.
15 Minute (Higher Timeframe)
- Wick Retest (On/Off): Determines whether wick retests will be drawn from the 15 minute time frame chart.
- Wick Retest Bullish Color: Determines the color of bullish wick retests from the 15 minute time frame.
- Wick Retest Bearish Color: Determines the color of bearish wick retests from the 15 minute time frame.
30 Minute (Higher Timeframe)
- Wick Retest (On/Off): Determines whether wick retests will be drawn from the 30 minute time frame chart.
- Wick Retest Bullish Color: Determines the color of bullish wick retests from the 30 minute time frame.
- Wick Retest Bearish Color: Determines the color of bearish wick retests from the 30 minute time frame.
60 Minute (Higher Timeframe)
- Wick Retest (On/Off): Determines whether wick retests will be drawn from the 60 minute time frame chart.
- Wick Retest Bullish Color: Determines the color of bullish wick retests from the 60 minute time frame.
- Wick Retest Bearish Color: Determines the color of bearish wick retests from the 60 minute time frame.
240 Minute (Higher Timeframe)
- Wick Retest (On/Off): Determines whether wick retests will be drawn from the 240 minute time frame chart.
- Wick Retest Bullish Color: Determines the color of bullish wick retests from the 240 minute time frame.
- Wick Retest Bearish Color: Determines the color of bearish wick retests from the 240 minute time frame.
Daily (Higher Timeframe)
- Wick Retest (On/Off): Determines whether wick retests will be drawn from the daily time frame chart.
- Wick Retest Bullish Color: Determines the color of bullish wick retests from the daily time frame.
- Wick Retest Bearish Color: Determines the color of bearish wick retests from the daily time frame.
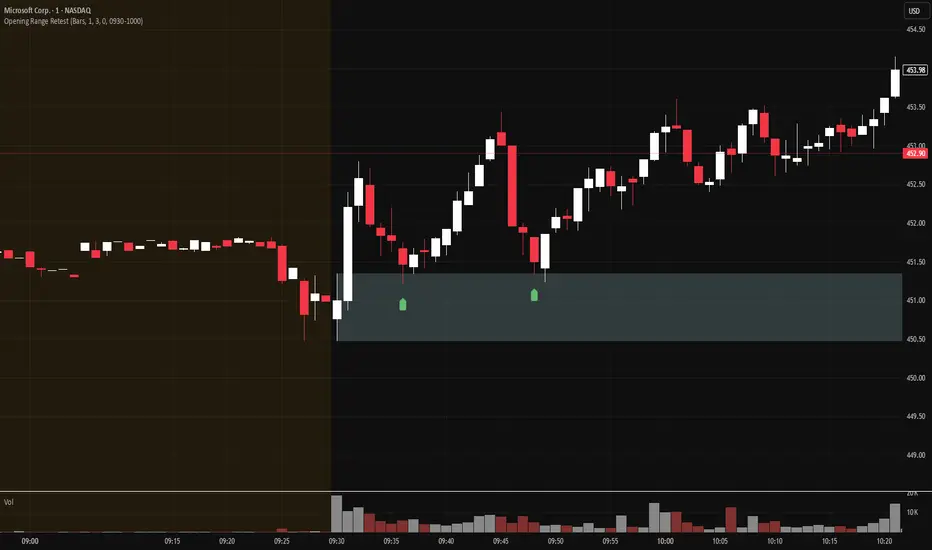
Opening Range Retest█ OVERVIEW
This indicator shows the opening range as a box. It also draws markers and triggers alerts when the opening range is retested. The opening range time is configurable, as is the period of time that must elapse before each return to the opening range is considered a retest.
█ FEATURES
Opening range time configurable in bars or minutes
Configurable "resting" period between the end of the opening range or since the last retest before a new retest is considered valid
Configurable tolerance so that a retest can trigger sooner
Active time range can be used to filter alerts and markers to a specific time window
Visual box showing the opening range, which can be optionally limited to the above-mentioned active time window
Well-documented, high-quality, open-source code for those interested
█ CONCEPTS
This indicator can be used for an opening range retest trading strategy, where long or short positions are taken on the retest of the opening range.
The opening range can be user-configured, so it is suitable for use with any opening range time period (e.g., 1-min, 5-min, 15-min, etc.).
The markers and alerts are equivalent, in the sense that whenever a marker appears, an alert will also trigger (assuming the user has set an alert up).
The alert active time range is simply used as a filter for markers and alerts, meaning that these will not draw or trigger outside of the specified time range.
█ LIMITATIONS
The indicator is intended for equities that have a highly active regular market open. For other security types, it will draw the opening range box from whenever TradingView specifies the market open time.
MTF Breakout/RetestIntroducing the MTF (Multi Timeframe) Breakout and Retest Indicator:
This indicator is designed to enhance your trading strategy by providing a clear view of support and resistance levels across multiple timeframes. What this simply means is that you can input your levels, and be on a lower timeframe such as the 1 minute timeframe, and are able to see when your support or resistance level has a breakout
📈 Short Trade Breakout Condition:
- Definition: A short breakout occurs when a candle closes below your specified support level on any chosen timeframe.
- Confirmation: It confirms as a valid short signal when a second candle closes below the support level without retesting.
- Visual Clarity: The indicator highlights the timeframe in which this breakout has occurred.
(Long conditions are same but reversed, and will be displayed in color green)
📊 Multi-Timeframe Insights:
- Scope: You can analyze support and resistance levels across various timeframes, including 5, 15, 30, and 60 minutes, while trading on a lower timeframe like 1 minute.
🎨 Dynamic Color-Coding:
- Visual Signaling: The indicator employs color-coding to visually signal breakout events. When a short breakout occurs on any timeframe the timeframe color will highlight red, and vice versa for long will highlight green. The physical line will change color based on the current timeframe you are viewing
- Real-Time Tracking: Colors reset when a level is retested, helping you track market sentiment in real-time.
🪙 Need Your Help
- I am still very much new to coding, and this code is clearly not optimized well. This code was mainly the based idea, and over the next coming months I will be working to enhance the code but I need tradingview help. If you are a coder and see a way to optimize this code please please let me know :)
